1 September 1988
Studies of Marine Epiphytic Algae, Calvi, Corsica. I.
Determination of Minimal Sampling Areas for
Microscopic Algal Epiphytes
By A.
WILMOTTE,
A. GOFFART and V. DEMOULIND@artement de Botanique, B.22, Universitk de Liege (Sart Tilman), B-4000 Likge L Belgium
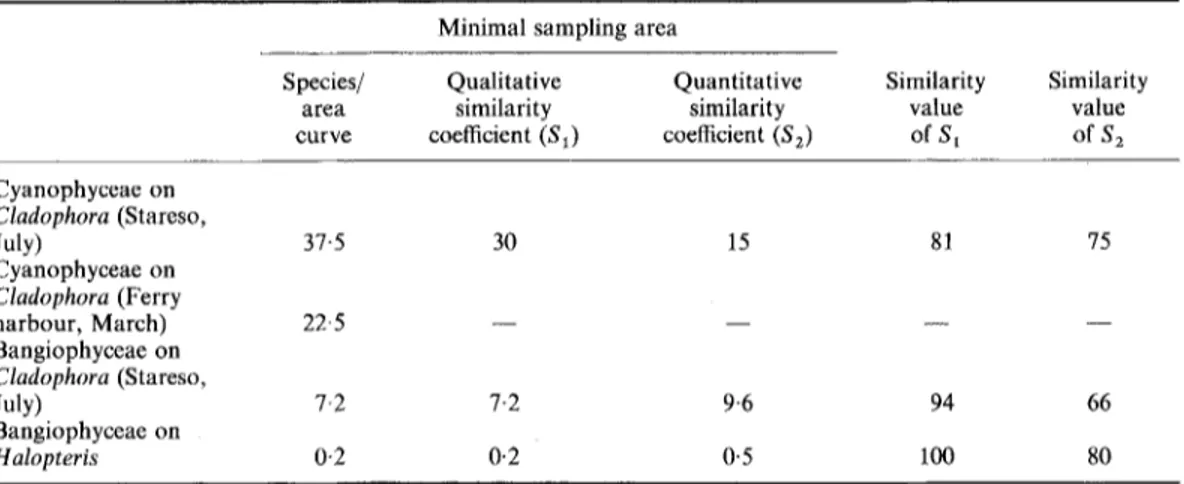
Minimal sampling areas have been determined for marine Bangiophyceae and Cyanophyceae epiphytic on Cladophora prolifera and Halopteris scoparia in Calvi, Corsica. This was done by observing the stabilization of species/area curves and of qualitative and quantitative similarity coefficients between samples of increasing size. For Cyanophyceae (studied only on Cladophora) the minimal sampling area is in the order of 15-38mm 2, depending on the method used. The sampling area is smaller when the quantitative similarity coefficient is used, apparently because of the rather homogeneous distribution of a few abundant taxa. For the same reason the quantitative similarity coefficient stabilizes at a high value (75%). For Bangiophyceae on Cladophora, the area is of the order of 7-10 mm 2, but a larger area is necessary for the quantitative than for the qualitative coefficient. The stabilized value of the quantitative coefficient is relatively low (66%), despite the fact that the qualitative coefficient reaches 94%. On Halopteris, by counting only on medium sized ramifications (about 100 ~tm in diameter), one can use a sampling area as low as 0-1-0-5 mm 2 and obtain a qualitative similarity coefficient of 100% and a quantitative one of 80%. This study demonstrates that techniques used for macrophytic vegetation can be applied with success to microscopic epiphytes.
Seaweeds are often covered by an a b u n d a n t growth of smaller algae. Although t h e larger epiphytes are usually included in vegetation studies, together with their basi- phytes, the microscopic ones have been relatively little studied (Round, 1981: ch. 6). These, however, have a significant ecological role, e.g. the nitrogen fixing blue-green algae. A prerequisite of any investigation of such communities is the determination o f the minimal sample size necessary to characterize such populations. This is a critical ecological problem and the object of n u m e r o u s publications concerning terrestrial biota (Gounot, 1969; Kershaw, 1973) and seaweed communities (Boudouresque, 1971, 1974; Nedelec, 1979; Coppejans, 1980). We have approached this p r o b l e m for C y a n o - phyceae and Bangiophyceae, two groups that are especially i m p o r t a n t in the early colonization of the youngest parts of growing seaweeds. In addition, these groups
show a major development in nutrient enriched environments, such as harbours, and are thus i m p o r t a n t in the study of the algal vegetation of disturbed habitats (Golubi6, 1970; M u n d a , 1974; Belsher & Boudouresque, 1976; Whitton & Potts, 1982; Marcot-Coqueugniot, Boudouresque & Knoepffler, 1984).
M A T E R I A L S A N D M E T H O D S The basiphytes studied were the green alga Cladophora prolifera (Roth) Kfitz., which is a pollution-tolerant species abundant in harbours (Hoek, 1963; Schramm & Booth, 1981) and a substrate transparent enough for an easy study of microscopic epiphytes, and the brown alga Halopteris scoparia (L.) Sauv. [Stypocaulon s. (L.) Kfitz.] a widespread species in the Calvi area (Corsica) where we are conducting studies on algal vegetation. Collecting was done by SCUBA diving and the material preserved in 5% formaldehyde in sea-water. Both Bangiophyceae and Cyanophyceae were studied on C. prolifera
0007 1617/88/030251 +08 $03.00/0 © 1988 British Phycological Society
collected in July 1981 at a depth of 1-5 m in the harbour of STARESO (field station of the University of Li6ge on Punta Revellata near Calvi). Cyanophyceae were also studied on
C. proliJera
in the ferry harbour of Calvi (March 1982, depth 5 m) and Bangiophyceae onH. scoparia
collected outside the harbours (NE of Calvi citadelle, September 1981, depth 5 m).For the determination of the minimal sampling area we have used three approaches: the species/area curve and techniques using a qualita- tive and a quantitative similarity coefficient. The species/area curve presents the relationship between the number of species encountered and the size of the sample. With the similarity coefficients, one observes the stabilization of the similarity coefficient calculated between samples of equal size as this size increases. In this study, the value given is the mean of three coefficients calculated by comparing three samples. We have utilized two widely used coefficients, the qualita- tive one of Sorensen (1948) and the quantitative one attributed to Kulczynski by Boudouresque (1971) and to Czekanowski by Goodall (1973).
The Sorensen coefficient is defined as
S - 2Cpq
× 100,np -}- nq
where
Cpq
is the number of taxa common to samples p and q, np and nq the number of taxa present respectively in samples p and q.The Czekanowski coefficient is
2 ~ inf(Rip , Riq )
S - i=~ × 100,
~ Ripd- ~ Riq
i = 1 i = 1
where for n taxa, Rip and
Riq
a r e respectively thenumber of individuals of taxon i in sample p and q, and inf
(Rie, Riq)
is the lowest of the two valuesRip
andRiq.
The approaches employed in this study require identification of taxa (species) as well as indivi- duals for the purposes of quantification of data. The use of these concepts for microorganisms in general, and for Cyanophyceae in particular, is not standardized. For the purposes of this study we have introduced our own definitions.
The species concept for Bangiophyceae (six taxa) is close to that used by Garbary, Hansen & Scagel (1980). For the Cyanophyceae (13 taxa) the species concept employed (reported in the following paper of this series), is somewhat broader than that of Geitler (1930-1932). We suspect that the concept used here for Cyano- phyceae is in some cases too broad, but it has been devised for field observations in order to be able to assign every individual to a particular category.
Defining an individual for the Bangiophyceae was relatively easy, as all the species observed were multicellular, with cells at least 5 pm in diameter. Counting could thus be performed using a 40 × objective.
For Cyanophyceae the following conventions have been adopted for defining individuals: each filament is counted as one individual for filamentous Cyanophyceae, and each colony for the non-filamentous ones. Two colonies have been recorded as separate individuals as soon as they are separated by a distance equal tO two cell diameters. Counting was performed using a 100 × oil immersion objective of high quality, which is necessary given the small size of some Cyanophyceae.
R E S U L T S
Choice of sampling units on the basiphyte
Cladophora
T h e study of m i c r o s c o p i c epiphytes has to face the following two problems: (1) M o s t shoots of a basiphyte offer a surface t o o small to be representative of the total epiphyte p o p u l a t i o n in a stand of that basiphyte. T h e epiphytes m u s t therefore be c o u n t e d on several r a n d o m l y selected shoots from the b a s i p h y t e p o p u l a t i o n . T h e minimal sampling area is thus constituted by addition of several such shoots. (2) T h e density of the epiphytic cover is a function of the age of the shoot. Consequently, the samples will never be perfectly h o m o g e n e o u s .
C y a n o p h y c e a e a n d even m o r e so the B a n g i o p h y c e a e are fast g r o w i n g early colonizers of s h o o t apices. O n older parts, t h e y h o w e v e r have to c o m p e t e with larger algae, especially encrusting Corallinaceae. This relationship was evident in the milli- metre-by-millimetre c o u n t of B a n g i o p h y c e a e along the first centimetre of 20
C. prolifera
shoots (Stareso, 1-5 m, July 1981, Table I).F o r the B a n g i o p h y c e a e , the sampling unit on
Cladophora
has thus been defined as the u p p e r surface of the first 6 m m (starting from the apex) of an average s h o o t which is flattened u n d e r the cover-slip. Such an average s h o o t is a b o u t 200 p m wide at 3 m m from the apex, a n d the sampling unit is thus in the order of 1.2 m m 2.F o r C y a n o p h y c e a e , the situation is m o r e complex for if fhey already settle on the apex
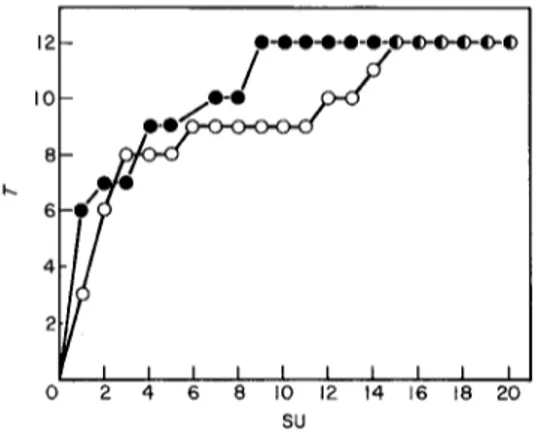
IO
9!,L 67
k 5 I 4 - 3 2 I o I 2 3 4 I i 5 6 7 8 9 I0 Distance olong shoot (mm)FIe. I. Number of "taxa" (T) of Cyanophyceae encountered millimetre-by-millimetre when the count- ings performed along the first centimetre (starting from
the apex) of 45 Cladophora prolifera shoots of average
size (200 Ixm at 3 m m from the apex) are pooled (Calvi, STARESO, depth 1.5 m, July 1981).
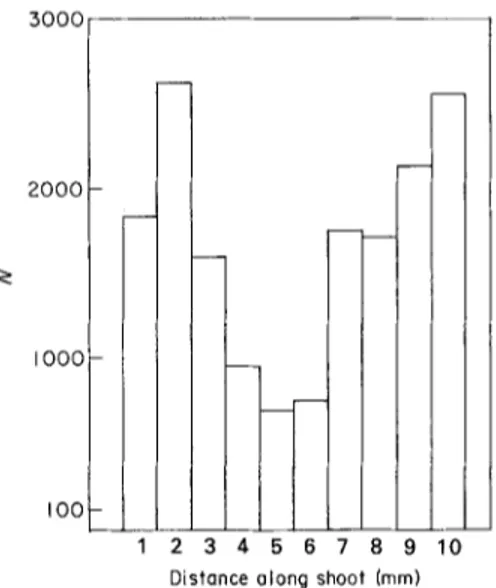
of growing shoots they remain present on the whole plant. Along a shoot, variations in their density do occur, apparently in relation to competition with Corallinaeeae and other larger epiphytes. Figures 1 and 2 show the number of taxa and of individuals that have been found millimetre-by-millimetre when the countings performed along the first centimetre of 45 average
C. prol!fera
shoots are pooled. The minimum near the fifth millimetre is in the zone of maximal development of encrusting Corallinaceae. Further down, more space is available among aging Corallinaceae and the blue-3000 2000 I o o o IOO!
I
I 10 r - - 2 3 4 5 6 7 8 9 Distance along shoot (mm)FIG. 2. Number of "individuals" (N) of Cyanophyceae encountered millimetre-by-millimetre when the count- ings performed along the first centimetre (starting from the apex) at 45 Cladophora prolifera shoots of average size (200 I~m at 3 m m from the apex) are pooled (Calvi, STARESO, depth i-5 m, July t981).
green algae thrive again. One should note their great abundance, the average number of individuals on 1 mm of shoot varying from 16 to 59.
Unlike the Bangiophyceae, therefore one cannot here select an area where the population is best developed. Thus we have arbitrarily chosen the first centimetre from the apex of the upper face of an average
TABLE I. Distribution of Bangiophyceae on a Cladophora prolifera shoot: number of individuals millimetre-by-
millimetre (cumulative count for 20 shoots of average size, that is 200 p.m wide at 3 m m from the apex) Distance from apex (mm)
Species 1 2 3 4 5 6 7 8 9
Total for each
10 taxon
Goniotrichum alsidii (Zanard,) 11 7 1 1 1 0 1 0 0 0 22 Howe
Goniotrichum cornu-cervi (Reinsch) 1 0 2 0 1 3 0 0 0 0 7 Hauck
Erythrotrichia carnea (Dillw.) J. 3 3 0 0 0 0 0 0 0 0 6 Ag,
Erythrocladia irregularis Rosenv. 5 4 3 0 0 1 1 0 0 0 14 form with bifid marginal cells
E. irregularis Rosenv. form with 3 5 9 4 1 5 1 0 1 0 29 non-bifid marginal cells
Chroodactylon ornatum (C. Ag.) 2 0 0 0 0 0 0 0 0 0 2 Basson
Total of Bangiophyceae 25 19 15 5 3 9 3 0 1 0 80
I I t I i I I I
2 4 6 8
SO
FIG. 3. Number of taxa of Bangiophyceae (T) in relation to the number of sampling units (SU) of
Cladophora prolifera (Calvi, STARESO, depth 1.5 m, July 1981).
shoot (200 gm thick at 3 mm from the apex, 250 gm at 5 mm, when flattened under the cover-slips), which is easier to observe than thicker parts. Furthermore all the species can be present from the fourth millimetre onward. In this way areas more-or-less covered by Cyanophyceae are included and this first centrimetre (area about 2.5 mm 2) might thus be representative of a large part of the total epiphytic cover.
M i n i m a l s a m p l i n g areas on
Cladophora
This study was performed with material from the STARESO harbour, July 1981. Another species/area curve for Cyano- phyceae was determined in a different place and a different season (Ferry harbour in March 1982).IOO
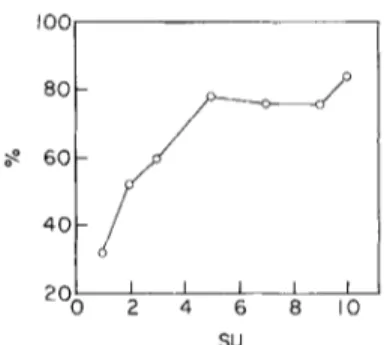
8O 6 0 4 0 2 0 [ I I I I 2 4 6 8 I O SUFIG. 4. Qualitative (Q) and quantitative (O) similarity coefficients in comparisons involving a growing number of added sampling units (SU), for Bangiophyceae on
Cladophora prol