Uncertainty of climate change impact on groundwater
resources considering various uncertainty sources
PASCAL GODERNIAUX
1,2, SERGE BROUYÈRE
1, PHILIPPE ORBAN
1,
SAMUEL WILDEMEERSCH
1& ALAIN DASSARGUES
11 Group of Hydrogeology and Environmental Geology – Aquapôle, University of Liège, Chemin des Chevreuils, 1, B52/3, B-4000 Liège, Belgium
2 Funds for Scientific Research - FNRS, Rue d’Egmont, 5, B-1000 Brussels, Belgium
Abstract Many studies have highlighted that climate change will have a negative impact on groundwater.
However, in previous studies, the estimation of uncertainty around projections was very limited. In this study, the impact of climate change on groundwater resources is estimated for the Geer basin using a surface–subsurface integrated model. The uncertainties around impact projections are evaluated from three different sources. The uncertainty linked to the climate model is assessed with six contrasted RCMs and two GCMs. The uncertainty linked to the natural variability of the weather is evaluated thanks to a weather generator which enables production of a large number of equiprobable climatic scenarios. The uncertainty linked to the calibration of the hydrological model is assessed by a coupling with UCODE_2005 and by performing a complete linear uncertainty analysis on predictions. A linear analysis is approximate for this nonlinear system, but provides some measure of uncertainty for this computationally demanding model. Results for this study show that the uncertainty linked to the hydrological model is the most important.
Key words groundwater; climate change; uncertainty; stochastic scenarios; calibration; UCODE; integrated modelling; HydroGeoSphere; Geer basin, Belgium
1 INTRODUCTION
Groundwater represents an important percentage of total water supply across the world. According to an assessment report of the United Nations Environment Program about groundwater (UNEP – Morris et al., 2003), it is likely that as many as two billion people depend directly upon aquifers for water supply. Several modelling studies have shown that climate change will bring new pressure on surface and groundwater resources (e.g. Allen et al., 2004; Goderniaux et al., 2009; Van Roosmalen et al., 2009) in many parts of the world. However, the uncertainty related to climate change impact is usually not evaluated or from a very limited number of possible sources. In particular, the uncertainty linked to the calibration of hydrogeological models is not taken into account. The evaluation of this uncertainty is however of major importance to give some credibility to the climate change impact study. It also enables water managers to analyse risks and take decisions with full knowledge of projected impact and their degree of confidence.
Considering this context, the objective of this study is to use a surface-subsurface integrated model to evaluate and compare the uncertainty affecting projected impact under climate change conditions, regarding the following uncertainty sources: (1) the uncertainty linked to the calibration of the hydrological model, using UCODE_2005 (Poeter et al., 2005); (2) the uncertainty linked to the global and regional climatic models (GCMs and RCMs), by using a multi-model ensemble; and (3) the uncertainty linked to the natural variability of the weather, by using stochastic climate change scenarios. These objectives are applied for the Geer basin in Belgium.
2 THE GEER BASIN CONTEXT AND MODEL
2.1 Context
The Geer basin (Belgium, 465 km2) (Fig. 1) is very strategic for the supply of drinking water to the city of Liège and suburbs. Groundwater abstraction represents 30 million m3/year to supply approximately 600 000 people. The main aquifer in the basin corresponds to a series of thick chalk layers, whose total thicknesses range from a few metres to 70 m (Brouyère, 2001). This chalky
aquifer is limited at its base by impermeable clays layers and at the top by a thick layer (up to 20 m) of loess that controls the water infiltration rate from the land surface to the chalky aquifer. The aquifer is mainly drained by the Geer River. The chalk’s porous matrix enables the storage of large quantities of water, while fast preferential flow occurs through fractures. The chalky aquifer is exploited primarily through a network of pumping galleries.
2.2 Numerical model
The Geer basin has been modelled with the finite element code HydroGeoSphere (Therrien et al., 2005), which fully integrates 3-D variably saturated groundwater flow and 2-D overland flow. HydroGeoSphere solves the Richards equation to simulate variably-saturated groundwater flows, and the diffusion-wave approximation of the Saint Venant equation to simulate overland flows. The actual evapotranspiration is calculated internally using the model of Kristensen & Jensen (1975) as a function of the potential evapotranspiration, the soil moisture in the surface and subsurface domains, the leaf area index (LAI) and other parameters linked to soil properties.
Fig. 1 The Geer basin in Belgium.
The Geer basin is discretized using 11 layers of triangular prismatic elements, with the first layers below the ground surface having a thickness of one metre. The lateral dimension of each element is approximately 500 m. In the subsurface domain, a third type boundary condition is specified to the North boundary to simulate water losses towards the adjacent basin. In the surface domain, a “critical depth” boundary condition is specified at the outlet of the catchment. Specified fluxes (rainfall, potential evapotranspiration and groundwater abstraction) are applied as daily inputs. More details about the implementation and the calibration of the model are available in Goderniaux (2010) and Goderniaux et al. (2009).
The model has been calibrated to observed hydraulic heads at eight observation wells and surface flow rates at the outlet of the basin (Fig. 1) during the period 1967–2003. At the same time as the calibration procedure, a sensitivity analysis for all parameters used in the model was performed. This sensitivity analysis is very important as it enables the identification of which parameters are sensitive to the variables of interest. It has been performed by coupling “HydroGeoSphere” with “UCODE_2005” (Poeter et al., 2005; Hill & Tiedeman, 2007). UCODE_2005 is used to perturb each parameter one by one, and to run one HydroGeoSphere simulation for each perturbed parameter. The calculation of the “Composite Scaled Sensitivities” (CSS), which aggregate the sensitivities of all selected variables relatively to one parameter (Hill & Tiedeman, 2007), shows that the most sensitive parameters of the Geer basin model are the hydraulic conductivity in dry valleys where fracturation is more important, the field capacity used to calculate the actual
evapotranspiration, some hydraulic conductivity values in the upper chalk layer and the total porosity of the chalk. The sensitivity of the Van Genuchten parameters have not been calculated with UCODE_2005 because unsaturated functions are directly specified using tables of values (Pressure– Relative hydraulic conductivity–Saturation). However, the experience gained during the calibration of the model showed that these parameters also present a significant sensitivity.
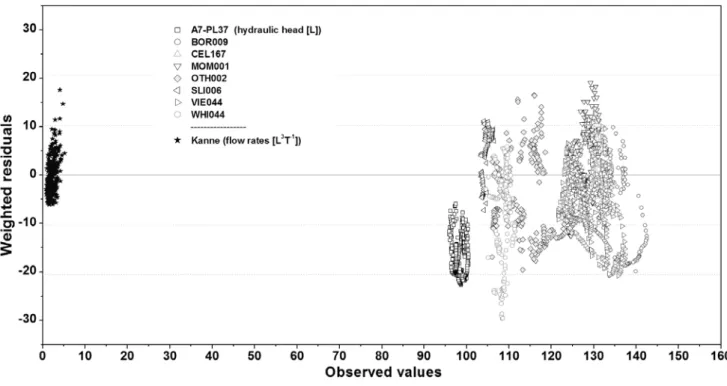
Figure 2 shows the weighted residuals as a function of the observed values from the eight observation wells and the flow rates at the outlet of the catchment. Residuals are weighted using the inverse of the true measurement errors variance. This weighting scheme offers, among others, the possibility to perform further sensitivity and uncertainty analyses on the predictions (Hill & Tiedeman, 2007). Simulated heads and flow rates satisfactorily reproduce the multi-annual variations in observed data, which is important is the context of long term climate change impact on groundwater reserves. However, the model is not perfect, as shown in Fig. 2. Seasonal variations in groundwater levels are too high at some observation wells. In the surface domain, simulated flow rates match well to observed values in summer for low flow rates and recession periods. Differences remain for the winter, where simulated flow rates are too high compared with observed flow rates. These differences are due to the difficulty of the model in simulating some high discharge peaks during winter months when runoff is higher compared to summer months. Although these types of model errors are common with hydrological model, they may have some implications on the accuracy of the predictions made with a calibrated model and need to be evaluated.
Fig. 2 Graphical analysis of the model calibration. Weighted residuals vs observed values.
3 CLIMATE CHANGE PROJECTIONS AND UNCERTAINTY EVALUATION
As a next step, climate change scenarios are applied as input of the model and projected impacts and uncertainties are assessed. In this study, climate change scenarios are downscaled from 6 Regional Climate Models (GCMs) using a Weather Generator.
3.1 Uncertainty from climatic models
This source of uncertainty is the only one considered in most existing studies about groundwater and climate change. Here, climate change scenarios are downscaled from six Regional Climate
Models (RCMs) with boundary conditions derived from two Global Climate Models (GCMs) (PRUDENCE Project – Christensen et al., 2007). These large scale climatic models correspond to greenhouse gases emissions that are medium-high (emission scenarios A2). The use of this multi-model ensemble (6 RCMs) enables the uncertainty linked to the choice of the RCMs and GCMs to be addressed. This number is limited, but has been maximised by the choice of the most contrasted climatic models. For the Geer basin, RCMs project a general increase in temperature throughout the year, with an annual increase ranging from +3.5°C (HIRHAM_H) to +5.6°C (RCAO_E). Precipitation is expected to increase in winter and decrease in summer, with an annual decrease ranging from –1.9% to 15.3%.
3.2 Uncertainty linked to the natural variability of the weather
RCMs suffer from various drawbacks. They are computationally expensive, simulations are usually limited in simulated time, and results are strongly dependent on the driving boundary conditions selected from GCMs. For local hydrological studies, further statistical downscaling is thus generally required. In this study, RCMs have been downscaled using a Weather Generator (RainSim + CRU Weather Generator) which also enables the generation of large numbers of stochastic climate change scenarios representing the natural variability of the weather. 100 equiprobable scenarios representative of transient conditions from 2010 to 2085 have been generated for each of the 6 RCMs and applied as input of the hydrological model. By the end of the century, results show that groundwater levels are expected to decrease by 2–19 m depending on the location in the Geer basin and the climatic model. The whole set of projected groundwater levels and flow rates (Fig. 3) has then been used to calculate 95% confidence interval around predictions for each time between 2010 and 2085. The range of groundwater levels confidence intervals varies between 2.3 m and 18.6 m depending on the observation point and the climatic model. The range of the confidence intervals tends to decrease as the importance of the partially saturated zone becomes higher and smoothes the climatic variations.
Fig. 3 95% Evolution of groundwater levels at OTH002 for equiprobable climatic scenarios of
ARPEGE_H (2010-2085). The mean displays the seasonal effects in the precipitation realizations.
3.3 Uncertainty linked to the calibration of the hydrological model
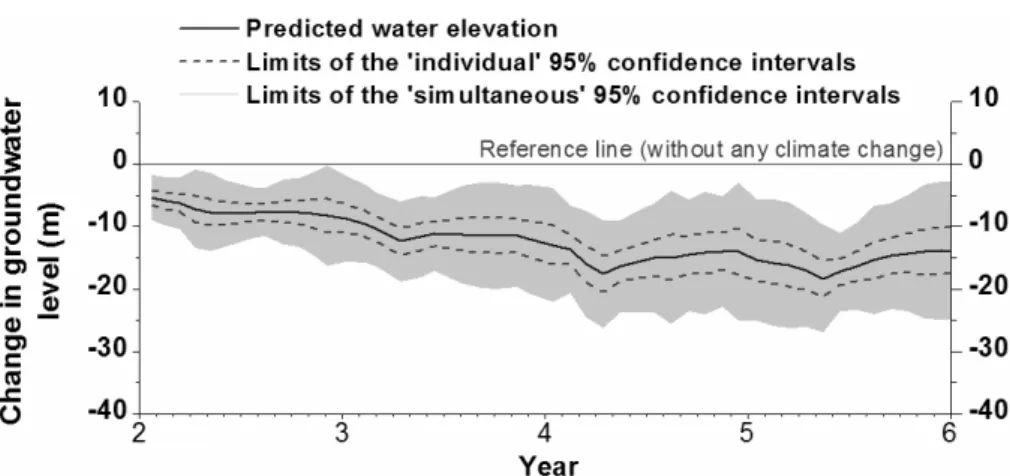
The ability of hydrological models to reproduce the reality is determined by the calibration. Errors made by the models may translate into projections and need to be evaluated carefully. Here, the capabilities of the computer code UCODE_2005 have been used to evaluate the uncertainty around climate change impact predictions on groundwater reserves in the Geer basin. The method is mainly based on the calculation of parameters sensitivities and the variance–covariance matrix. It is explained in detail by Hill & Tiedeman (2007). In this study, the predictions uncertainty has been evaluated for climate change corresponding to the climatic model HIRHAM_H (period 2071–2100), which presents medium climate change compared to the other RCMs. Predicted values and 95% confidence intervals have been calculated for a period of 6 years of stationary climate and are presented in Fig. 4 for the observation point OTH002. In this graph, they are expressed as the change in groundwater level, compared to a situation without any climate change (horizontal line). Individual 95% confidence intervals have a 95% probability of including the true
predicted value considering a unique prediction. Simultaneous 95% confidence intervals have the same given probability of including the true predicted value simultaneously for all predictions (Hill & Tiedeman, 2007). Generally, the mean range of the simultaneous 95% intervals varies between 6.9 m at the observation point A7-PL37 and 28.9 m at MOM001. Concerning surface water flow rates, the mean simultaneous and individual 95% intervals are equal to 3.9 m3/s and 1.4 m3/s, respectively. The flow rate intervals are larger for winter than for summer, due to better model calibration for low flow rate values.
Fig. 4 95% confidence intervals around predicted values at OTH002.
These intervals are linear confidence intervals, evaluated given the calibrated parameters values and considering that all sensitivities are constant. These sensitivities can vary with nonlinear models, which is the case with the surface–subsurface model used in this study. If nonlinearity is severe, for example when conditions become very dry, the linear confidence intervals can become inaccurate. An additional source of inaccuracy relates to the fact that the Van Genuchten parameters are not included in the analysis, due to some technical difficulties. Though the Van Genuchten parameters are not adjusted during the calibration stage and specified on the basis of laboratory experiments (Brouyère, 2006), a limited uncertainty remains for these parameters. Neglecting it in the evaluation of the uncertainty of the predictions could induce an underestimation of the confidence intervals. Nevertheless, though inaccurate in some cases, the linear confidence intervals are a good indicator of the predictions uncertainty. They are particularly useful when compared with uncertainty of other types, such as uncertainties linked to RCMs or natural variability of the weather.
4 COMPARISONS OF UNCERTAINTIES
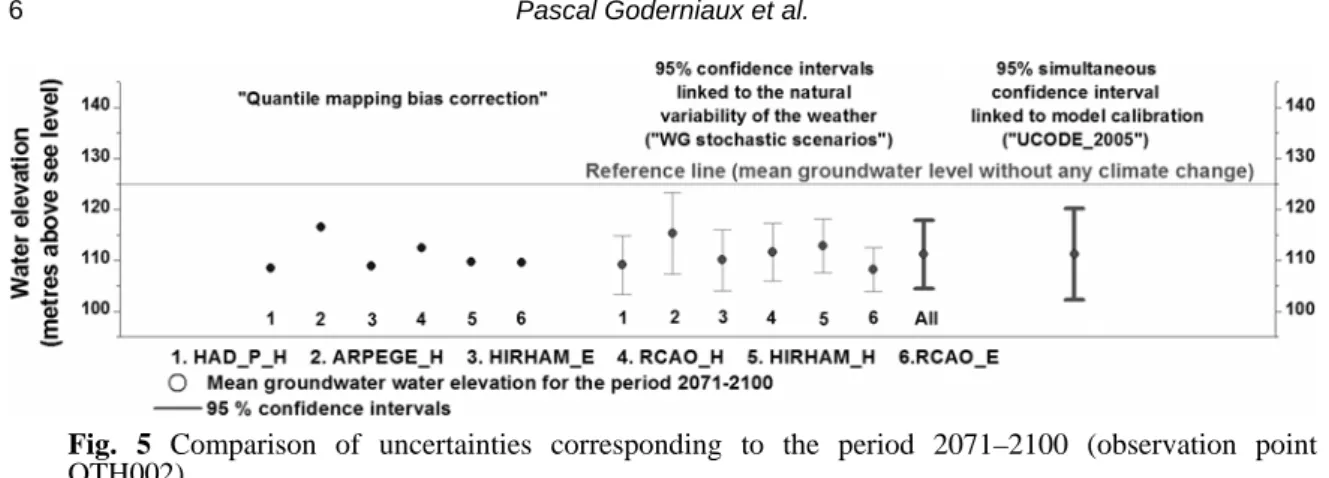
Several tools have been used to assess the uncertainty surrounding the climate change impact projections for the groundwater reserves of the Geer basin. These results are summarised and compared in Fig. 5 for the observation point OTH002 and the period 2071–2100. On this graph, results are also shown for the projected groundwater levels calculated with climate change scenarios downscaled with an alternative “Quantile mapping bias correction” method (Wood et al., 2004). As the stochastic WG, this method is among the most sophisticated, although it does not enable the production of stochastic scenarios.
Following these results, it is possible to rank the different sources of uncertainty from the most to the least significant. The uncertainties linked to the calibration of the hydrological model and the natural variability of the climate appears to be the most important in this case. The uncertainty linked to the use of different general and regional climatic models (GCMs and RCMs) comes in third position, followed by the uncertainty linked to the use of two different downscaling methods.
Fig. 5 Comparison of uncertainties corresponding to the period 2071–2100 (observation point
OTH002).
5 CONCLUSIONS AND PERSPECTIVES
Considering the results achieved in this study, it is very likely that groundwater levels will significantly decrease by the end of the century. However, it was also shown that the uncertainty surrounding projected groundwater levels in the Geer basin remains relatively large. Consequently, it remains difficult to state on the intensity of the decrease with high confidence. The main uncertainty is linked to the natural variability of the climate and the calibration of the hydrological model. While the first expresses how groundwater levels will vary around a mean position, the second relates to modelling “approximations” and could be reduced by improving the model calibration, if needed.
The results presented here are specific to this study and could hardly be transposed to another case study without a detailed analysis. Nevertheless, it constitutes a guide in the arduous and difficult task of uncertainty evaluation. In particular, it shows the importance and the usefulness of evaluating the uncertainty linked to the calibration of the model. Finally, other sources of uncertainty could be studied in more detail. Also, all climatic scenarios used here correspond to the A2 greenhouse gases emissions (medium–high), and other emission scenarios could be tested.
Acknowledgements This work was supported by the European Union FP6 Integrated Project
AquaTerra (Project no. 505428) under the thematic priority Sustainable Development, Global Change and Ecosystems. RCM data have been provided through the PRUDENCE data archive. Thank you to the Water Resource Systems Research Laboratory of Newcastle University for their very important help about climate change scenarios.
REFERENCES
Allen, D. M., Mackie, D. C. & Wei, M. (2004) Groundwater and climate change: a sensitivity analysis for the Grand Forks aquifer, southern British Columbia, Canada. Hydrogeol. J. 12(3), 270–290.
Brouyère, S. (2001) Etude et modélisation du transport et du piégeage des solutés en milieu souterrain variablement saturé (Study and modelling of transport and retardation of solutes in variably saturated media). PhD Thesis, University of Liège, Liège, Belgium.
Brouyère, S. (2006) Modelling the migration of contaminants through variably saturated dual-porosity, dual-permeability chalk.
J. Contaminant Hydrol. 82, 195–219.
Christensen, J. H., Carter, T. R., Rummukainen, M. & Amanatidis, G. (2007) Evaluating the performance and utility of regional climate models: the PRUDENCE project. Climatic Change 81(Supplement 1): 1-6.
Goderniaux, P. (2010) Impact of Climate Change on Groundwater Reserves. PhD Thesis, University of Liège, Faculty of Applied Sciences, Liège, Belgium.
Goderniaux, P., Brouyère, S., Fowler, H. J., Blenkinsop, S., Therrien, R., Orban, P. & Dassargues, A. (2009) Large scale surface–subsurface hydrological model to assess climate change impacts on groundwater reserves. J. Hydrol. 373(1–2), 122–138.
Hill, M. C. & Tiedeman, C. R. (2007) Effective Groundwater Model Calibration. With Analysis of Data, Sensitivities,
Predictions and Uncertainty. John Wiley & Sons, New Jersey, USA.
Morris, B. L., Lawrence, A. R. L., Chilton, P. J. C., Adams, B., Calow, R. C. & Klinck, B. A. (2003) Groundwater and its Susceptibility to Degradation: A Global Assessment of the Problem and Options for Management. Early Warning and
Assessment Report Series, RS. 03-3. United Nations Environment Programme, Nairobi, Kenya.
Poeter, E. P., Hill, M. C., Banta, E. R., Mehl, S. & Christensen, S. (2005) UCODE_2005 and six other computer codes for universal sensitivity analysis, calibration, and uncertainty evaluation. US Geol. Survey Techniques and Methods 6-A11. Van Roosmalen, L., Sonnenborg, T. O. & Jensen, K. H. (2009) Impact of climate and land use change on the hydrology of a
large-scale agricultural catchment. Water Resour. Res. 45.
Wood, A. W., Leung, L. R., Sridhar, V. & Lettenmaier, D. P. (2004) Hydrologic implications of dynamical and statistical approaches to downscaling climate model outputs. Climatic Change 62(1), 189–216.