Assessing wind comfort in urban planning
Sigrid ReiterLocal Environment Management and Analysis (LEMA), University of Liège, Chemin des chevreuils 1 (Bât. B52), 4000 Liège, Belgium. E-mail : Sigrid.Reiter@ulg.ac.be
Abstract
There are increasing concerns regarding the quality of urban public spaces. Wind is one important environmental factor that influences pedestrians’ comfort and safety. In modern cities, there are more and more high constructions and complex forms which can involve significant problems of wind discomfort around these buildings. Today, architects and town planners need guidelines and simple design tools to take account of wind in their projects. This paper addresses the progress made towards computational fluid dynamics (CFD) simulations for assessing wind comfort in urban planning. We validated Fluent software for wind studies in urban environments by comparing our simulations results with wind tunnel tests. This validation shows that wind mean velocities around buildings can be simulated numerically with a very high degree of accuracy. Based on the results of a great number of CFD simulations, we developed a methodology and simple graphical tools to quantify critical wind speeds around buildings. This article should thus help in practice architects and town planners to design our built environment. Moreover, this paper shows how numerical modeling is now a high-performance tool to work out useful guidelines and simple design tools for urban planners.
1. Introduction
Throughout history, urban public space has always played a central role in the life of cities. However, modern cities have been strongly influenced by economic and technological values. This has generated a loss of significance of urban public spaces (Madanipour, 1999) and a loss of climate responsive design (Eliasson, 2000; Ryser and Halseth, 2008). In our increasingly urbanised society, the urban environment’s quality becomes one of the main targets of a sustainable development.
Pedestrians’ comfort assessment in urban spaces is a key factor for their usage by local population (Nikolopoulou et al, 2001). So, there are increasing concerns in the research field of pedestrians’ outdoor comfort (Nikolopoulou and Steemers, 2003; Nikolopoulou and Lykoudis, 2006; Stathopoulos et al, 2004; Tacken, 1989; Teller, 2003; Walton et al, 2007; Willemsen and Wisse, 2007; Yang et al, 2007). Local wind speeds and solar radiation are the only microclimatic parameters that depend widely on urban planning (site location, building forms, geometry and orientation of open spaces, etc). Thus, designers can play on the interaction between these climatic parameters and the urban morphology to promote pedestrians’ comfort in public spaces.Direct and diffuse solar radiation in urban public spaces has been widely studied. Urban planners can use different design tools, adapted to different phases of projects design, to assess qualitatively and quantitatively solar radiation in urban areas. But, wind is a microclimatic parameter generally neglected by urban planners. However, wind speed at pedestrian level is one of the most important environmental parameter determining user satisfaction in urban open spaces (Stathopoulos, 2006; Tacken, 1989; Walton et al, 2007).
This paper focuses on wind comfort in urban planning. The correlation between urban geometry and local wind flows is poorly documented, even in wind engineering literature (Willemsen and Wisse, 2007). Moreover, the few scientific researches that address this issue relate to technical specifications or technologies unusable by designers. Urban planners need simple guidelines and design tools to understand wind flows in urban environments.There is today a lack of simple tools to take account of wind flows in architectural and urban design.
Decision makers need also simple guidelines and tools about climate responsive design in order to incorporate them into the regulatory and structural framework of land-use development and urban projects. Knowledge diffusion is critical for adopting and implementing urban planning policies promoting climate responsive urban design (Dunn, 1997; Ryser and Halseth, 2008).
This paper addresses the progress made towards the computational evaluation of pedestrian level winds. It develops a methodology and simple graphical tools to quantify critical wind speeds around buildings, based on a great number of CFD (computational fluid dynamics) simulations carried out with Fluent software.
2. Wind simulation tools and comfort criteria
Wind tunnel tests give wind relevant results and stay a reference in wind engineering for new methods’ validity investigations. Limitation of wind tunnels is the time required for one test and the choice of a limited number of measurement points in the models. Computational fluid dynamics (CFD) simulations are being increasingly applied for modeling wind around
buildings (Capeluto et al, 2003; Chen, 2004). CFD modeling is a more cost-effective and time-saving design tool for wind engineering studies. Moreover, CFD simulations give a quantitative and qualitative wind flow representation of the whole volume simulated and not only in a few specific points related to the presence of measure instruments.
Wind studies of architectural and urban planning are rarely conducted because of the high technical and scientific skills that CFD simulations and wind tunnel tests require. Good knowledge in fluid mechanics are required to use CFD simulations correctly, choosing simulation volume dimensions, boundary conditions, grid resolution, turbulence model, etc. Moreover, we noted that these tools are never used during the first phase of design, although the decisions taken at this first stage (volumes, implantation) are very important for wind distribution around buildings. Wind assessments are often postponed until a quasi-final design variant is available. Then, only detail measures generally remain possible, the least effective type of remedial action. Rules of thumb and simple graphical tools are the only forms of wind environmental expertise that can be used at the first stage of design (Bottema, 1999).
Therefore, we propose a new alternative: the development of a methodology associated with simplified graphical tools, usable during the first phase of design, assessing critical areas of wind in urban environments. This paper will discuss the choice of wind comfort criteria, the validation of CFD simulations and the development of simple tools in order to improve the design of neighborhoods or towns plans in terms of wind shelter.
A comfort criterion is a combination of a discomfort limit and the maximum probability of discomfort that is acceptable. There are many criteria of comfort in the literature. Here are
some criteria widely used in the past (Gandemer, 1975; Isyumov and Davenport, 1975; Lawson and Penwarden, 1975; Murakami et al, 1986) and some review studies (Bottema, 2000; Koss, 2006). Some of them use the hourly mean wind speed as the relevant parameter to assess human wind comfort and other ones are based on gust wind speeds or effective wind speeds (integrating the wind speed standard deviation).
Altough it can be argued that pedestrians are affected by gust effects, measures of Bottema with a Laser Doppler show that variations of the wind speed standard deviation around an obstacle are much lower than changes in average wind speeds. Considering that local wind speed standard deviation around a building is equal to the standard deviation measured at the meteorological station, the relative error on the turbulence parameter is about 15% (Bottema, 2000). We can therefore use an approximation that simplifies our calculations, while giving sufficiently accurate results, by integrating this turbulence parameter in the wind mean speed threshold value of our wind criteria.
Moreover, the current practice of some famous European wind laboratories has been discussed by a European working group of the Cost Action C14 “Impact of Wind and Storm on City Life and Built Environment” (Koss, 2006). Comparing comfort criteria collected by the working group of the COST Action C14 to the criteria used before 1990, this study reveals a significant change occurred in the practice of wind criteria over the last decade. The majority of wind criteria is now based on a fixed hourly mean wind speed. For example, the Building Research Establishment-BRE (England), the FORCE Technology-DMI (Denmark), and the Netherlands Organization for Applied Science research- TNO (The Netherlands) are
currently using an hourly mean wind speed criteria to asses wind comfort around buildings (Koss, 2006).
In addition, many cities (Aynsley, 1989; Bosselman et al, 1988) and some national codes (Willemsen and Wisse, 2007) require average wind speeds as limits to be observed in public spaces after the construction of a new building. Thus, average wind speed is the parameter that CFD simulations have to predict accurately for developing our simplified graphical tools for urban designers and urban planners.
It is important to note that a comfort criterion and a safety criterion are two criteria that have to be chosen separately (Bottema, 2000). Presently several research groups are working on formulating standardized wind comfort and wind safety criteria based on an hourly mean wind speed (Koss, 2006). This will provide more uniform results in wind comfort assessment. In the meantime, our choice is focused on the criteria of the new code for the assessment of wind comfort and wind danger in the Netherlands NEN 8100 (Willemsen and Wisse, 2007).
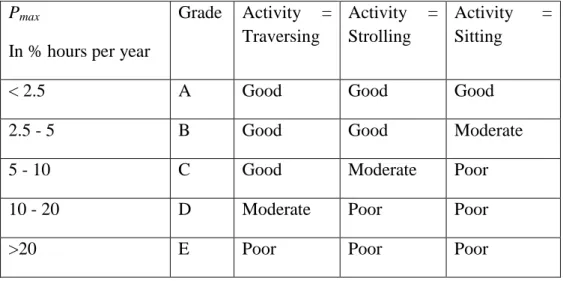
The Netherlands Normalisation Institue conducted a project in close cooperation with eight Dutch cities, three wind tunnel institutes and many other parties concerned, which resulted in the publication of NEN 8100. The probability that the pedestrian wind speed exceeds a threshold value of 5 m/s is a measure for wind comfort. Larger probability means less comfort. Therefore, five grades of wind comfort A-E are defined as function of this probability. In addition, for three different activities of the public (traversing, strolling and sitting) these grades of wind comfort are assessed in terms of a poor, moderate or good local
wind climate. The mean wind speed threshold is 15 m/s for danger by wind forces on pedestrians.
- For comfort: P (U > 5m/s) < Pmax, where P means probability, U is the average hourly wind
speed at 1.5 m above the ground and Pmax is given in the table 1.
Table 1: Values of Pmax acceptable for wind comfort (Willemsen and Wisse, 2007)
Pmax
In % hours per year
Grade Activity = Traversing Activity = Strolling Activity = Sitting
< 2.5 A Good Good Good
2.5 - 5 B Good Good Moderate
5 - 10 C Good Moderate Poor
10 - 20 D Moderate Poor Poor
>20 E Poor Poor Poor
- For safety: P (U > 15m/s) < Pmax,where P means probability, U is the average hourly wind speed at 1.5 m above the ground and Pmax is given in table 2.
Table 2: Values of Pmax acceptable for wind safety (Willemsen and Wisse, 2007) Pmax
In % hours per year
Danger for all activities
≤0.3 Limited risk
3. CFD simulations validation
We took the time to analyze the performance of CFD simulations compared to results of wind tunnel tests in order to assess their scientific validity. We carried out a validation of Fluent software as a tool for simulations of wind around buildings by comparing our simulated results with wind tunnel tests found in the literature for three different building contexts: a single building, the interaction between two buildings and a dense urban area.
This validation study of CFD simulations using the Fluent software focuses on three turbulence models: the standard k-
ε
model (Launder and Spalding, 1972), the Realizable k-ε
model (Shih et al, 1995) and the Reynolds stress model (Launder et al, 1975; Launder, 1989).Our simulations allow us to conclude that, for several configurations of isolated buildings and small groups of buildings, all turbulence models proposed in Fluent, converged to the second order, predict well qualitatively the areas of high wind speeds. But, with the standard k-
ε
and the k-ε
realizable models, the position of maximum discomfort is not simulated accurately compared to the wind tunnel measures. The realizable k-ε
model still improves quantitatively the discomfort estimation compared to the standard k-ε
model. The Reynolds-stress model (RSM) gives remarkable quantitative results to assess pedestrians wind comfort.For example, the configuration of figure 1 was selected because we can compare our simulations with the wind tunnel results that Wiren has published for the same built geometry (Wiren, 1975). These wind tunnel measurements accurately quantify the wind discomfort
effect generated at the centre of this passage at pedestrians level (2m high). The simulated configuration is a 80m long, 12m wide and 18m high building, drilled in its center by a passage (6m wide and 4m high) at the pedestrian level.
Fig. 1 : Simulation configuration for the validation of wind around a single building.
The ratio U/Uo is the ratio between the wind speed simulated at 2m high in this built configuration and the wind speed simulated at the same height without the presence of the building. The ratio U/Uo is representative of the acceleration or deceleration effect of the wind around the studied building. Figure 2 compares the ratio U/Uo in the middle of the passage predicted by our CFD simulations with Fluent software and the results of a wind tunnel test of Wiren (1975), at 2m high from the ground.
Fig. 2: comparison of the results simulated by various Fluent turbulence models and a wind tunnel test
The Reynolds Stress model (RSM), converged to the second order, does not only identify critical areas but also determines accurately the most critical position and the value of maximum wind discomfort. The RSM turbulence model should thus be used in all studies of wind comfort around buildings because it gives very good results for the distribution of mean wind speeds at pedestrians’ level.
If we compare all our simulations of wind flows around isolated buildings, the three turbulence models used, converged to the second order, provide a quantitative accuracy of the maximum wind speed evaluation of 15% compared to a wind tunnel test. It is largely sufficient to estimate the critical areas around a building. However, to determine the precise
position of the highest wind speed areas as well as to assess accurately pedestrians discomfort risks, some models are better suited. We recommend second order simulations with the Reynolds-stress (RSM) turbulence model.
Simulations results of wind around groups of buildings (Venturi effect, wind in passages between two buildings, …) lead to the same conclusions as the simulations around an isolated building. Fluent is thus validated both quantitatively and qualitatively for assessing high wind speeds around some buildings. The model RSM converged to the second order is an ideal turbulence model for the study of wind around small groups of buildings.
For isolated buildings and small groups of buildings, our CFD simulations showed that the RSM turbulence model converged to the second order gives accurate values of average overspeeds at pedestrian level with a relative error less than or equal to 15% between the value measured at a specific point in a wind tunnel test and the value predicted at the same point by our CFD simulations. This maximum relative error is reduced to a few percent (<5%) for the highest wind speed in the simulation field. The critical areas in relation to the wind are located very precisely through this type of simulations.
The second part of this validation of CFD simulations focused on wind quantification in a dense urban environment. The aim was to check Fluent assessments accuracy in such complex built context. We compared our simulations with wind tunnel tests of Stathopoulos and Wu (1995) within a horizontal plane at 2m high. These experiments were carried out with an urban wind profile, which was also used in our simulations. This validation shows that
wind mean velocities around buildings can be simulated numerically with a very high degree of accuracy.
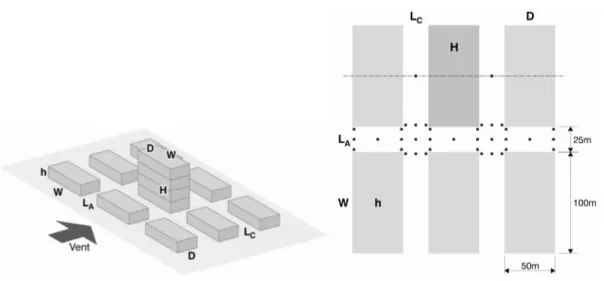
Figure 3 shows the configuration studied and the position of the various measurement points in the wind tunnel tests (Stathopoulos & Wu 1995). The central building was modeled according to two different heights: the same height as the whole urban fabric (19m) and a height equal to four times the height of surrounding buildings (76m). The streets have a width of 25m. Buildings have an upwind width of 100m and a depth (along the wind) of 50 m.
Fig. 3 : Simulated configuration for a dense urban context (left) and comparison points (right)
The relative error between measured values of the wind tunnel test and results of our Fluent simulations with the Reynolds-stress model remains below 20% for all areas studied. For high wind speeds and for the average wind speed over the whole urban area, this error is limited to
5%. RSM converged to the second order seems the ideal model for simulating wind in dense urban environments.
It should however be noted that errors of about 40% may appear locally, in specific points of the simulated field, especially where the wind speeds are very low. This study allows us to conclude that we must consider such simulations as a tool for predicting average wind speeds in sections of streets or urban areas but not for determining accurate wind speed at a specific point within urban areas.
Our conclusion is that mean wind speeds in dense urban areas can be successfully analyzed using CFD simulations if the best calculation parameters and a sufficiently fine meshing grid are used. Architects and town planners do not need to know exactly the wind speed in a specific point to design comfortable public spaces but they need to know the areas protected from wind, those who will be exposed to it and those that will create discomfort for pedestrians. From this viewpoint, CFD simulations are validated to assess wind discomfort risks in urban areas and to help designing comfortable public spaces.
This validation is not just about the higher wind speeds but also about mean wind speeds in protected urban areas, matters of interest to designers in the fields of pollutants dispersion and natural ventilation of buildings. CFD simulations are today good research tools for developing simplified design tools to support architectural and urban design in relation to the wind.
4. Development of a methodology for assessing wind comfort in urban planning
Based on a great number of CFD simulations carried out with Fluent software, we are proposing a methodology to incorporate wind comfort in urban planning, associated with simple design tools.
Dense urban environments with homogeneous buildings heights create a wind protection effect in these areas. Our simulations show that wind speeds in the peripheral zone of an urban environment are slowed over a distance of 200m in the direction of the wind and 50m in the direction perpendicular to the wind. Similarly, our simulations show that beyond a dense urban neighborhood of uniform buildings height, there is a big protection area of approximately 100 m long. The effect of urban mask has completely disappeared for surfaces that are 200 meters behind the buildings or even further. Streets parallel to the wind that lead to a wide open space are already losing the benefits of the urban mask effect over a distance equal to about 50m ahead of the open area. This zone of air acceleration is followed by a wind spray of 25m long in the open space. However, this zone is not really uncomfortable.
Thus, apart from the peripheral zone (200m wide), a dense urban fabric whose buildings have uniform heights provides a wind protection effect on all its public spaces unless it includes large open areas without wind barriers. The masking effect of the buildings is lost as soon as we find a space with a length of 200m and a width of 100m. In this case, the built-up area beyond this large open space will also be penetrated by wind to a depth of 200m.
So, we have to analyze first the urban context. A building or a public space is sheltered, when for all wind sectors the following conditions are satisfied:
• there is no building higher than 2h (where h is the average height of the obstacles) within a radius of 200m,
• within a radius of 200m, we can not find any surface that belongs to a large open zone free of dense obstacles (trees and/or buildings) equal to or exceeding 20 000 m².
Then, it is necessary to differentiate the study of wind comfort into different zones according to their protection.
1/ For sheltered buildings up to a height of 15 m, no further evaluation regarding wind comfort is necessary.
2/ For sheltered buildings with a height between 15m and 40m, our simple design tools can predict whether or not they induce a risk of wind discomfort at pedestrian level and thus whether or not a CFD or wind tunnel investigation is necessary.
3/ For unsheltered buildings up to a height of 40m, our simple design tools can predict the wind critical areas in terms of pedestrians’ wind comfort.
4/ For buildings higher than 40m (even sheltered), it is always necessary to analyze wind comfort with CFD simulations or wind tunnel tests to assess alternative geometries or additional protection measures. In these cases, our simple tools will help the designers to make a first rough assessment of wind discomfort risks. They offer the possibility to compare several alternatives to choose the most favorable.
This paper focuses on wind comfort at pedestrians’ level. However, note that a lack of ventilation can also be a problem in urban open spaces, if air pollution loads are high. To quantify wind comfort, we need to know the wind statistics at the nearest meteorological station and the adaptation ratio between wind speeds measured at the meteorological station and on the site to analyze. This transformation ratio depends on both the terrain roughness and the built context.
Consider the following wind speed parameters :
• U10,m is the average wind speed at a height of 10m, measured at the meteorological
station.
• Uo is the average wind speed, assessed at the pedestrian level, taking into account the
roughness of the site but not the built form.
• U is the average wind speed in the real site at the pedestrian level. U is therefore
influenced by the protection or acceleration effects of wind around buildings.
We can therefore assess the average wind speeds on a site by multiplying the mean wind speed at the meteorological station by two adaptation factors related to the roughness of the terrain and the built morphology, using the following formula:
U = U10,m (Uo/U10,m) (U/Uo)
Uo= K za U10,m ,where :
• U10,m is the average wind speed at a height of 10m, measured at the meteorological
station.
• Uo is the average wind speed, assessed at the pedestrian level, taking into account the roughness of the site but not the built form.
• z is the height of the wind speed evaluation on the site. In general, taking z= 1.5m is a
good choice for the pedestrian level.
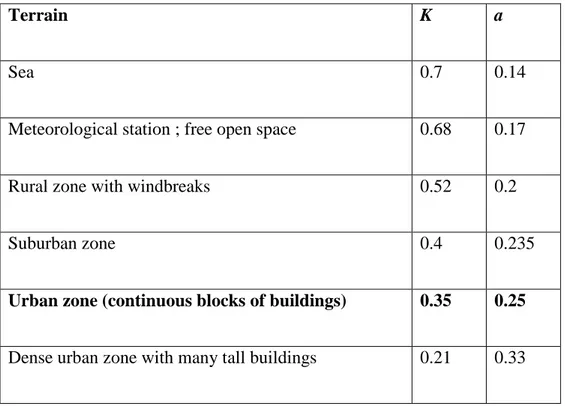
• K and a are parameters related to the terrain roughness. They can be selected on the
basis of Table 3.
Table 3: Terrain roughness parameters.
Terrain K a
Sea 0.7 0.14
Meteorological station ; free open space 0.68 0.17
Rural zone with windbreaks 0.52 0.2
Suburban zone 0.4 0.235
Urban zone (continuous blocks of buildings) 0.35 0.25
Dense urban zone with many tall buildings 0.21 0.33
At pedestrian level, in an urban environment, we find:
To quantify average wind speeds in urban spaces, we have thus to assess the ratio U/Uo which
characterizes the influence of urban geometry on local wind flows. That is why we have developed simplified graphical tools that can quickly assess the report U/Uo in different urban
morphologies. These tools are presented in the next section of this paper. The ratio U/Uo can
be assessed for a first approximation from the simple graphical tools proposed in this document or more accurately from CFD simulations or wind tunnel tests if the situation seems critical.
In a complex environment, it is often necessary to define a number of angular area (N, NNE,
NE,..) which have similar characteristics and determine the adaptation ratios (Uo/U10,m) and
(U/Uo) that are the most appropriate for each one of them. Then, the probabilities of wind
comfort can be calculated for each wind direction. For the comfort criterion that we have chosen, the calculation becomes:
P (U > 5m/s) = P (U10,m > 5/((Uo/U10,m) (U/Uo)) ) = C(θ).
It is therefore necessary to know the wind statistics at the nearest meteorological station.
Finally, the global percentage of wind discomfort on a site can be calculated by the following formula, simply adding the discomfort percentages calculated for each direction with a weighting based on their wind occurrence probability.
Σ [(C(θ)* k(θ)] / 100 [en %]
θ is a wind direction,
C(θ) = P (U > 5m/s) = P (U10,m>5/((Uo/U10,m) (U/Uo))) for wind direction θ,
k(θ) is the wind occurrence probability for wind direction θ at the nearest meteorological station.
Table 4 gives the wind occurrence probability for each wind direction at the meteorological station of Uccle (Brussels).
Table 4: Wind occurrence probability (%) at Uccle (Brussels)
Wind direction Angular area k (θ) (%)
NNE 15-44 3,5 NEE 45-74 8,7 E 75-104 2,4 EES 105-134 2,1 ESS 135-164 7,5 S 165-194 8,5 SSW 195-224 14 SWW 225-254 28 W 255-284 8,7 WWN 285-314 4,2 WNN 315-344 7,7 N 345- 14 4,7
The global percentage of wind discomfort calculated can then be compared to the comfort limit chosen to judge whether the comfort level is sufficient in terms of planned activities.
5. Development of simple graphical tools
Thanks to Gandemer’s (1975) previous research conducted within a wind tunnel, we knew already the most common types of critical wind flows around buildings. However, in Gandemer’s studies and other previous studies conducted within wind tunnels, the quantitative assessment was very simplified. Our research is complementary to these previous works by creating tools based on parametric studies quantifying effects of buildings dimensions on each one of these critical wind effects defined by our predecessors and integrating them in a whole wind strategy for urban planning.
These graphical tools were developed from numerical simulations using an urban wind profile. They were developed to assess mean wind speeds at pedestrian level, without taking into account the relief and vegetation effects of some urban situations. The influence of vegetation density on mean wind speeds around buildings has been studied by Heisler (1989) from experimental results.
Tools that we currently have developed with our Fluent simulations quantify various wind effects:
• for a simple isolated building or an urban building located next to a large open space : the corner effect, the passage effect, the front vortex, the wake effect and the bar effect.
• for wind flows around little groups of buildings (isolated or located next to a large open space) : the double corner effect, the Venturi effect and the mesh effect.
• for wind flows in dense urban areas : the urban mask effect and the high-rise building effect in a dense urban environment.
These simplified quantitative tools should be considered as a first approach to a very complex phenomenon. Their results give only exact values for the conditions taken as assumptions in our simulations. However, quantitative orders of magnitude predicted by these tools are correct and very useful to be aware of risks that may arise in a specific layout or to compare the influence of several configurations for the same project during the first phase of design.
If these tools predict important discomfort risks, it is necessary to change the urban project. For more accurate assessment of wind speed in complex urban areas, it is still useful in a second time to specify solutions through CFD simulations or wind tunnel tests.
We are presenting below, as examples, some tools to assess different wind effects :
- the corner effect around an unsheltered building,
- the front vortex around an unsheltered building,
- the double corner effect between two buildings,
- the mesh effect,
- the corner effect around a high-rise building located in a dense urban zone.
The corner effect is the acceleration of the wind at the corners of the building facade exposed to the wind. This effect is well illustrated by figure 4. The picture was taken at the foot of a tower located at Porte de Namur in Brussels. In passing the corner, pedestrians often have to stoop to resist to the wind effect.
Fig.4 : The corner effect.
First, simulations were carried out varying the building height H for a constant building length and a constant building width. The graph below (fig. 5) shows the maximal ratio U/Uo found at the corner of the building for various buildings heights. This graph shows that wind discomfort levels at the corner of a building are growing rapidly with its height.
Fig.5: Ratio between the average simulated and reference mean wind speeds (U/Uo) at pedestrian level in the front corner zone
Some graphs were elaborated for different lengths of buildings. The corner effect is nearly independent of the building length. Table 5 shows the small increase in discomfort for buildings of great length at their front corner. This very small influence of the building length means that it can be ignored in evaluating the corner effect during the first stage of a project. Indeed, doubling the height of a building increases much more the wind discomfort levels near the ground than quadrupling its length…
Table 5: Influence of buildings length on the corner effect
Length of the building 0 à 50m 50 à 100m 100 à 150m 150 à 200m 200 à 250m
The most critical wind direction for the corner effect is a 45 degrees incidence from the normal to the facade exposed to the wind. A wind orientation perpendicular to the main facade is however representative of the average wind critical effects at the corner of a tall building for variable wind flows. The maximal ratio U/Uo for each wind direction evolves around the reference value for this building height between a range of -2% to +13%.
The building height is the key parameter influencing the corner effect around a single building. More the building height is high, more critical are the wind discomfort zones. To limit the corner effect, it is advisable to reduce the height of the building zones along the public spaces, especially around corners, through setbacks, bleachers, bases, ...
5.2 The front vortex around an unsheltered building
This effect is a vortex of air recirculation in front of the building, as illustrated in figure 6.
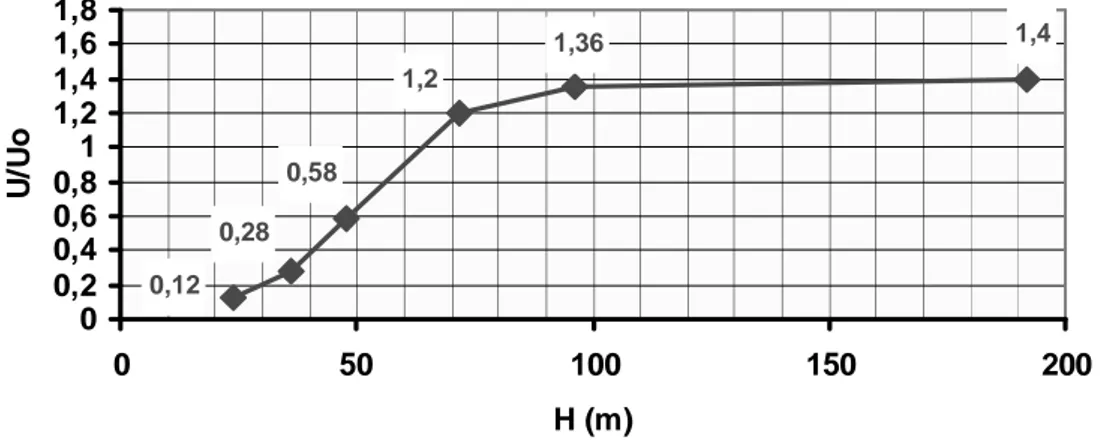
Figure 7 gives the maximum ratio U/Uo due to the front vortex at the foot of a high isolated building, according to its height.
1,36 1,2 0,12 0,28 0,58 1,4 0 0,2 0,4 0,6 0,8 1 1,2 1,4 1,6 1,8 0 50 100 150 200 H (m) U /U o
Fig. 7: Ratio U/Uo at pedestrian level due to the front vortex.
This wind effect is uncomfortable for buildings whose height is greater than 60m. However, for buildings whose height is less than 50m, there is a protection zone upwind of the building. And for a building height exceeding 100m, the front vortex seems completely deployed.
For a mid-rise building exposed to the wind, it is thus interesting to design building entrance at the center of the façade, far from the corner effect that is critical even for buildings of low heights.
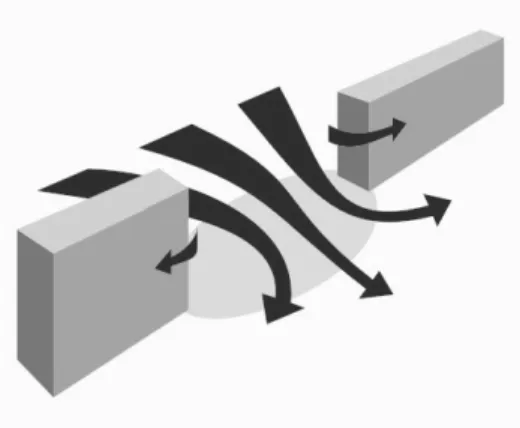
5.3 The double corner effect between two unsheltered buildings
The double corner effect is created by a passageway between two buildings, as illustrated in figure 8.
Fig. 8: The double corner effect.
Figure 9 quantifies the double corner effect according to various buildings heights and a passage width measuring 8m. Wind direction is parallel to the passage axis.
2,74 1,96 2 2,06 0 0,5 1 1,5 2 2,5 3 0 20 40 60 80 100 H (m) U /U o
Fig 9: Ratio U/Uo at pedestrian level due to the double corner effect : influence of buildings height.
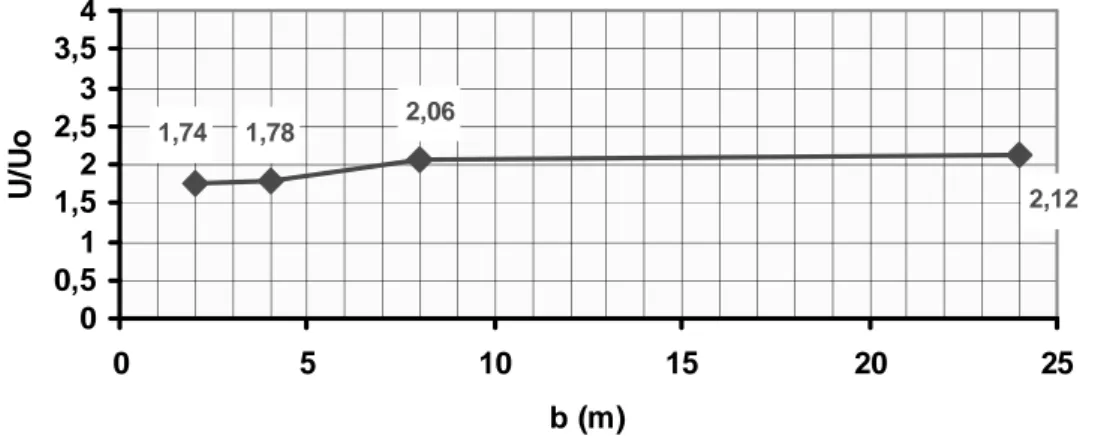
Figure 10 allows us to compare the double corner effect according to various passage widths for a building height of 50m. This graph shows clearly that the double corner effect does not exist if the width between the buildings is less than 6m because the wind speeds measured in the passage are in this case lower than those generated by a conventional corner effect. Indeed, the ratio U/Uo at the corner of one similar isolated building is 1,94. But, once the
double corner effect is generated, the width of the passage between the buildings has little influence on the wind discomfort levels.
1,74 1,78 2,06 2,12 0 0,5 1 1,5 2 2,5 3 3,5 4 0 5 10 15 20 25 b (m) U /U o
Fig 10: Ratio U/Uo at pedestrian level due to the double corner effect : influence of passage width.
Porous obstacles (trees, permeable screens) placed in a passage between buildings can reduce the discomfort risk. A building located in front of the entrance of this passage between buildings can also limit the double corner effect.
5.4 The mesh effect
A built mesh generates a closed area protected from the wind, as illustrated in figure 11. This is obviously the situation of a lot of city blocks in European cities.
Fig. 11 : The mesh effect.
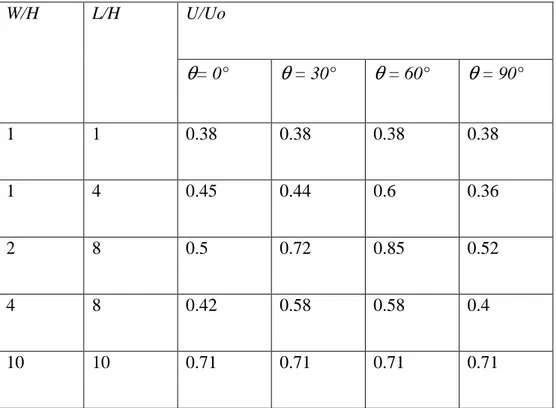
The table 6 quantifies the mean ratio U/Uo in a built mesh whose length is L and whose width is W, for different mesh geometries (W/H, L/H) and four wind directions (
θ
)
.Table 6 : Quantification of the mesh effect
W/H L/H U/Uo
θ
= 0°θ
= 30°θ
= 60°θ
= 90° 1 1 0.38 0.38 0.38 0.38 1 4 0.45 0.44 0.6 0.36 2 8 0.5 0.72 0.85 0.52 4 8 0.42 0.58 0.58 0.4 10 10 0.71 0.71 0.71 0.71Whatever the proportions of the mesh (for an upwind length and depth of the mesh ranging between one and ten times the height of the buildings: S/h² ≤ 100) and whatever the direction of the wind, the interior of a closed buildings mesh offers wind protection. Finally, note that a larger mesh (S/h² ≤ 300) can produce a wind protective effect if it is integrated into an urban environment of similar height.
5.5 The corner effect around a high-rise building located in a dense urban zone
Tall buildings are buildings whose height is at least double the average height of the surrounding buildings. Thanks to our simulations conducted on different types of urban environments, we can say that, in the case of a high building surrounded by smaller buildings (fig. 12), the average wind speed at pedestrian level depends essentially on the ratio between the height of the higher building and the average height of the surrounding buildings: H/h. When H/h increases, the ratio U/Uo is also increasing. The presence of a high building modifies completely the air flows in the surrounding streets. The critical zone covers a circle whose radius is the height of the tall building.
Figure 13 shows the maximum ratio U/Uo simulated at the corner of a high building (height=H) located in a dense urban zone with small buildings (h = 12m).
Fig 13: Ratio U/Uo at the corner of a high-rise building in a dense urban environment of 12m high buildings.
In the case of a high building in a dense urban environment, the ratio U/Uo should first be quantified with the hypothesis of an unsheltered building (isolated or surrounded by a large open space (shown in figure 5) and then multiplied with a decreasing factor due to the effect of the urban mask (shown in table 7), if this high building is sheltered.
Table 7: Decreasing factor of the ratio U/Uo according to the ratio H/h for the corner effect of a high building located in a dense urban environment by comparison to a high isolated building.
Ratio H/h between the height H of the tall building and the height h of the surrounding buildings
Decreasing factor (%) due to the urban mask effect reducing wind critical effects in urban zones. H/h=2 55% H/h=3 85% H/h=4 90% H/h=6 93% H/h=8 97% H/h=16 98%
For tall buildings, the best solution in terms of wind protection is always decreasing their heights. High-rise buildings and pedestrians’ comfort around buildings are difficult to harmonize. It is essential to avoid high-rise buildings nearby relaxation places, squares, playgrounds, ... Correction devices (windbreaks, ...) are always less effective than an appropriate design of the building (shape and size). Moreover, most of these correction devices (windbreaks, …) improve wind protection at a specific location to generate unpleasant wind flows in other zones.
6. Conclusion
Local wind speeds and solar radiation are the most important microclimatic parameters for urban design and urban planning because they depend widely on the urban geometry. Direct and diffuse solar radiation in urban spaces have been widely studied. But, there is a lack of simple tools to take account of wind flows in architectural and urban design. This paper resumes a validation study of CFD simulations to predict mean wind speeds at pedestrian level in urban environments and explains the development of a methodology and simple graphical tools, based on CFD simulations results, to help architects and urban designers to quantify critical wind speeds around buildings.
This research is based on a great number of CFD simulations carried out with Fluent software. Our simulations results show that CFD simulations are good tools for evaluating critical effects of wind around buildings from the viewpoint of pedestrians comfort. The RSM (Reynolds-stress model) converged to the second order is especially well suited to study wind comfort around buildings. The Reynolds-stress model of Fluent software has been validated qualitatively and quantitatively for assessing mean wind speeds around single buildings, around small groups of buildings, in a dense urban area with uniformly low buildings and in a dense urban area including a high building.
Moreover, this fluent validation is not just about the higher wind speeds but also about mean wind speeds in protected urban areas, matters of interest to designers in the fields of pollutants dispersion and natural ventilation of buildings. CFD simulations are today good research tools
for developing more simplified design tools to support architectural and urban design in relation to the wind.
Based on the results of our simulations of several urban morphologies, we developed graphical tools to quantify the following wind effects around buildings : the corner effect, the front vortex, the wake effect, the bar effect, the passage effect, the double corner effect, the Venturi effect, the mesh effect, the urban mask effect and the high-rise building effect in a dense urban environment.
These simplified graphical tools can assess at an early stage of design project the critical wind speeds in urban environments. Associated with the chosen wind comfort/safety criteria and with probabilities of wind velocities at the nearest meteorological station, these tools give wind comfort probabilities in urban environments. This article should thus help in practice architects and town planners to design our built environment. Moreover, it would be easy to use these tools systematically through 3D GIS as a simple screening method for wind comfort at the urban scale.
In the future, other types of simplified graphics will be developed, such as representations of spatial average wind speeds in different urban morphologies, useful for assessing buildings natural ventilation potential or pollutants dispersion in urban areas. Wind engineering is in the process of growing from a field of specialized analysis of complex situations to a field of environmental design studies for urban projects.
7. Acknowledgements
The project has been funded by the Belgian Science Policy and the Brussels-Capital Region.
8. References
Aynsley R M, 1989, “Politics of pedestrian level urban wind control” Building and
Environment 24 (4) 291-295.
Bosselmann P, Dake K, Fountain L, Kraus L, Harris L, Harris A, 1988, Sun, Wind and
Comfort: Study of Thermal Comfort in San Francisco (Centre for Environmental Design
Research, University of California, Berkeley).
Bottema M, 1999, “Towards rules of thumb for wind comfort and air quality” Atmospheric
Environment 33 4009-4017.
Bottema M, 2000, “A method for optimisation of wind discomfort criteria” Building and
Environment 35 1-18.
Capeluto, I.G., Yezioro, A., Shaviv, E., 2003, “Climatic aspects in urban design – a case study” Building and Environment 38 827-835.
Chen, Q., 2004, “Using computational tools to factor wind into architectural environment design” Energy and Buildings 36 (12) 1197-1209.
Dunn W, 1997, “Probing the boundaries of ignorance in policy analysis” American
Behavioral Scientist 40 277-298.
Eliasson I, 2000, “The use of climate knowledge in urban planning” Landscape and Urban
Planning 48 31-44.
Gandemer J, 1975, “Wind environment around buildings: aerodynamic concepts”, in
Proceedings of the 4th International Conference on Wind Effects on Buildings and Structures,
Ed. Keith John Eaton, Cambridge University Press, Heathrow (UK), 423-432.
Heisler, G.M., 1990, “Mean wind speed below building height in residential neighborhoods with different tree densities” ASHRAE Trans 96 (1) 1389-1396.
Isyumov N, Davenport AG, 1975, “The ground level wind environment in built-up areas”, in
Proceedings of the 4th International Conference on Wind Effects on Buildings and Structures,
Ed. Keith John Eaton, Cambridge University Press, Heathrow (UK).
Koss HH, 2006, “On differences and similarities of applied wind comfort criteria” Journal of
Launder B E, Spalding D B, 1972, Lectures in Mathematical Models of Turbulence (Academic Press, London, UK).
Launder B E, Reece G J, Rodi W, 1975, “Progress in the Development of a Reynolds-Stress Turbulence Closure” Journal of Fluid Mechanics 68 (3) 537-566.
Launder BE, 1989, “Second-Moment Closure: Present… and Future?” International Journal
of Heat and Fluid Flow 10 (4) 282-300.
Lawson T V, Penwarden A D, 1975, “The effects of wind on people in the vicinity of buildings”, in Proceedings of the 4th International Conference on Wind Effects on Buildings
and Structures, Ed. Keith John Eaton, Cambridge University Press, Heathrow (UK), 605-622.
Madanipour A, 1999, “Why are the design and development of public spaces significant for cities?” Environment and Planning B: Planning and design 26 879-891.
Murakami S, Iwasa Y, Morikawa Y, 1986, “Study on acceptable criteria for assessing wind environment on ground level based on resident’s diaries” Journal of Wind Engineering and
Nikolopoulou M, Baker N, Steemers K, 2001, “Thermal comfort in outdoor urban spaces: understanding the human parameter” Solar Energy 70 (3) 227-235.
Nikolopoulou M, Steemers K, 2003, “Thermal comfort and psychological adaptation as a guide for designing urban spaces” Energy and Buildings 35 (1) 95-101.
Nikolopoulou M, Lykoudis S, 2006, “Thermal comfort in outdoor urban spaces: analysis across different European countries” Building and Environment 41 (11) 1455-1470.
Ryser L, Halseth G, 2008, “Institutional barriers to incorporating climate responsive design in commercial redevelopment” Environment and Planning B: Planning and design 35 34-55
Santamouris M, 1998 Natural Ventilation in Buildings: A design Handbook (F.Allard Editor, London, UK).
Shih T H, Liou W W, Shabbir A, Zhu J, 1995, “A new k-ε eddy-viscosity model for high Reynolds number turbulent flows- model development and validation” Computers & Fluids 24 (3) 227-238.
Stathopoulos Th, Wu H, 1995, “Generic models for pedestrian-level winds in built-up regions” Journal of Wind Engineering and Industrial Aerodynamics 54 (2) 515-525.
Stathopoulos T, Wu H, Zacharias J, 2004, “Outdoor human comfort in an urban climate”
Building and Environment 39 297-305.
Stathopoulos T, 2006, “Pedestrian level winds and outdoor human comfort” Journal of wind
engineering and industrial aerodynamics 94 769-780.
Tacken M, 1989, “A comfortable wind climate for outdoor relaxation in urban area” Building
and Environment 24 (4) 321-324.
Teller J, 2003, “A spherical metric for the field-oriented analysis of complex urban open spaces” Environment and Planning B: Planning and Design 30 339-356.
Walton D, Dravitzki V, Donn M, 2007, “The relative influence of wind, sunlight and temperature on user comfort in urban outdoor spaces” Building and Environment 42 3166-3175.
Willemsen E, Wisse J A, 2007, “Design for wind comfort in The Netherlands : Procedures, criteria and open research issues” Journal of Wind Engineering and Industrial Aerodynamics 94 781-797.
Wiren N G, 1975, “A wind tunnel study of wind velocities in passages between and through buildings”, in Proceedings of the 4th International Conference on Wind Effects on Buildings
and Structures, Ed. Keith John Eaton, Cambridge University Press, Heathrow (UK), 465-475.
Yang P P, Putra S Y, Li W, 2007, “Viewsphere : a GIS-based 3D visibility analysis for urban design evaluation” Environment and Planning B: Planning and design 34 971-992.