Pépite | Nouvelle technologie de contact pour CMOS FDSOI 10 nm et en deça
219
0
0
Texte intégral
(2) Thèse de Julien Borrel, Lille 1, 2017. © 2017 Tous droits réservés.. lilliad.univ-lille.fr.
(3) Thèse de Julien Borrel, Lille 1, 2017. “The man who goes farthest is generally the one who is willing to do and dare. The sure-thing boat never gets far from shore.” Dale Carnegie. © 2017 Tous droits réservés.. lilliad.univ-lille.fr.
(4) Thèse de Julien Borrel, Lille 1, 2017. Acknowledgments My doctoral research was performed from 2014 to 2017 and took place between the Leti research institute of the French Alternative Energies and Atomic Energy Commission (CEA) in Grenoble, STMicroelectronics in Crolles and the Institute of Electronics, Microelectronics and Nanotechnology (IEMN) in Lille. I would like to address my first thanks to all the people who have helped me during my PhD to elaborate experiments and to perform them. The semi-industrial and industrial environments of respectively CEA-LETI and STMicroelectronics obviously offer an exceptional framework, allowing developing disruptive devices using avant-garde manufacturing equipments. Nevertheless, interacting with such environments also requires a significant level of expertise in various types of areas from the premises of stand-alone process developments to the final electrical characterization of manufactured devices. Such an expertise has been provided to me during these three years in both CEA-LETI and STMicroelectronics and I am glad I was able to learn from these experts such an extensive amount of invaluable knowledge. I wish to express my thankfulness to the Laboratory of Logic Component Integration (LICL) of the CEA/LETI and the metal process development group of STMicroelectronics. Both groups have welcomed me and helped me achieving my PhD in the best conditions I could have wished for. A lot of support was given to me, allowing me to blossom in both LETI and STMicroelectronics environments. My deepest gratitude goes to my supervisors Louis Hutin (CEA) and Magali Grégoire (STM) and my PhD director Emmanuel Dubois (IEMN). Always providing me food for thought in the technical and scientific fields, they allowed me to step back from my work and to grasp a broader vision of my project. Their experience and ability to communicate results took a huge part in my success to produce a high number of articles and abstracts. I would like to particularly thank Louis who speaks English better than I speak French. I had the chance to travel a lot, being systematically accepted to all the conferences I applied to, and I truly believed that this is directly linked to his communication skills and his rigor. He also supported me in a daily basis, even in the times of doubt when my motivation or my sense of legitimacy were challenged. Without him, I would not have been able to perform the same amount of work with the same degree of quality. My thoughts also goes to all the others students. Without them, this journey would not have been the same. I would specially thank Mathilde, Heimanu, Luca, Alex, Julien, Jose and Lina to whom I wish the best. Thanks to them, I know that I will keep with me great memories of these three years. I am going to miss them a lot.. © 2017 Tous droits réservés.. lilliad.univ-lille.fr.
(5) Thèse de Julien Borrel, Lille 1, 2017. Finally, I would like to thank my family and my family in law who have supported me during these three years and particularly my wife Elodie who has been here for me in all the situations, dealing with my highs and my lows and sharing my joys and my pains.. © 2017 Tous droits réservés.. lilliad.univ-lille.fr.
(6) Thèse de Julien Borrel, Lille 1, 2017. Table of Contents List of Acronyms ............................................................................................ 10 Physical Values ............................................................................................... 12. Chapter I: MOSFETs miniaturization: expectations and limits ................. 13 Introduction to Chapter I .................................................................... 15 I.1 Operative principle of MOSFET for digital logic ......................................16 I.1.1 Basic ideal MOSFET operations...........................................................16 I.1.2 Actual electrical behavior ......................................................................17 I.1.3 Parasitic elements in a real MOSFET ..................................................22 I.1.4 Device performance ...............................................................................25 I.2 MOS scaling....................................................................................................27 I.2.1 Costs reduction and performance improvement.................................27 I.2.2 Scaling limitations ..................................................................................29 I.2.3 Next node generations challenges .........................................................32 I.3 Ideal contact theory .......................................................................................35 I.4 Real contact case ............................................................................................39 I.4.1 Interface states ........................................................................................39 I.4.2 Fermi Level Pinning...............................................................................41 I.5 Contact resistivity optimization ...................................................................42 I.5.1 Space charge region width reduction ...................................................43 I.5.2 Effective SBH reduction via FLP mitigation .......................................44 I.5.3 Effective SBH reduction via dipole engineering..................................49 I.6 Chapter conclusion ........................................................................................54 I.7 Thesis Objectives ...........................................................................................55 I.8 References ......................................................................................................56. 6. © 2017 Tous droits réservés.. lilliad.univ-lille.fr.
(7) Thèse de Julien Borrel, Lille 1, 2017. Chapter II: MIS contacts modeling and simulation ..................................... 63 Introduction to Chapter II ................................................................... 65 II.1 Analytical algorithm presentation..............................................................66 II.1.1 Fermi Level Pinning .............................................................................67 II.1.2 1-D band edge diagram evaluation .....................................................75 II.1.3 J-V characteristics generation .............................................................80 II.2 Stand-alone contact J-V characteristics ....................................................90 II.2.1 Zero-barrier contact case .....................................................................90 II.2.2 MIS contacts simulations .....................................................................91 II.2.3 Partial conclusions ................................................................................101 II.3 Impact on devices performance ..................................................................103 II.3.1 DC impact..............................................................................................103 II.3.2 AC impact..............................................................................................108 II.4 Chapter conclusions.....................................................................................116 II.5 References .....................................................................................................118. Chapter III: Implementation and physico-chemical characterization of ultrathin dielectrics ................................................................................................ 121 Introduction to Chapter III ................................................................. 123 III.1 Deviation from ideal process flow .............................................................124 III.1.1 Control of the substrate surface oxidation .......................................124 III.1.2 MIS contacts instability ......................................................................126 III.2 Experimental results ..................................................................................133 III.2.1 Indirect TiOx implementation by scavenging ..................................134 III.2.2 ALD based high-k implementations ..................................................141 III.2.3 CVD based high-k implementations ..................................................149 III.3 Chapter conclusions ...................................................................................152. 7. © 2017 Tous droits réservés.. lilliad.univ-lille.fr.
(8) Thèse de Julien Borrel, Lille 1, 2017. III.4 References ...................................................................................................154. Chapter IV: Electrical characterization of MIS contacts ............................ 157 Introduction to Chapter IV.................................................................. 159 IV.1 Conventional contact characterization .....................................................160 IV.1.1 Specific contact resistivity ..................................................................160 IV.1.2 Schottky barrier height.......................................................................161 IV.2 Conventional test structures ......................................................................163 IV.2.1 Back contact measurement.................................................................163 IV.2.2 Transmission Line Model (TLM) ......................................................167 IV.2.3 Cross Bridge Kelvin Resistor (CBKR) ..............................................171 IV.2.4 Summary of the section.......................................................................177 IV.3 MIS contacts integration............................................................................178 IV.3.1 Substrate characteristics.....................................................................178 IV.3.2 Dielectric characteristics.....................................................................180 IV.3.3 Expected materials parameters..........................................................182 IV.3.4 Structures layout .................................................................................182 IV.4 Experimental results ..................................................................................184 IV.4.1 TLM measurements ............................................................................184 IV.4.2 CBKR measurements ..........................................................................190 IV.5 Discussions...................................................................................................202 IV.5.1 Obtaining contact signature I-V characteristics with CBKR .........202 IV.5.2 The TiN/TiO2/Si case...........................................................................203 IV.6 Chapter conclusions ...................................................................................206 IV.7 References ...................................................................................................208. Chapter V: General conclusions.................................................................... 211 V.1 Impact of MIS contacts on advanced MOSFETs nodes ...........................214. 8. © 2017 Tous droits réservés.. lilliad.univ-lille.fr.
(9) Thèse de Julien Borrel, Lille 1, 2017. V.2 Practical ultra-thin dielectric implementation ..........................................215 V.3 Effective electrical properties of MIS contacts..........................................215 V.4 Prospects .......................................................................................................216 V.5 References .....................................................................................................218. 9. © 2017 Tous droits réservés.. lilliad.univ-lille.fr.
(10) Thèse de Julien Borrel, Lille 1, 2017. List of Acronyms AC: Alternating Current. MIIS: Metal Insulator Insulator Semiconductor. ALD: Atomic Layer Deposition. MIS: Metal Insulator Semiconductor. ARXPS: Angle Resolved X-ray Photoelectron Spectroscopy. MOSFET: Metal-Oxide-Semiconductor Field Effect Transistor. BEOL: Back End Of Line. MS: Metal Semiconductor. BGE: Band Gap Energy. NMOS: “N” Metal-Oxide-Semiconductor. BOX: Buried OXide. PMOS: “P” Metal-Oxide-Semiconductor. CBO: Conduction Band Offset. POCO: POly COntact. CBKR: Cross Bridge Kelvin Resistor. PVD: Physical Vapor Deposition. CMOS: Complementary Metal Oxide Semiconductor. RC: Resistance Capacitance. CNL: Charge Neutrality Level CPP: Contacted Poly Pitch CVD: Chemical Vapor Deposition DC: Direct Current DIBL: Drain Induced Barrier Lowering DIGS: Default-Induced Gap Sates EELS: Electron Energy Loss Spectroscopy EOT: Equivalent Oxide Thickness FDSOI: Fully Depleted Silicon On Insulator. RO: Ring Oscillator RTA: Rapid Thermal Annealing SBH: Schottky Barrier Height SC1: Standard Clean 1 SC2: Standard Clean 2 SCE: Short Channel Effects SCR: Space Charge Region SD: Source Drain SOI: Silicon On Insulator. FE: Field Emission. SPICE: Simulation Program with Integrated Circuit Emphasis. FLP: Fermi Level Pinning. SS: Subthreshold Swing. HAADF: High-Angle Annular Dark-Field. STEM: Scanning Transmission Electron Microscope. HK: High-K IC: Integrated Circuit ITRS: International Technology Roadmap for Semiconductor. TCAD: Technology Computer Aided Design TE: Thermionic Emission TFE: Thermionic Field Emission. MIGS: Metal-Induced Gap States. TEM: Transmission Electron Microscope. TEMAH: Tetrakis(EthylMethylAmino)Hafnium. TLM: Transmission Line Model. 10. © 2017 Tous droits réservés.. lilliad.univ-lille.fr.
(11) Thèse de Julien Borrel, Lille 1, 2017. TMA: TriMethylAluminium. UHV: Ultra High Vacuum. TOF-SIMS: Time Of Flight Secondary Ion Mass Spectrometry. VBO: Valence Band Offset XPS: X-ray Photoelectron Spectrosco. TWKB: Transmission Wentzel-KramersBrillouin. 11. © 2017 Tous droits réservés.. lilliad.univ-lille.fr.
(12) Thèse de Julien Borrel, Lille 1, 2017. Physical Values Notation ε0. Name Vacuum permittivity. Value 8.85 x 10⁻¹² F.m-1. ħ. Reduced Planck constant. 1.054 x 10⁻³⁴ J.s. m0. Electron rest mass. 9.11 x 10⁻³¹ kg. ni. Intrinsic carrier concentration of Si. 1 x 1010 cm-3. q. Elementary charge. 1.6 x 10⁻¹⁹ C. 12. © 2017 Tous droits réservés.. lilliad.univ-lille.fr.
(13) Thèse de Julien Borrel, Lille 1, 2017. Chapter I MOSFETs miniaturization: expectations and limits Introduction to Chapter I ............................................................................................................. 15 I.1. Operative principle of MOSFET for digital logic ......................................................... 16. I.1.1 Basic ideal MOSFET operations .............................................................................. 16 I.1.2 Actual electrical behavior ......................................................................................... 17 I.1.3 Parasitic elements in a real MOSFET ....................................................................... 22 I.1.4 Device performance .................................................................................................. 25 I.2. MOS scaling .................................................................................................................. 27. I.2.1 Costs reduction and performance improvement ....................................................... 27 I.2.2 Scaling limitations .................................................................................................... 29 I.2.3 Next node generations challenges ............................................................................. 32 I.3. Ideal contact theory ....................................................................................................... 35. I.4. Real contact case ........................................................................................................... 39. I.4.1 Interface states .......................................................................................................... 39 I.4.2 Fermi Level Pinning ................................................................................................. 41 I.5. Contact resistivity optimization..................................................................................... 42. I.5.1 Space charge region width reduction ........................................................................ 43 I.5.2 Effective SBH reduction via FLP mitigation ............................................................ 44 I.5.3 Effective SBH reduction via dipole engineering ...................................................... 49. © 2017 Tous droits réservés.. I.6. Chapter conclusion ........................................................................................................ 54. I.7. Thesis Objectives .......................................................................................................... 55. I.8. References ..................................................................................................................... 56. lilliad.univ-lille.fr.
(14) Thèse de Julien Borrel, Lille 1, 2017. © 2017 Tous droits réservés.. lilliad.univ-lille.fr.
(15) Thèse de Julien Borrel, Lille 1, 2017. Chapter I MOSFETs miniaturization: expectations and limits. Introduction to Chapter I The purpose of this chapter is to present the basic theory of Metal-Oxide-Semiconductor Field Effect Transistor (MOSFET) electrical behavior and the principles of its functioning. The main general concepts and parameters of the field are introduced. The first part is dedicated to the geometric description of the device itself as well as its functioning. Starting from a description of the MOSFET as an ideal switch, more realistic elements are then added step by step leading to an accurate representation of its modes of operation. The second part focuses on the miniaturization trend observed in the microelectronic devices from its original formulation to its practical implementation. The issues arising from reaching ultraaggressively scaled devices are also presented. Finally, the last three sections are an introduction of the thesis work presented in this manuscript: tackling the contact resistance issue. These parts will be respectively dedicated to present the theory behind the contact resistance, to introduce the phenomena occurring at the real metal/semiconductor interfaces and finally to present the state-of-the-art concerning contact resistance engineering.. 15. © 2017 Tous droits réservés.. lilliad.univ-lille.fr.
(16) Thèse de Julien Borrel, Lille 1, 2017. I.1 Operative principle of MOSFET for digital logic In this part, the basic electrical behavior of a MOSFET is described. The first section focuses on the ideal operation of such device in order to give a quick overview of the main transfer characteristics and equations. In the second and third section, limitations arising from the MOSFET switching physics in itself as well as its practical integration are discussed. Finally the last section presents notions of dynamical performance evaluation.. I.1.1. Basic ideal MOSFET operations. As its name suggests, the fundamental stack of any MOSFET (Metal-Oxide-Semiconductor Field Effect Transistor) is composed of three main elements. The first is a semiconductor (e. g. Si, Ge, InGaAs) where a current of electric carriers can take place. These carriers travel between two reservoirs called source and drain via a path called channel. The state of this channel, open or closed, is controlled by a field effect [Lilienfeld_1925]. This field arises from the bias of an element called gate which consists in a metallic electrode separated from the channel by a dielectric layer called gate oxide. Depending on the dopants introduced in the source and drain, the current carriers flowing in the channel can be electrons (the MOSFET is referred to as NMOS because electron carry an Negative charge) or quasiparticles equivalent to a lack of electrons called holes (the MOSFET is referred to as PMOS for Positive charge).. Figure I-1 : (a) Schematic of a traditional bulk NMOS; (b) Ideal Id-Vgs curve of a NMOS when biasing the drain with a positive voltage.. 16. © 2017 Tous droits réservés.. lilliad.univ-lille.fr.
(17) Thèse de Julien Borrel, Lille 1, 2017. Chapter I MOSFETs miniaturization: expectations and limits The relative position of the MOSFET main elements is illustrated in Figure I-1 (a) in the case of a bulk NMOS. The gate bias required to actuate the MOSFET depend on its nature i.e. NMOS or PMOS. As presented for the NMOS in Figure I-1 (a) while the source and drain are n-type semiconductor the substrate is p-type. In order to allow flowing electrons from one reservoir to the other, a sine qua non condition is to induce a sufficient amount of electrons in the channel region which then become the majority carriers at the top surface of the p-type substrate. This can be done by using the field of the gate. The gate acts as the switch of the transistor and has to be positively biased in the case of a NMOS. Moreover, the amount of electrons attracted in the channel has to overcome the amount of holes initially present in the p-type substrate. One can distinguish a typical value of the gate bias called threshold voltage and noted Vt where this transition occurs. The ideal curve of the drain current as a function of the gate-to-source bias (Id - Vgs) of a NMOS is presented in Figure I-1 (b) and illustrates the transition from the OFF-state to the ON-state occurring when Vgs equals Vt. Similar considerations can be adapted to a PMOS which mainly differs from the fact that instead of actuating the device with positive biases, negative ones have to be applied. Therefore, PMOS and NMOS are two switches with dual operating modes and can be used together as elementary elements for digital gates and circuits. Thus this paradigm is called CMOS standing for Complementary Metal Oxide Semiconductor.. I.1.2. Actual electrical behavior. I.1.2.a. Current leakage and subthreshold slope. The model proposed above presents the MOSFET as an ideal switch actuated by the gate bias. Nevertheless, the functioning of such device is not perfect: •. The transition from the OFF-state to the ON-state is not as steep as introduced before in Figure I-1. The slope of the Id-Vgs around Vt is not infinite but has a limited value.. •. In the OFF-state (Vgs < Vt) the current flowing from the source to the drain is not zero. This current is called leakage current and is responsible for energy consumption even in the OFF-state.. When applying a bias Vds, the density of electrons is larger in the drain than in the source. Thus, even when the gate is biased below the threshold voltage Vt, a diffusion current occurs in the channel because of the gradient of reservoir majority carriers between the source and the drain. The diffusion current density occurring in the channel for a NMOS device is described by Equation (I-1).. 17. © 2017 Tous droits réservés.. lilliad.univ-lille.fr.
(18) Thèse de Julien Borrel, Lille 1, 2017. ( ). =−. (I-1). where the x axis is taken along the channel, n(x) is the density of electrons and. is a diffusion constant. which is a characteristics of the semiconductor material. Integrating Equation (I-1) in the channel and considering that the variation of the electron density is linear, Equation (I-2) can be obtained. (0) − (. =. ). (I-2). where n(0) and n(Lg) are respectively the density of electrons in the source and the drain and A is the cross-sectional area of the current flow. According to [Sze_1981], the two densities mentioned above can be found using Equations (I-3) and (I-4) where. referred to the surface potential inside the channel. (0) =. =. (I-3) (. !" ). (I-4). Then by including Equations (I-3) and (I-4) in Equation (I-2 ), the drain current is described by Equation (I-5). =. (1 −. !". ). (I-5). In this equation, one can see that the current is exponentially proportional to the surface potential. In order to investigate the subthreshold regime, the link between this surface potential and the gate voltage has to be established. Based on Figure I-1, this calculus can be easily summed up by a capacitive divider as shown in Figure I-2.. 18. © 2017 Tous droits réservés.. lilliad.univ-lille.fr.
(19) Thèse de Julien Borrel, Lille 1, 2017. Chapter I MOSFETs miniaturization: expectations and limits. Figure I-2: Capacitive divider used to evaluate the link between the surface potential and the gate voltage. Cchannel is composed by Cdep and Cinv in parallel, the latter being negligible compared to the former when the gate voltage is lower than the onset of inversion.. Because the gate is biased below the threshold voltage the density of electrons in the channel is low compared to the density of ionized dopants. In this condition, the capacitance due to the inversion layer can be neglected compared to the depletion capacitance. By applying the capacitive divider to this situation, one can obtain Equation (I-6). =$. %&' %&' ( %. )*. =. $ +. (I-6). With +=. %&' ( % %&'. )*. (I-7). Combining Equations (I-5) and (I-6), the drain current Id becomes: =. !, - (1. −. !". ). (I-8). 19. © 2017 Tous droits réservés.. lilliad.univ-lille.fr.
(20) Thèse de Julien Borrel, Lille 1, 2017. As mentioned previously, the transition from the OFF-state to the ON-state cannot be considered infinitely steep and then the definition of Vt as the Vgs at which the transition occurs is inaccurate. In experimental studies, the most accurate method to extract Vt is the transconductance peak or doublederivative method [Simoen_1996]. Defining the transconductance gm according to Equation (I-9), Vt is. defined as the gate voltage Vgs corresponding to the maximum of the ./0 /.$ curve. /0 =. . .$. (I-9). Considering this definition of the threshold voltage, the associated threshold current It is defined by Equation (I-10): 2. !3 - (1. =. −. !". ). (I-10). Thus one can rewrite Equation (I-8) and obtain (I-11). =. 2. (!, ×. -. !3 ). (I-11). The two investigated parameters, i.e. the leakage current and the subthreshold slope, can be obtained using the expression of Id in Equation (I-11). As presented in this equation, the drain current is an exponential function of the gate bias in the subthreshold mode. Thus, when plotting. as a function of $ in a logarithmic scale, the representative. curve is a straight line. The slope of this curve is called the “subthreshold slope” and its opposite the subthreshold swing (noted SS). The latter can be evaluated by deriving Equation (I-11) leading to (I-12). Moreover, the IOFF can be evaluated when considering Vgs = 0 in Equation (I-11) leading to Equation (I-13). 44 =. $ % )* 78 = ln (10) ;1 ( < 56/( ) %&'. =>>. =. 2. !3 -. =. 2. !3. ?? @ (A ). (I-12). (I-13). One can see that the subthreshold swing appears to be a key parameter to evaluate the static performance of a more realistic transistor. Indeed reducing the leakage current and ensuring at the same 20. © 2017 Tous droits réservés.. lilliad.univ-lille.fr.
(21) Thèse de Julien Borrel, Lille 1, 2017. Chapter I MOSFETs miniaturization: expectations and limits time an ultra-steep switch from the OFF-state to the ON-state can be achieved by approaching the SS value to zero (thus tending towards an ideal switch).. Nevertheless, based on Equation (I-12), the SS lower limit is obtained when %. reaches. ln(10) which corresponds to 60 mV.dec-1 at 300K.. I.1.2.b. )*. = %&' and. Drain bias dependence. While the gate acts as the switch of the MOSFET and control the presence or the absence of charge carriers in the channel, making these carriers flow is controlled by the bias of the drain. Depending on the magnitude of this bias, two regimes can be distinguished: the ohmic and saturation modes. Considering a long channel model, these two regimes can be described as follow. In the former, Id is noted Id,lin and is almost linearly proportional to Vds at low Vds as shown in Equation (I-14).. ,@. where C). = C) %&'. D. I $ − $2 $ −. $H J 2. (I-14). is the charge carrier effective mobility, %&' is the gate oxide capacitance per unit area, Dis. the gate width and. is the gate length.. When Vds is increased and reached the value Vds,sat = Vgs - Vt, the transistor passes to the saturation mode which can be described as follow: since the effective bias seen by the part of the channel close to the drain is Vgd, as the bias on the drain is increased, the actual voltage difference between the drain and the gate is reduced. When Vds finally reaches Vds,sat, Vgd is lower than Vt. If the drain is biased at higher voltages, the carriers continue to be accelerated but the channel is pinched-off close to the drain. In this regime, the drive current Id obtained from this trade-off is constant with Vds as described in Equation (I15). , F2. = C) %&'. D H $ , 2. F2. (I-15). Typical Id-Vgs and Id-Vds curves of a NMOS are presented in Figure I-3 (a) and (b). In Figure I-3 (a) one can see that the actual electrical response of a MOSFET is far from the expected ideal one. These non-idealities arise from the founding principles of the MOSFETs in itself meaning that such a type of 21. © 2017 Tous droits réservés.. lilliad.univ-lille.fr.
(22) Thèse de Julien Borrel, Lille 1, 2017. devices is theoretically unable to present an ideal steeper switching profile. Additionally to these theoretical limitations, transistors present also parasitic elements arising from their practical implementation which limit even more the functioning.. Id. Id NMOS @ Vds > 0. Saturation Vds = Vds,sat. ION Ohmic mode. Weak inversion Strong inversion. a). Vt. Saturation mode. Vgs. Vgs↘. b). Vds. Vdd. Figure I-3: Typical (a) Id-Vgs and (b) Id-Vds curve for a NMOS.. I.1.3. Parasitic elements in a real MOSFET. In this section, parasitic elements arising from the integration of MOSFETs are described. Although they are not taken into account in the model previously presented, these additional contributions have a significant impact on the devices performances in both static (DC) and timedependent (AC) regimes.. I.1.3.a. Access resistance. The previous description of the transistor assumes that the source and drain are perfectly conducting elements and that no interface effects occurs between them and the channel. In real devices, several parasitic resistances have to be considered and then alter the previous model. According to [Ng_1986], the components to consider are four in number and are represented in Figure I-4: •. Rco stands for contact resistance and arises from the interface between the contact metal and the. source/drain semiconductor. Although its origin and expression will be extensively discussed in sections I.3 and I.4, KL& can be approximated by Equation (I-16).. KL& = ML /DL. L. (I-16). 22. © 2017 Tous droits réservés.. lilliad.univ-lille.fr.
(23) Thèse de Julien Borrel, Lille 1, 2017. Chapter I MOSFETs miniaturization: expectations and limits where ML is the contact specific resistivity, DL its width and. L. its length. While the resistivity depends. only on the nature of the metal/semiconductor interface (materials, cleaning treatment, doping concentration, etc.), DL and. L. only refer to geometrical parameters. Thus, for a given interface the. Raccess. contact resistance varies with its size.. Contact Width. Oxide. Rco b). Rsh. Vgs. Racc c). Rsp. Raccess. Junction. a). Figure I-4: (a) Schematic diagram of the source/drain region showing the current path and (b) representation of the associated components of resistance. (c) Schematic MOSFET circuit showing access resistances noted Raccess.. •. Rsh refers to the sheet resistance of the source and drain semiconductors. Usually, in order to. reduce this component and to ensure the thermal stability of the metal/semiconductor interface, an intermetallic compound is intentionally formed at the source/drain surfaces prior to metallization. When the source and drain are based on silicon, this process is called silicidation. • The last two resistances are Rsp and Racc defined as the spreading and accumulation resistances.. They are gate-voltage dependent [Ng_1986]. On the one hand, when the current reaches the end of the source and drain regions and the field lines are constricted in a smaller area. This phenomenon is referred to as crowding effect and induces the resistance Rsp. On the other hand, at the metallurgic junctions (source/channel and channel/drain interfaces), the concentration of carriers abruptly varies leading to a modification of the transport properties. This leads to the apparition of the resistance Racc. All this components are often treated as a single parasitic contribution called access resistance and referred to as Raccess as defined in Equation (I-17). KFLL). = KL& ( K. N. (K. *. ( KFLL. (I-17). 23. © 2017 Tous droits réservés.. lilliad.univ-lille.fr.
(24) Thèse de Julien Borrel, Lille 1, 2017. Being in series with the channel these parasitic resistive components may have a significant impact on the transistor electrical behavior. Indeed when biasing a transistor, a part of the applied voltage drops in the source and the drain due to their associated access resistance. This leads in turn to a lower effective bias applied on the channel. As shown in Figure I-4 (c), this effective bias can be noted $. ). and can be found solving (I-18). $. = $ − (K. ). ,FLL). (K. ,FLL). )×. It is worth noting that this problem is self-consistent since finding $. is itself a function of $. I.1.3.b. ). (I-18) ). require knowing. which. .. Stray capacitances. As for the resistive aspect, a MOSFET presents some parasitic capacitive elements which will degrade its performance. While the resistive ones have an impact in both the static and the dynamic regimes, the stray capacitances mostly degrade the dynamic performance. The MOSFET schematic including these parasitic capacitances is shown in Figure I-5. Therefore, the total capacitance of the gate Cg,tot is described by Equation (I-19). %. ,2&2. =%. L. ( 2 × % ( 2 × %&O ( 2 × %& ( 2 × % *FL)P. (I-19). % and %&O are respectively the inner-fringe and overlap capacitances and represent the capacitive effect. between the gate and the source/drain through respectively the gate oxide and the channel, and only the gate oxide. While %. has a remote effect, %&O has a direct coupling but only occurs when the gate. overlaps the source/drain. For their part, %& and % *FL)P are called outer-fringe and spacer capacitances.. They are capacitive couplings occurring through the spacer between the gate and respectively the source/drain and the metallic plug.. 24. © 2017 Tous droits réservés.. lilliad.univ-lille.fr.
(25) Thèse de Julien Borrel, Lille 1, 2017. Chapter I MOSFETs miniaturization: expectations and limits. Figure I-5: Schematic of a MOSFET presenting the main parasitic capacitors.. While %. L. is the actuation capacitance used to switch the state of the channel, the other capacitors. have no operative interest but increase the overall capacitance of the devices. Thus when a MOSFET is working, a part of the energy required to dynamically switch its state is wasted due to theses capacitors.. I.1.4. Device performance. As mentioned previously, the digital gates and circuits are based on the simultaneous use of PMOS and NMOS devices. One of the most basic element in a digital circuit is a CMOS inverter. This elementary brick is only composed by a NMOS and a PMOS having the same bias on their gate and sharing their drains (as shown in Figure I-6 (a)). Analyzing the performance of this elementary component allows to explain the behavior of more complex structures such as NOR and NAND gates. In particular the intrinsic delay of the inverter is a key parameter in dynamic regime. As presented in Figure I-6 (b) and (c), when Vin is set at the supply voltage of the circuit (noted Vdd), the NMOS is in its ON-state and can thus be assimilated to finite resistance while the PMOS is in its OFF-state and can be assimilated to an open switch. Then, the output of the inverter is set to 0 V. On the contrary, when Vin is set at 0 V the NMOS and PMOS are respectively in their OFF- and ON-state and thus Vout is set to Vdd. While one of them is used as a pull-up (output to Vdd), the other is used as a pull-down (output to GND) with always exactly one of them in its ON-state.. 25. © 2017 Tous droits réservés.. lilliad.univ-lille.fr.
(26) Thèse de Julien Borrel, Lille 1, 2017. b). Vdd. c). Vdd. Vdd. PMOS. a). Vout. NMOS. Vin. Vdd. 0. Vin = Vdd Output discharging by n-MOS. Vin = 0 Output charging by p-MOS. Figure I-6: (a) Static CMOS inverter where Vdd stands for supply voltage; (b) and (c) Model for respectively high and low input. In (b) and (c) the arrows represent the direction of the current.. The description above allows to understand the basic response of an inverter from a static point of view. Nevertheless, the transfer of the bias from the input to the output is not instantaneous and presents a transient signal. Indeed, the next stage is often itself composed by transistors. As introduced in Figure I-6, transferring a bias to the input of the next stage basically consists in charging the gate capacitance of a transistor at the considered bias through the channel resistance of the previous stage. Assuming, that the transistors continuously operate in saturation, the typical delay is approximated by Equation (I-20). Q. 2. =. %. ,2&2 $ , F2. =%. ,2&2 K=R. (I-20). With K=R = $ /. , F2. (I-21). According to this simple model, it appears that the delay of an inverter increase with %. ,2&2. and. K=R . While a part of these parameters is due to the functioning of the MOSFET and cannot be reduced. such as Cgc, another part is mainly due to parasitic elements and strongly depends on the device geometry. and implementation. 26. © 2017 Tous droits réservés.. lilliad.univ-lille.fr.
(27) Thèse de Julien Borrel, Lille 1, 2017. Chapter I MOSFETs miniaturization: expectations and limits. I.2 MOS scaling For decades, one of the driving force of the microelectronics industry has been to reduce the dimensions of the transistor leading to an increase of the transistors density per chip and thus reducing the manufacturing price per transistor [Moore_1965]. Beyond the economical benefit, it was also shown that such a reduction of dimensions would lead to a gain in terms of device performance [Dennard_1974]. In this section, while the first part will be dedicated to the main concepts of transistor scaling as well as the expected performance improvements, the second part will focus on the limitations of such scaling.. I.2.1. Costs reduction and performance improvement. As introduced previously, for many years the industry has been focusing on following the law predicted in 1965 by Gordon Moore [Moore_1965]. This law stipulates that in order to reduce the cost per transistor, and thus the cost to manufacture products, the number of transistors per unit area should be increased. Doing so implies introducing new technology enablers and funding research and development groups and then leads to an increase of the cost of a given wafer. Nevertheless, the density of transistors in this same wafer being increased the actual cost per transistor in reduced. Even being just a prediction and not a physical law, this trend has been observed for decades. In 2014, this same trend was still presented as relevant and achievable for next generation transistors as shown in Figure I-7 [Bohr_2014].. Figure I-7: Illustration of the reduction of the cost per transistor if following the scaling policy [Bohr_2014]. 27. © 2017 Tous droits réservés.. lilliad.univ-lille.fr.
(28) Thèse de Julien Borrel, Lille 1, 2017. Practically, Moore’s law predicts that the density of transistors on a chip has to double every two years to minimize manufacturing costs. Stated in another way, it means that the surface of a transistor has to be divided by two from one generation to the next one. Considering that the surface S n of a transistor of the generation n is approximately given by its width W n multiplied by its Contact Poly Pitch (noted CPP n) as presented in Figure I-8, one can obtain {S n+1,W n+1, CPP n+1} from Equation (I-22) for the next node generation n+1. 4. SA. =. 4 D × %TT √2 √2 = = D × %TT = D 2 2 2 2. SA. × %TT. SA. (I-22). From this equation, it appears that in order to reduce the area by a factor two, both the W n and the CPP n must be reduced by a factor ~0.7.. CPP. Contacts. POCO. W. Top view. Lcont Lgate Figure I-8: Top view of two MOSFETs in series.. Besides presenting a financial interest, scaling the devices also present a real interest in terms of performance and energy consumption. The Dennard’s law (named after Robert Dennard who wrote its founding paper) states that if one manages to scale all the dimensions of a transistor by a scaling factor named 1/κ thus all the electric quantities will scale with it [Dennard_1974]. Indeed, if the gate length and width are scaled by a factor 1/κ thus the RON can be considered as constant for a given set of materials. Thus dividing the bias by κ leads to a current also reduced by κ. If one roughly defines the power per device by Equation (I-23) and the delay by (I-24):. 28. © 2017 Tous droits réservés.. lilliad.univ-lille.fr.
(29) Thèse de Julien Borrel, Lille 1, 2017. Chapter I MOSFETs miniaturization: expectations and limits T=V Q = K% =. (I-23) V%. (I-24). then this power is multiplied by a scaling factor 1/κ² and the delay by a factor 1/κ. All these scaling changes are summed up in Table I-1. It is worth noting that dividing the power of a device by κ² while increasing the density by κ² actually leads to power density per unit of area constant with the scaling. This assertion is very important since it ensures no overheating due to device scaling. Table I-1: Changes in integrated circuit performance which follow from scaling the circuit dimensions [Dennard_1974]. Parameter’s Name Device dimension Doping concentration Voltage Current Capacitance Delay time / circuit Power dissipation / circuit Power density / area. Parameter’s Value tox, Lg, W. Scaling Factor. Nd, Na. 1/κ. I. 1/κ. C ≈ εWLg/tox. 1/κ. U. Q ≈ UC/I UI. UI/WLg. κ. 1/κ 1/κ 1/κ² 1. Nevertheless, these Moore’s and Dennard’s laws were predicted during an era referred to as the “happy scaling years” where transistors were very large by today’s standards. At this time, reducing the gate length was not a threat for the transistor functioning and the parasitic elements were negligible compared to the other device parameters. These years are now over and the improvements due to the classical scaling have reached saturation.. I.2.2. Scaling limitations. As we reached ultra-scaled devices, the parasitic elements presented in section I.1.3 become prevalent. Additionally, phenomena called short channel effects, appeared at the end of the happy scaling era, are becoming more and more predominant. 29. © 2017 Tous droits réservés.. lilliad.univ-lille.fr.
(30) Thèse de Julien Borrel, Lille 1, 2017. I.2.2.a. Gate length reduction. In order to follow Moore’s law and then to scale the CPP by a factor 0.7 from a node generation to another, the gate length has been reduced more and more aggressively over the past half century going from 10µm in 1971 to 22nm in 2014 (resp. [Mueller_2006] and [Auth_2012]). Nevertheless, for the latest generations scaling this length was not trivial since new phenomena appeared. Indeed, as the gate length reaches the same order of magnitude as the depletion-layer widths of the source and drain junctions, these regions begin to overlap. Parasitic effects called Short Channel Effects (referred to as SCE) appear and lessen the electrostatic control of the channel by the gate [Yau_1974]. As presented in Figure I-9 for a NMOS, even if no bias is applied on the gate and the drain, the energy barrier in the channel is modified. Thus the gate loses a part of its electrostatic control on the channel leading in turn to threshold voltage reduction. This effect is often called itself Short Channel Effect even if this term gathers other phenomena. Moreover, the source and drain energy profiles being no longer independent, when a bias is applied to the drain an additional reduction of the channel barrier occurs and the threshold voltage is again reduced [Troutman_1979]. This second short channel effect is called Drain Induced Barrier Lowering (noted DIBL). Gate Oxide. Gate Oxide Source. Source. Drain. Drain Substrate. Substrate. a). d). Without Drain Bias. E. SCE Source. Source. Drain. b). Drain. e). With Drain Bias. E. c). DIBL qV. Source Drain. qV. Source f). Drain. Figure I-9: Schematic of (a) a long-channel and (d) a short-channel MOSFET representing the depletion regions (dashed lines). The associated energetic diagram is plotted (b,e) without and (d,f) with drain bias.. 30. © 2017 Tous droits réservés.. lilliad.univ-lille.fr.
(31) Thèse de Julien Borrel, Lille 1, 2017. Chapter I MOSFETs miniaturization: expectations and limits The two phenomena discussed above lead to an IOFF increase and a threshold bias roll-off. Therefore they mainly have an impact on the OFF-state and on the switching of the advanced nodes.. I.2.2.b. Parasitic increase issue. Additionally to these short-channel phenomena another limitation of the scaling arises from the parasitic elements. Indeed as we scale the devices, the parasitic resistances and capacitances which were negligible for long-channel transistors become prevalent. As presented previously, reducing the gate length Lg is limited since SCE and DIBL occur altering the electrostatic control of the channel. Thus in order to keep reducing the CPP, other dimensions have been recently reduced such as the POCO or the contact length Lcon (see Figure I-8). Nevertheless, this approach also presents its own drawbacks. Indeed, while reducing POCO would increase Cspacer (Figure I-5), reducing the contact length would increase the contact resistance Rco (Figure I-4) if the interface stays the same (Equation (I-16) ). The example of the contact resistance is addressed in Figure I-10. As shown in this figure, reducing CPP while keeping a specific contact resistivity ML of 10−8 Ω cm² would make the contact resistance KL& a. major contribution of the total access resistance KFLL) .. Figure I-10: Access resistance as a function of the Contact Poly Pitch singling out the contribution of the contact resistance [Hutin_2014]. 31. © 2017 Tous droits réservés.. lilliad.univ-lille.fr.
(32) Thèse de Julien Borrel, Lille 1, 2017. I.2.3. Next node generations challenges. As presented before, the reduction of dimensions of the elementary nodes involves new challenges. New device architectures as well as innovative materials and processes have been proposed over the past 15 years in order to perpetuate a good electrostatic control of the channel ON and OFF states while reducing the parasitic resistance and capacitance contributions.. I.2.3.a. Ensuring a good electrostatic control. Due to the preponderance of the short channel effects, new architectures have been adopted since the 32 nm node as alternatives to the Si-bulk MOSFET: the FinFET (Fin Field Effect Transistor) [Hisamoto_1998] and the FDSOI (Fully Depleted Silicon On Insulator) [Colinge_1989]. While the FinFET is a 3D device, the FDSOI remains a planar architecture. In both cases, the channel is no more doped with the complementary polarity of the transistor (P for NMOS and N for PMOS) but remains intrinsic. Even if the FinFET is mentioned in the following since it represents the leading candidate for advanced nodes, FDSOI transistor is more extensively described and has been used as elementary device in this thesis work due to its interest increase. FinFET First introduced in mass production by Intel at the 22 nm node, this architecture is now widely used by most of the foundries; TSMC for its 16 nm and Samsung and Global Foundries for their 14nm. More recently a second generation of industrial FinFET was presented for the 14nm node of Intel [Natarajan_2014]. Being non-planar, the FinFET of Figure I-11 is represented in 3D in order to grasp the main features of this architecture. As one can notice that the operative part of the semiconductor (the source, the channel and the drain) has a high aspect ratio and is called fin. One transistor is composed of several fins with common source, drain and gate in order to ensure a high ON-state current. The channels are separated the one from another by a buried oxide. The main advantage of this architecture is that the gate follows the topography of the fin. While in planar architecture only the top surface of the channel is perfectly controlled by the gate, in FinFET presenting thin fin almost all the channel is in the vicinity of the gate oxide and thus the whole fin is well controlled.. 32. © 2017 Tous droits réservés.. lilliad.univ-lille.fr.
(33) Thèse de Julien Borrel, Lille 1, 2017. Chapter I MOSFETs miniaturization: expectations and limits. Figure I-11: 3D scheme of a FinFET and the corresponding cross sections A-A’ and B-B’ from [Natarajan_2014] (the scale are not precise in the original publication). FDSOI This architecture has been mainly developed in the STMicroelectronics/CEA-LETI ecosystem during the past decade but begins to attract attention because of its relative simplicity compared to FinFET [Gwennap_2016]. Indeed, being planar, this architecture is more similar to the conventional bulk MOSFET than the FinFET. More recently, Global Foundries has announced the launch of a 22 nm node on a FDSOI platform. The main characteristic of this architecture leans on the introduction of Silicon On Insulator (SOI) substrate which features a thin silicon top layer on top of a Buried Oxide (BOX). For ultra-thin SOI the channel is fully depleted and the transistor is called Fully Depleted Silicon On Insulator (FDSOI). The principle of this architecture is similar than that of the FinFET: since it is ultra-thin (less than 10 nm), the whole depth of the channel is effectively controlled by the gate. However, FDSOI presents its own advantages and drawbacks. As shown in Figure I-12, the active zone is separate from the bulk substrate by the BOX thus avoiding one of the leakage current contribution. Moreover, this BOX can be used as a back gate. Even without back biasing the device, integrating a ground plane under the BOX with a doping specie opposed to the source and drain allow to increase the threshold voltage [Fenouillet_2009]. Thus using different ground planes on the same chip allows to implement multi Vt technology [Weber_2010]. In addition, a bias can be applied on this back gate and also modifies the threshold voltage of the devices.. 33. © 2017 Tous droits réservés.. lilliad.univ-lille.fr.
(34) Thèse de Julien Borrel, Lille 1, 2017. Figure I-12: 3D scheme of a FDSOI and the corresponding B-B’ cross section from [Planes_2012]. I.2.3.b. Parasitic contributions in new architectures. As presented previously in Equation (I-20), an increase in both parasitic capacitances and resistances would lead to an inverter delay increase and by extrapolation to a degradation of the circuits performance. Therefore, in order to maintain device performance for reduced MOSFET dimensions, key technology and design enablers have to be identified. Trying to analyze the evolution of the market and to plan and control the technological needs of IC production, the International Technology Roadmap for Semiconductors (ITRS) has been periodically released over the past 20 years. In the issue of 2013 [ITRS_2013], the problematic of contact resistivity reduction was discussed and the target of 10−9 Ω cm² was mentioned as a key objective for next nodes device performance. In this work, the parasitic contribution of the contact resistance is addressed. The two next sections are entirely dedicated to introducing the theory of an ideal contact as well as presenting phenomena occurring at real metal/semiconductor junctions. Finally, the state-of-the-art associated to the non-alloyed contact engineering is presented which represents the core of this thesis work.. 34. © 2017 Tous droits réservés.. lilliad.univ-lille.fr.
(35) Thèse de Julien Borrel, Lille 1, 2017. Chapter I MOSFETs miniaturization: expectations and limits. I.3 Ideal contact theory In this section, the different contributions of the contact resistivity are presented for the more intuitive case of an n-type semiconductor.. When a metal and an n-type semiconductor are brought together, a transfer of electrons occurs at the interface in order to reach an electrostatic equilibrium. The direction and the magnitude of the electron flow is determined by the difference between the metal work function (Φm) and that of the semiconductor (Φsc). One can distinguish two cases as explained in Figure I-13: -. If Φm > Φsc , the electrons flow from the semiconductor into the metal. This regime is called “depletion” since it induces a reduction of the density of carriers at the semiconductor surface. This flow of electrons generates a negative charge at the metal surface, counterbalanced by a positive charge in the semiconductor due to the presence of non-compensated ionized donor impurities.. -. If Φsc > Φm , the electrons flow from the metal into the semiconductor. This regime is called “accumulation” since an excess of carrier is observed in the semiconductor. Therefore a negative charge (respectively positive) appears in the semiconductor (respectively in the metal).. In both cases, the zone of the semiconductor where the state of charge is different from a stand-alone semiconductor is referred to as Space Charge Region (hereinafter noted SCR). According to Gauss law these charges induce an electric potential and thus a built-in electric field which counters the electrons flow leading to an equilibrium. The two regimes are represented in Figure I-13 (b) and (c).. 35. © 2017 Tous droits réservés.. lilliad.univ-lille.fr.
(36) Thèse de Julien Borrel, Lille 1, 2017. Figure I-13: (a) Reference case. (b) Depletion and (c) accumulation regime equilibria occurring when bringing a metal in contact with a n-type semiconductor. The surface charge modification and the induced electric potential generation have a strong impact on the electrostatic landscape of the semiconductor and thus on its energy band edge diagram. As presented in Figure I-14 (a) and (b), a bending of the energy band whose magnitude and sense depend on the difference between the metal and the semiconductor workfunctions appears in the SCR. In this figure, EC, EV and EF respectively refer to the conduction and the valence bands of energy and the Fermi level. The bending occurring in the SCR has a significant impact on the way the contact reacts to an electric bias; thus the cases Φm > Φsc and Φsc > Φm have antipodal behaviors. As one can notice in Figure I-14 (c) and (d) which both represent the case of Φm > Φsc, when biasing the semiconductor the electrons have to go through the energetic barrier induced by the bending of the band diagram. While this barrier is always impeding the current when applying a negative bias on the metal, it can be overcome when applying a positive one. The contact response to an external electric bias is thus strongly asymmetric and one can define a reverse and a forward bias. This type of contact is often found highly resistive and is called Schottky.. 36. © 2017 Tous droits réservés.. lilliad.univ-lille.fr.
(37) Thèse de Julien Borrel, Lille 1, 2017. Chapter I MOSFETs miniaturization: expectations and limits. Figure I-14: Simplified band diagram of a metal/n-type semiconductor contact in (a) depletion and (b) accumulation regimes ; (c) and (d) represent the Φm > Φsc case under respectively a negative and a positive bias.. On the contrary, in the case of Φsc > Φm the electrons do not encounter any barrier whatever the bias is. Therefore the contact response to an external electric bias is linear and symmetrical. This type of contact is often found highly conductive and is called Ohmic. The typical shape of the current density as a function of the applied bias is represented for both types of contacts in Figure I-15 by only considering the thermionic theory. Even being simplified, this theory gives a first glimpse at the contact I-V characteristic asymmetric behavior by only considering the electrons flowing above the barrier but not through it (for detailed theory see Chapter II).. 37. © 2017 Tous droits réservés.. lilliad.univ-lille.fr.
(38) Thèse de Julien Borrel, Lille 1, 2017. Figure I-15: Schematic of the current density as function of the contact bias for (left) Schottky and (right) Ohmic contacts when considering thermionic emission.. The height of the barrier induced by the band bending at the metal/semiconductor interface, called Schottky Barrier Height (SBH), is thus one of the major parameters to consider when trying to optimize a contact. Being noted ef in the following, one can determine this SBH from the simplified band. diagram of Figure I-14 and obtain Equation (I-25).. ef = e0 − e L. (I-25). Proposed by Schottky [Schottky_1940], this theory implies that the electrical behavior of a contact can be totally tuned by choosing a metal with an adapted workfunction when trying to connect a given semiconductor. Following this theory, a high work-function metal would induce a large Schottky barrier on n-type semiconductor whereas a low work-function metal would lead to a small one. A similar reasoning can be applied to a p-type semiconductor although the majority carriers to consider are holes. In this case, an Ohmic contact is obtained if the workfunction is high compared to the valence band of the semiconductor i.e. Φm > Φsc + Eg while a Schottky one results from implementing a contact with a low workfunction metal i.e. Φm < Φsc + Eg.. Figure I-16 represents the gap of common semiconductors as well as the workfunction of several common metals. Following Schottky’s ideal theory, implementing ohmic contacts should be easily addressed by selecting adapted metal workfunctions. 38. © 2017 Tous droits réservés.. lilliad.univ-lille.fr.
(39) Thèse de Julien Borrel, Lille 1, 2017. 3.6. 3.6. 3.8. 3.8. 4.0. 4.0. 4.2. 4.2. 4.4. 4.4. 4.6. 4.6. 4.8. 4.8. 5.0. 5.0. 5.2. 5.2. 5.4. 5.4. 5.6. 5.6. 5.8. 5.8. Metal Ideal Workfunctions (eV). Semiconductor Gap (eV). Chapter I MOSFETs miniaturization: expectations and limits. 6.0. 6.0. Si. Ge. GaAs. InAs. InP. Common Semiconductors. Pb Ti. Al Zn Sn Ag Cr Cu Pd Ni Au Pt. Common Metals. Figure I-16: Various metallizations and their corresponding ideal metal workfunction [Kulwicky_1991]. I.4 Real contact case In a real metal/semiconductor contact, such a simplified theory cannot be considered. The band diagram as presented in Figure I-14 is actually strongly modified by energetic states generated at the interface.. I.4.1. Interface states. A metal/semiconductor junction being far from ideal, parasitic electrostatic defects distributed within the forbidden gap of the semiconductor appear at the interface. Several interface states origins have been proposed during the last forty years but no real consensus has been reached so far. As proposed by Rowe in 1975 [Rowe_1975], the two main interface defects are Default-Induced Gap States also called intrinsic interface states (noted DIGS in the following) and Metal-Induced Gap States also called extrinsic interface states (noted MIGS in the following).. I.4.1.a. Default-Induced Gap States. The evaluation of the properties of a semiconductor (e.g. its electronic affinity and forbidden gap of energy) often relies on considering a perfect crystal with an infinite lattice. When considering the surface of a semiconductor or its interface with another material this assumption is no longer true. 39. © 2017 Tous droits réservés.. lilliad.univ-lille.fr.
(40) Thèse de Julien Borrel, Lille 1, 2017. Therefore, the properties found for a bulk material cannot be applied in such a case. As presented in Figure I-17, all those surface imperfections, dangling bonds and foreign adatoms induce symmetry and periodicity breakings in the crystal. These defaults thus induce states of energy which are not taken in account in the bulk semiconductor theory. Those additional states can have their energy level in the forbidden gap of the semiconductor and are referred to as Default-Induced Gap States [Bardeen_1947].. Figure I-17: DIGS and MIGS representations. Therefore these states can be observed on a bare semiconductor surface and their density should be modified by other materials deposition. Nevertheless, the induced modification mechanism is not clear and depends on the considered surface. According to Rowe [Rowe_1975], DIGS of a Ge(111) and Ge(100) are totally removed by metallization induced chemical bondings while DIGS of an Ge(110) seem to be insensitive to the metal overlayers.. I.4.1.b. Metal-Induced Gap States. In order to explain the interface states origin at a Metal/Semiconductor (MS) interface without considering only defects, Hein proposed in 1965 a new theory based on the wave mechanics [Hein_1965]. The electrons in the metal can be considered as free and described by plane waves. When the metal is deposited on a semiconductor, these plane waves can penetrate in the conduction and valence bands as Bloch waves but also in the forbidden gap of energy. As shown in Figure I-17, in this range of energy, the plane waves can only penetrate by tunneling and act as evanescent waves. Therefore, they 40. © 2017 Tous droits réservés.. lilliad.univ-lille.fr.
(41) Thèse de Julien Borrel, Lille 1, 2017. Chapter I MOSFETs miniaturization: expectations and limits only have significant amplitude in a few atomic layers from the interface (≈ 8 Å [Hein_1965], ≈ 3 Å. [Tersoff_1984]). Additional states are thus generated only on several atomic layers and form a continuum of states in the band gap. They are called the Metal-Induced Gap States. According to Rowe, MIGSs should be the major source of gap states after a metallization since the major part of intrinsic states have been removed by chemical bonding [Rowe_1975].. I.4.2. Fermi Level Pinning. In this section, the notion of effective metal workfunction is introduced but a more detailed theoretical presentation of the energy band diagram calculation and its modification due to parasitic surface states is given in Chapter II. Due to the presence of these interface states, the ideal model of M-S contacts is no longer relevant to describe real interfaces and SBHs are in practice found different from the theoretical predictions. Interestingly these effective SBHs are nearly independent from the metal workfunctions and are pinned around a given value depending on the considered semiconductor [Bardeen_1947]. This phenomenon is referred to as Fermi Level Pinning (noted FLP).. In 1947, Bardeen calculated that an interface states density j 2 = 10Ak lm. H. $. A. leads to a total. pinning of the Fermi Level [Bardeen_1947]. At that time, such a density of interface states was quite common and DIGS seemed to be a good explanation for FLP. However, nowadays the interface quality having improved, interface states densities about 10A lm. H. $. A. are reached but the M-S contacts still. present FLP. Thus DIGS theory is not sufficient to predict a high density of interface states. On the other hand, a study carried out by Hasegawa et al. [Hasegawa_1999] shows that the SBH depends also on the. metal deposition conditions which cannot be explained by the MIGS model.. In practice in order to maintain the formalism of Schottky’s theory, the effective SBH is often translated into an effective metal workfunction as shown in Equation (I-26). ef. ). = e0 − e L ). (I-26). The FLP is thus represented by the effective behavior of the metals when contacted to the semiconductor. As presented for the case of Si in Figure I-18, the actual control of the effective metal workfunction can be far from expected. Instead of having the possibility to control workfunction between 41. © 2017 Tous droits réservés.. lilliad.univ-lille.fr.
(42) Thèse de Julien Borrel, Lille 1, 2017. 3 and 6 eV, the effective metal workfunction appear to be pinned around 4.7 eV, i.e. a midgap value, with only small variations around this point [Nishimura_2008].. Figure I-18: Effective metal workfunction as a function of their ideal values for common metals when contacted to Si (adapted from [Nishimura_2008]).. Considering the energies of the conduction and valence bands of Si to be respectively 4.05 and 5.17 eV, contacts made on n- or p-Si in practice result in non-ohmic highly resistive junctions. Similarly, still in Figure I-18, the effective metal workfunctions on Ge are found to be really close to its valence band. Thus contacts to p-type and n-type Ge respectively result in ohmic and Schottky junctions.. I.5 Contact resistivity optimization The FLP thus represents one of the major stumble blocks for future CMOS scaling since it prevents from reducing the contact resistivity and then leads to an increase of the contact resistance when reducing its area.. 42. © 2017 Tous droits réservés.. lilliad.univ-lille.fr.
(43) Thèse de Julien Borrel, Lille 1, 2017. Chapter I MOSFETs miniaturization: expectations and limits In order to tackle this issue, two paradigms are conceivable. Indeed, a rough approximation of the. contact resistivity ML is given by Equation (I-27) with n and ML two constants experimentally determined. and N the doping concentration.. vww. rstu. ML = ML exp [. √R. ]. (I-27). Then reducing the contact resistivity can be achieved by decreasing the effective SBH of the junction or by increasing the doping concentration.. I.5.1. Space charge region width reduction. When considering the transport theory in a contact, the simple model of thermionic emission (electron passing above the barrier) is not fully adequate since it does not encompass the quantum tunneling probability across the barrier. To do so, one has to involve Field and Thermionic Field Emissions (resp. FE and TFE) which are fully described in Chapter II. Basically, these theories, based on quantum tunnelling probability, assert that for sufficiently thin space charge region the major contribution to the transport is due to the electron tunneling through the barrier [Padovani_1966].. Referring to the space charge region width as D?yz , Equation (I-28) gives its dependence on ef. ). and the doping concentration.. D?yz. ={. 2|. e × f j ). (I-28). Where | is the dielectric constant (or relative permittivity) of the semiconductor and q is the elementary. charge of the electron.. Increasing the doping concentration could thus lead to reducing the width of the space charge region while keeping the SBH constant. Nevertheless, reducing the contact resistivity using this approach requires to reach an ultra-high doping level at the interface. In some cases in order to ensure good transport properties despite a high SBH, the doping concentration has to reach values around its solubility limit in the considered semiconductor. Even being theoretically predicted, the solubility limit remains in practice difficult to achieve using conventional annealing processes and the actual electrically active dopant concentrations are lower than this value. For example, considering a midgap FLP in Si and thus a SBH about 0.55 eV and assuming an electrically active Arsenic concentration limit of 2 × 10H cm. k. 43. © 2017 Tous droits réservés.. lilliad.univ-lille.fr.
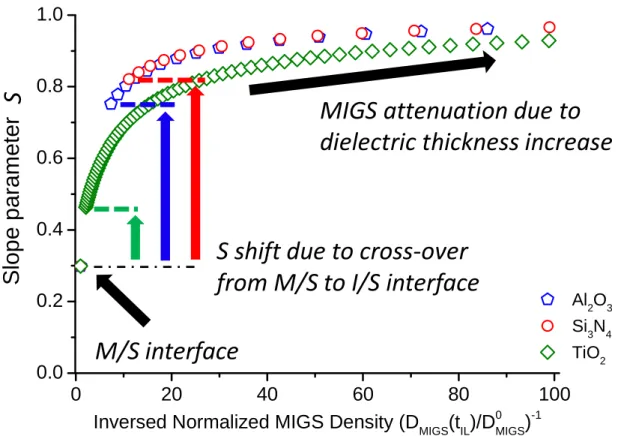
(44) Thèse de Julien Borrel, Lille 1, 2017. [Thompson_1998], ML is limited to about 1 × 10 • Ω. cmH , so that reaching the ITRS target is not. achievable.. However, metastable configurations where the electrically active dopant concentration is close to the solubility limit can be obtained at ultra-high temperature using pulsed laser annealing [Plummer_2001]. Being metastable, the obtained system is very sensible to subsequent annealing steps such as silicide formation. Thus allowing a 2D uniform surface annealing, the pulsed laser would also be used to form the silicide since it is expected to provide locally higher temperatures without damaging the underlying layers [Huet_2014]. Recently, combining dopant activation by pulsed laser annealing with Ge amorphization of the source and drain prior to the silicidation, the record-low ρc of 1.5x10⁻⁹ Ω.cm² was reported [Yu_2015].. I.5.2. Effective SBH reduction via FLP mitigation. Recently, it was shown that a counter-intuitive approach aiming at reducing the FLP could consist in inserting a thin dielectrics at the interface between the metal and the semiconductor [Connelly_2004].. I.5.2.a. MIS Contacts. The actual resistance of such contacts, called MIS (Metal/Insulator/Semiconductor), arises from a tradeoff between the SBH reduction through FLP mitigation and the tunnel resistance induced by the insertion itself. The former, i.e. reducing the FLP, is still not well understood. Nevertheless, several mechanisms have been proposed to explain this effect and all seem to point out an interface states density decrease. In the following, the MIGS reduction model is mainly discussed and is extensively described in Chapter II. As presented in Figure I-19 (a), according to this model the insertion acts as an additional barrier which the plane waves of the metal have to cross in order to penetrate the semiconductor. Therefore, the density of metal plane waves actually going across the entire dielectric and penetrating the semiconductor forbidden gap of energy is lower than for a direct contact on semiconductor i.e. the density of MIGS is reduced [Connelly_2004]. Intuitively, the propensity of the insertion to screen the plane waves from the metal is linked to its thickness. The thicker the insertion, the lower the density of MIGS is. Moreover, for a given dielectric thickness, the attenuation of the MIGS density is proportional to the Band Gap of Energy (BGE) of the insertion. Nevertheless, as presented in Figure I-19, as the insertion acts as a barrier for the parasitic plane waves responsible for the MIGS, it also acts as a barrier for the electrons responsible for current 44. © 2017 Tous droits réservés.. lilliad.univ-lille.fr.
(45) Thèse de Julien Borrel, Lille 1, 2017. Chapter I MOSFETs miniaturization: expectations and limits conduction. For a given insertion thickness, the induced tunnel resistance for electrons (resp. holes) is related to the offset between the conduction (resp. valence) band of the dielectrics and that of the semiconductor. These parameters, presented in Figure I-20, are referred to as Conduction and Valence Band Offsets (noted CBO and VBO) and roughly speaking the higher they are, the higher the tunnel resistance per unit length is.. Figure I-19: (a) The band diagram shows that gap states face a larger minimum barrier than do free carrier states, and thus are more rapidly attenuated, allowing free carriers to tunnel while blocking the MIGS. (b) The optimum insulator thickness is where the gap states are effectively blocked while free carrier tunneling is still sufficient [Connelly_2004].. Finally, the total resistance is thus due to the tradeoff between those two contributions. As presented in Figure I-19 (b), the resistance as a function of the insertion thickness is a typical U-shape curve and the optimum thickness is obtained by finding the best compromise between the FLP mitigation and the induced tunnel resistance.. 45. © 2017 Tous droits réservés.. lilliad.univ-lille.fr.
(46) Thèse de Julien Borrel, Lille 1, 2017. Figure I-20: MIS contact simplified band diagram illustrating the notions of Conduction and Valence band offsets respectively relevant when addressing nand p-type semiconductors.. I.5.2.b. State-of-the-art. Since 2004, many materials and deposition approaches have been reported. A summary of experimentally demonstrated MIS insertions is presented in Table I-2. Table I-2: Experimental work on MIS structure. The dielectrics in blue present a low band offset compared to the semiconductor.. Semiconductor Si. Ge. GeSn GaAs InGaAs GaSb MoS2. Interface Layer Si3N4 TiO2 LaOx; TiOx; ZrOx Ge3N4 GeOx; AlOx SiN MgO Al2O3; TiO2 ZnO TiO2 TiO2/n+Si GeSnOx SiN Al2O3 Al2O3 TiO2 Ta2O5. References Connelly_2004; Connelly_2006 Agrawal_2014 Majumdar_2014 Lieten_2008 Nishimura_2008 Kobayashi_2009 Lee_2010; Zhou_2010 Lin_2011; Lin_2012 Manik_2012 Tsui_2013 Menghini_2016 Chen_2016 Hu_2008 ; Hu_2009 Hu_2010 ; Hu_2011’’ Hu_2010 Yuan_2011 Lee_2016. 46. © 2017 Tous droits réservés.. lilliad.univ-lille.fr.
Figure
![Figure I-10: Access resistance as a function of the Contact Poly Pitch singling out the contribution of the contact resistance [Hutin_2014]](https://thumb-eu.123doks.com/thumbv2/123doknet/3697123.109813/31.892.193.679.686.1036/figure-access-resistance-function-contact-singling-contribution-resistance.webp)
![Figure I-11: 3D scheme of a FinFET and the corresponding cross sections A-A’ and B-B’ from [Natarajan_2014] (the scale are not precise in the original publication)](https://thumb-eu.123doks.com/thumbv2/123doknet/3697123.109813/33.892.110.784.156.414/figure-finfet-corresponding-sections-natarajan-precise-original-publication.webp)

+7


Documents relatifs
It is expected that the difference between a classical model and crystal plasticity can be still larger if two rough surfaces are considered instead, since the way
Increasing the contact force from 0.8 kN to 1.6 kN results in an increase in the spot size fractal dimension, D, which indicates that the spot number is increasing at a faster rate
In the relatively simple model developed in the present paper, two scalar equations (expressing the continuity of the stress distribution at the contact zone boundary and
Abstract—This article presents an optimization study aiming at decreasing the Dark Count Rate (DCR) of Single Photon Avalanche Diodes implemented in CMOS Fully Depleted
Our hypothesis is that speakers whose L1 has prosodic marking of every content word by stress or tone will also tend to segment the speech flow in French according to lexical
• In this section, we proved conservation energy of the discretized contact elastodynamic problem using an appropriate scheme and a choice of con- tact condition in terms of
Results obtained during three nights in March 2017 in Skibotn, Norway, indicate that the auroral blue line is polarised with a degree of linear polarisation of a few %.. Due to
According to our results, we can conclude that the effect of the contact diameter is remarkable on the Schottky electrical characteris- tics, while the contacts of small
