Technology researchers and makes it freely available over the web where possible.
This is an author-deposited version published in: https://sam.ensam.eu Handle ID: .http://hdl.handle.net/10985/21499
To cite this version :
J.P. GOULMY, P. KANOUTE, E. ROUHAUD, L. TOUALBI, S. KRUCH, V. BOYER, J.
BADREDDINE, D. RETRAINT - A calibration procedure for the assessment of work hardening Part II: Application to shot peened IN718 parts - Materials Characterization - Vol. 175, p.111068 - 2021
Any correspondence concerning this service should be sent to the repository Administrator : [email protected]
A calibration procedure for the assessment of work hardening Part II: Application to shot peened IN718 parts
J.P. Goulmy, P. Kanoute, E. Rouhaud, L. Toualbi, S. Kruch, V.
Boyer, J. Badreddine, D. Retraint
PII: S1044-5803(21)00198-4
DOI:
https://doi.org/10.1016/j.matchar.2021.111068Reference: MTL 111068
To appear in:
Materials CharacterizationReceived date: 26 November 2020
Revised date: 19 March 2021 Accepted date: 25 March 2021
Please cite this article as: J.P. Goulmy, P. Kanoute, E. Rouhaud, et al., A calibration procedure for the assessment of work hardening Part II: Application to shot peened IN718 parts,
Materials Characterization(2021),
https://doi.org/10.1016/j.matchar.2021.111068This is a PDF file of an article that has undergone enhancements after acceptance, such as the addition of a cover page and metadata, and formatting for readability, but it is not yet the definitive version of record. This version will undergo additional copyediting, typesetting and review before it is published in its final form, but we are providing this version to give early visibility of the article. Please note that, during the production process, errors may be discovered which could affect the content, and all legal disclaimers that apply to the journal pertain.
© 2021 Elsevier Inc. All rights reserved.
1
A calibration procedure for the assessment of work hardening Part II: Application to shot peened IN718 parts.
J.P. Goulmy1, P. Kanoute2, E. Rouhaud3, L. Toualbi2, S. Kruch2, V. Boyer3, J. Badreddine4, D. Retraint3
1Arts et Metiers Institute of Technology, MSMP, HESAM Université, F-13617 Aix-en-Provence, France
2 Onera - The French Aerospace Lab, Département Matériaux et Structures, F-92322 Châtillon, France
3 Laboratoire des Systèmes Mécaniques et d’Ingénierie Simultanée (LASMIS), Institut Charles Delaunay (ICD), Université de Technologie de Troyes (UTT), 10000 Troyes, France
4 Safran Tech, Materials & Processes department, Rue des Jeunes Bois, 78772 Magny-Les-Hameaux, France
Corresponding author : [email protected] (J.P. Goulmy) (+33) 4 42 93 82 23
Abstract
The objective of this paper is to discuss the application of the calibration methodology exposed in the previous part to shot-peened Inconel 718 specimens. Shot peening is commonly used to increase the fatigue life of critical parts such as Inconel 718 turbine discs. This surface treatment induces residual stresses, work hardening and possibly, gradients of microstructures that, in turn, affect fatigue life.
Work hardening is a quantity that represents a set of physical and mechanical phenomena related to the level of disorder reached in the microstructure of the material. Work hardening is seldom taken into account in fatigue life assessment mainly because it is not possible to characterize this quantity directly. We propose to use the calibration methodology (see part I of this paper [1]) on samples shot peened with several conditions. The three complementary experimental techniques (microhardness, XRD and EBSD) are then used to determine through correlation curves the work hardening gradients.
The methodology for characterizing the work hardening within shot peened specimens is first pre- sented. A discussion of the applicability of the method in this context is then provided. The results obtained for the different characterization methods and microstructural effects are analyzed in two different sections. Finally, the influence of shot peening conditions on residual stresses and on work hardening is discussed, showing the interest of the proposed procedure to obtain a real picture of the mechanical state after shot peening.
Keywords: Inconel 718; shot peening; work hardening; residual stresses; XRD
Journal Pre-proof
2
1 Introduction
Surface enhancement methods, such as shot peening, are widely used in the aerospace or automotive industry to improve the fatigue life of critical components like turbine disk, turbine blade or connecting rod. These processes are the object of important research and development in order to optimize process conditions with the general objective of increasing the security of the structures while reducing their weight and cost [2].
In order to accurately assess the fatigue life, the knowledge of all the mechanical fields related to the loading history applied to the material during the shot peening process is of primary importance [3].
These surface treatments generate compressive residual stresses near the surface of the component that tend to delay fatigue crack initiation and prevent their propagation [4], [5]. However, the residual stresses are not the only quantity that influences the fatigue life. The level of work hardening generated during the process can also have a significant impact [6]. Prevey observed that the evolution of the mechanical fields during thermo-mechanical cyclic loadings, in particular the relaxation of the stress state, is strongly influenced by the initial work hardening level. For the same amount of residual stresses observed locally, the level of work hardening may also significantly vary.
Shot peening is thus a complex mechanical treatment that induces residual stress, strain gradients, and high plastic deformation values. To understand the impact of this process on fatigue life, it is crucial to understand the influence of work hardening and therefore be able to quantify this phenomenon.
Many authors have proposed methodologies to evaluate work hardening from calibration methods [7]–[10]. However, the few studies carried out in the literature to determine the work hardening induced by shot peening have shown limitations in the application of these methodologies based on the exploitation of XRD, EBSD and microhardness characterization techniques [7], [11]–[13]. Shot peening is a mechanical treatment consisting of repeated high speed impacts on the surface of the treated part [14]. This generates an important strain rate gradient on the subsurface of the material,
Journal Pre-proof
3
gradient that depends on time and process conditions. Numerical simulations have demonstrated that, during shot-peening, the value of the local strain rate varies from 10-3 up to 104 s-1 [15]. Thus, several questions remain open: how, in particular, these strain rate variations affect the work hardening evaluation? Moreover, microstructural variations may be observed following the application of the process [16]–[18]. It could be of interest to assess the influence of the microstructure on the work hardening induced by shot peening in order to understand the possible consequences on the fatigue life. Few results are available in the literature on the quantification of work hardening after shot peening but none discuss the effects of the microstructure.
In Part I [1], it was shown that XRD, EBSD and microhardness are sensitive to the microstructure and work hardening state. For each technique and considered microstructure, a calibration curve has been proposed. The objective of this paper is to apply these three techniques on shot peened specimens and compare their ability to evaluate shot peening induced work hardening. By mean of the calibration methodology adopted in part I, it is now possible to take into account the microstructure effect. The study of three microstructures aim to taking into account different microstructural states for a given alloy, here IN718. These microstructural changes can result in size changes of grains and/or precipitates. Therefore, three microstructures were considered in order to account for grain and precipitate size coarsening. Both “coarse grain” and “coarse grain and precipitate” microstructures were derived from the Direct Aged state, using specific heat treatments.
In this paper, we first present the material, the shot-peening conditions and the characterization procedures used on the shot-peened samples. Then, in the following parts, the results are presented and discussed. We first verify the fact that the calibration procedure is relevant to evaluate work hardening in shot peened samples. For this purpose, the shot peened samples are characterized using all three characterization techniques (XRD, microhardness and EBSD) and precautions and hypotheses for the application of the calibration method on shot peened samples are discussed. A focus is made on aspects rarely discussed in the literature: influence of shot peening on grain size and crystal orientation and effect of strain rate on work hardening profiles. In the second part, results
Journal Pre-proof
4
obtained for the different characterization methods are analyzed. Then, the effects of the microstructures on work hardening profiles following shot peening are discussed. Finally, the influence of shot peening conditions on residual stresses and on work hardening is discussed, showing the interest of the proposed procedure to obtain a realistic picture of the mechanical state after shot peening.
2 Materials and methods
2.1 Material and shot peening conditions
The shot peened samples investigated in this study have been extracted from a turbine disk constituted of a Direct Aged Inconel 718 (DA). The initial microstructure has been modified such that three microstructures of this alloy have been investigated. Details concerning the heat treatments that have been applied to obtain these microstructures and their characterization in the un-shot peened state are given in the part I of the present work [1]. The first microstructure is the reference microstructure (mean grain size around 4.2 µm and strengthening precipitates with a size of about 20 nm) obtained directly after forging and corresponding to the “as-received” material. The second microstructure is a coarse grain microstructure (mean grain size of about 35 µm and strengthening precipitates about 20 nm in size). The third microstructure includes coarse grains and coarse strengthening precipitates (mean grain size approximatively equal to 35 µm and strengthening precipitates of about 200 nm).
The samples that have been shot peened are parallelepipedic with a size of 20x15x10 mm. Before shot peening, all samples have been mechanically polished to a mirror polished surface to remove as much as possible residual stresses and work hardening induced by machining. XRD measurements have been carried out to verify that the samples were free of residual stresses (Figure 10).
The samples have been shot peened on one of the largest surfaces (see Figure 1) using a conventional shot peening nozzle and S110 steel shot. Three shot peening conditions (SP) were applied on
Journal Pre-proof
5
different samples. The used shot peening conditions were chosen for two reasons. They are commonly applied on industrial components and they induce very different gradients of residual stresses and work hardening. The latter is essential for validating the proposed methodology.
The shot peening parameters are gathered in Table 2 following the NFL 06-832 AFNOR norm [14].
In the shot peening process, the number of runs of the shot peening nozzle defines the exposure time, that itself defines the coverage, corresponding to [14]. The choice was made here to adapt the number of runs of the nozzle in order to obtain the same coverage for the samples composed of the three microstructures and for a given shot peening condition. A protocol with respect to the coverage had to be defined because, for a given shot peening condition, the impacts observed on the two coarse grain microstructures are bigger than the ones observed on the DA microstructure. This is confirmed by the values of microhardness (for zero plastic strain) reported in Figure 4 part I of this article for the three microstructures. Also, it has been observed that the yield strength of coarse grain microstructures is lower than the one of the DA microstructure: RP0.2 values at 20°C: 1300 MPa for DA microstructure, 1200 MPa for coarse grain microstructure and 1120 MPa for coarse grain and coarse strengthening precipitate microstructure; this is visible in the stress-strain curves presented in Part I.
The number of runs applied to these microstructures is thus more important to ensure the same coverage as the one observed on the DA microstructure. For example, 38 runs were necessary to achieve 125% coverage with SP1 shot peening condition in the case of the DA microstructure, whereas 32 runs were necessary for microstructures with coarse grains. The number of runs applied to each microstructure are presented in Table 1. To evaluate the influence of this choice, a third shot peening condition (SP3) has also been completed, for which the same number of runs has been applied on the three microstructures. This last treatment leads to a 175% coverage for the DA microstructure and a 200% coverage for the two coarse grain microstructures.
Journal Pre-proof
6
Name Microstructure Almen
Intensity Coverage Number of runs of shot peening SP1
DA 12-13A 125% 38
Coarse grain 12-13A 125% 32
Coarse grain and coarse strengthening precipitates 12-13A 125% 32 SP2
DA 22-23A 200% 24
Coarse grain 22-23A 200% 20
Coarse grain and coarse strengthening precipitates 22-23A 200% 20 SP3
DA 22-23A 167% 20
Coarse grain 22-23A 200% 20
Coarse grain and coarse strengthening precipitates 22-23A 200% 20 Table 1. Shot peening conditions applied to the different microstructures.
2.2 Experimental protocol for the shot peened samples
After shot peening, the samples have been analyzed using EBSD, XRD and microhardness. All measurements were taken at several locations to ensure the uniformity of the surface treatment. The measurement procedures were similar with the one previously described in the part I of this work [1].
However, due to the presence of gradient in the shot peened samples, additional surface preparations have been necessary to establish the in-depth quantities of interest.
The in-depth evolution of the full width at half maximum (FWHM) of the peaks and the residual stresses have been evaluated with XRD. The classical sin²ψ approach has been used and eleven ψ angles have been analyzed to determine line broadening depth profiles defined by the FWHM of a Pseudo Voigt profile fit. In order to be able to evaluate the quantities of interest in the depth, an electrolytic polishing, allowing material removal, was carried out with an average step of 40 µm. The material removal was controlled using a coordinate measuring machine. A correction procedure has been settled and showed that the material removal had a negligible impact on the residual stress measurements. Residual stresses and peak widths have been measured in two directions. However, no significant differences were revealed, confirming that shot peening introduces an equi-biaxial stress state in plane. The in-depth evolution of the FWHM has also been evaluated before shot peening and a constant value of the FWHM has been observed for all the untreated samples, as illustrated in Figure 10.
To obtain the microhardness profile, the samples were cut in half in the center. All cross-sections have
Journal Pre-proof
7
then been prepared by mechanical polishing up to 1 μm with diamond paste followed by colloidal silica in order to achieve flat mirror polished surfaces free of damage. Ten microhardness measurements (HV0.1) per depth were then performed, providing a mean hardness value and a standard deviation for each depth. Each measuring line is about 20 µm apart, leading to a profile with about ten values in the depth.
EBSD analyses were performed to evaluate if the applied shot peening conditions induce a change in grain size and crystalline orientation. For this purpose, pole figures were performed and the grain size distribution was plotted. The results are specifically discussed in section 2.3. The in-depth KAM parameter profiles were also established. To obtain this quantity, EBSD maps were analyzed by calculating the average of the KAM values at a given depth (KAMi). The KAM values obtained in the depth are thus spaced by one pixel, i.e. 0.5 µm.
2.3 Application of the calibration procedure on shot peened samples
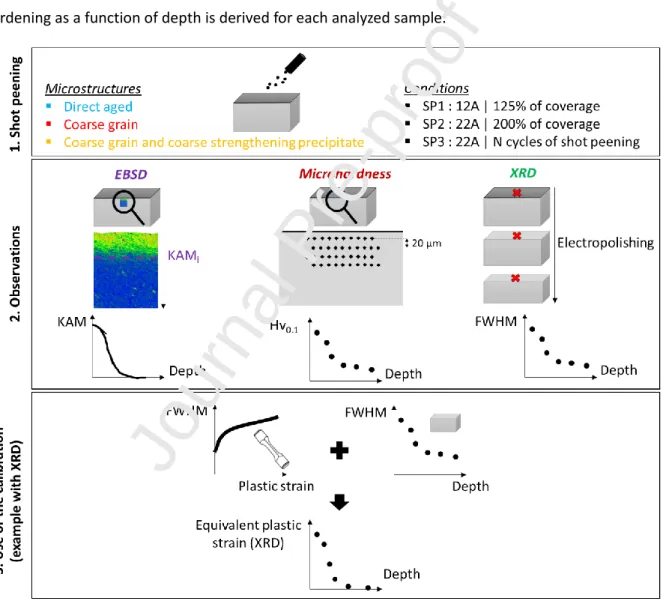
The calibration procedure proposed in the part I of this work is applied to shot peened samples to correlate the level of work hardening with three experimental parameters: microhardness, FWHM determined from XRD measurements and KAM calculated from EBSD maps. The different steps of this analysis are presented in Figure 1.
The interest of this study is that the procedure is applied for each shot peening condition and in depth for each sample: the evolutions of the microhardness, FWHM and KAM are determined. This is illustrated in the second box of Figure 1.
In Part I, a calibration curve has been established for each experimental technique. Calibration functions have been deduced, that correlate the experimental parameter to the equivalent plastic strain. The equivalent plastic strain:
𝜀𝑝= √2
3𝜺𝒑: 𝜺𝒑 ,
where 𝜺𝒑 is the plastic deformation tensor, has been chosen to represent the work hardening state.
The details concerning the determination of the calibration functions and the fitting of the
Journal Pre-proof
8 parameters are given in the part I of the present work.
As illustrated in the third box of Figure 1, it is then possible to use these calibration curves reversely to determine the equivalent plastic deformation in a part from the experimental measurements.
Figure 1.3 precisely describes the procedure used, by taking, as an example, the case of XRD measurements. Each depth is associated with a value of the FWHM, characteristic of the work hardening induced by shot peening. For each value of the FWHM measurements it is then possible to use the calibration curve to determine the equivalent plastic strain. Finally, the evolution of work hardening as a function of depth is derived for each analyzed sample.
Figure 1. Methodology for characterizing work hardening in shot-peened samples.
Journal Pre-proof
9
3 Results and discussion
3.1 Relevance of the methodology for an application on shot-peened samples
In the present paper, it is proposed to evaluate the work hardening that has been generated by shot peening in IN718 parts. To use the methodology proposed in Part I, several conditions have to be verified:
1. Shot peening modifies the state of the material on the near surface of the treated part. It is thus necessary to verify that the characterization techniques are able to evaluate near surface gradients.
2. The range of plastic deformations used to establish the calibration procedure must be representative of the levels obtained during shot peening.
3. During shot-peening, a complex loading is applied to the surface of the specimen. In order to be able to quantitatively evaluate the work hardening induced by shot peening, the influence of the type of loading (monotonous, cyclic...) on the calibration procedure has to be limited.
4. Since the calibration is dependent on the microstructure [1], the microstructural characteristics (grain size and size of the strengthening precipitates) of the material should not change during the treatment.
5. Shot peening induces strain rate ranging from 10-3s-1 to 103s-1 [19]. Therefore, the effect of the strain rate on the work hardening profiles must be evaluated in order to define the impact of this parameter.
Each of these points are addressed in the following sections.
3.1.1 Characterization of near surface gradients
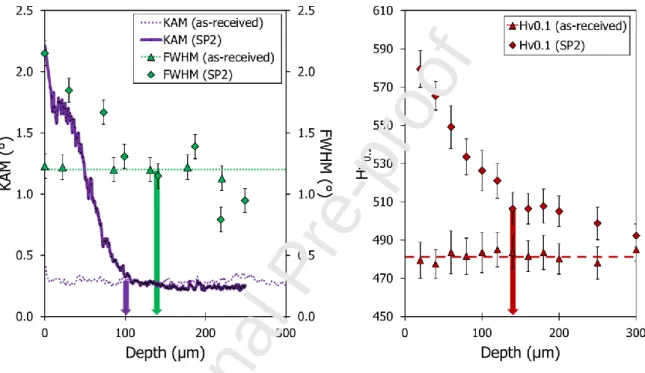
Figure 2 presents, for the DA microstructure, the in-depth profiles of the FWHM from XRD, KAM parameter from EBSD and microhardness HV0.1 obtained for the “as-received” (i.e. before shot
Journal Pre-proof
10
peening) and for SP2 shot peened samples. The Figure 2 shows that the measured parameters are homogeneous in the as-received material and that the three methods are able to capture an evolution of the measured quantity after shot peening. For the three techniques, a strong gradient appears near the surface to reach a plateau deeper in the material. These two phases correspond respectively to the work-hardened region and an in-depth region free of plastic deformations. In this last region, the shot-peened material exhibits values that are similar to the as-received material.
Figure 2. Evolution for the DA microstructure of KAM, FWHM and HV0.1 parameters as a function of depth for the as-received and shot peened samples (SP2).
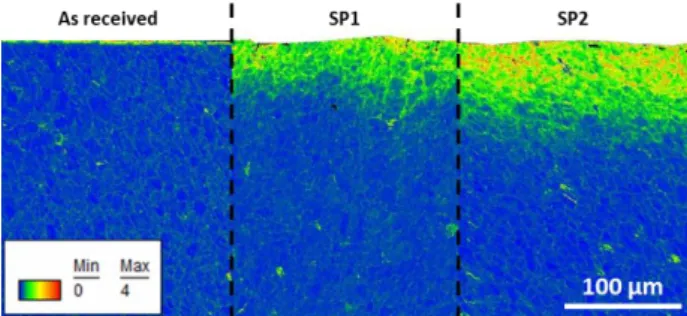
Further, the KAM mapping obtained for the DA microstructure after application of SP1 and SP2 surface treatments are presented in Figure 3. As expected, these mappings show that the more severe the applied shot peening condition, the higher the KAM parameter and the greater the affected depth.
Journal Pre-proof
11
Figure 3. Local misorientation EBSD maps for the as-received and shot peened DA microstructure.
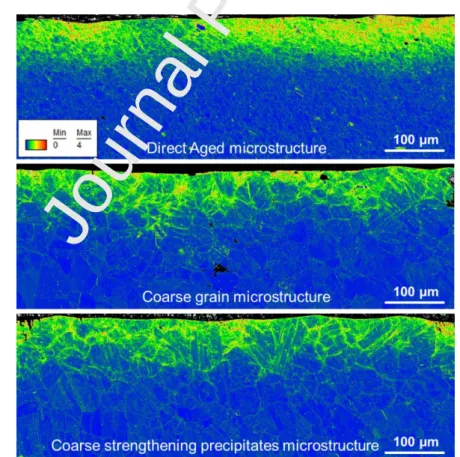
Figure 4 presents local misorientation EBSD maps obtained for the three studied microstructures after SP2. A gradient is clearly visible near the surface for the three microstructures. The difference in local misorientation due to the grain size is also visible especially because the KAM parameter is higher at the grain boundaries. It should be noted that the effect of the surface treatment is globally homogeneous for a given depth.
It can then be concluded that the techniques used for the evaluation of work hardening are able to evaluate near surface gradient and capture the modifications caused by shot peening.
Figure 4. Local misorientation EBSD maps for the three studied microstructures shot peened in SP2. The grain size for the DA microstructure is 5 µm and 35 µm for the two coarse grain microstructures.
Journal Pre-proof
12
3.1.2 Plastic strain range
The level of plastic strain that is reached in shot peening may be very important : a plastic strain of approx. 30 to 40% can be generated at the surface of a shot peened specimen [7]. The mechanical tests classically performed in a laboratory generate a limited amount of plastic strains; this is particularly the case if the method is calibrated with tensile tests alone. The range of strain used to establish the calibration may then be much smaller than the level achieved during the shot peening process. To overcome this limitation, compressive tests have been carried out in this study to explore high plastic strain levels (see section 2.2 of part I), representative of what is encountered in shot peening processes [19]. This precaution is of particular importance for the EBSD characterization method since the observed saturation of the KAM parameter can lead to an underestimation of the hardening state in the material [12], [20].
3.1.3 Influence of the loading type
The loading and deformation paths that are imposed on the material during shot peening are complex. An impact is local and induces non-proportional loading. Also, the local repetition of the impacts could be assimilated to cyclic loading such that cyclic effects are to be considered [21]. Thus, the proposed methodology is applicable only if shot peening induces a material state that is similar to the one observed after the mechanical tests used for the calibration. Prevey investigated this point on two materials, Inconel 718 and Rene95 [7]: he demonstrated that the FWHM of the XRD signal produced by a known amount of plastic strain is independent of the deformation process. In the same way, Soady et al. demonstrated that the results obtained with three characterization techniques (XRD, EBSD and microhardness) are also independent of the loading conditions (compression or tension) for a tempered martensitic steel [12].
The shot peening process should thus not induce significant cyclic softening or hardening in the material [12]. Such cyclic effects could effectively lead to a modification of the peak width of the XRD signal. It would then be difficult to distinguish the respective contribution of cyclic effects and work hardening on the peak width change. Cyclic softening phenomena have been observed in Inconel 718
Journal Pre-proof
13
superalloy, but they remain relatively small at 20°C (less than 50 MPa) [22].
Our work, presented in part [1] confirms these results: the mechanical tests carried out to obtain different hardening states show that the proposed methodology remains valid for any type of loading conditions, monotonic or cyclic, tension or compression.
3.1.4 Influence of shot peening on grain size, crystal orientation and strengthening precipitates
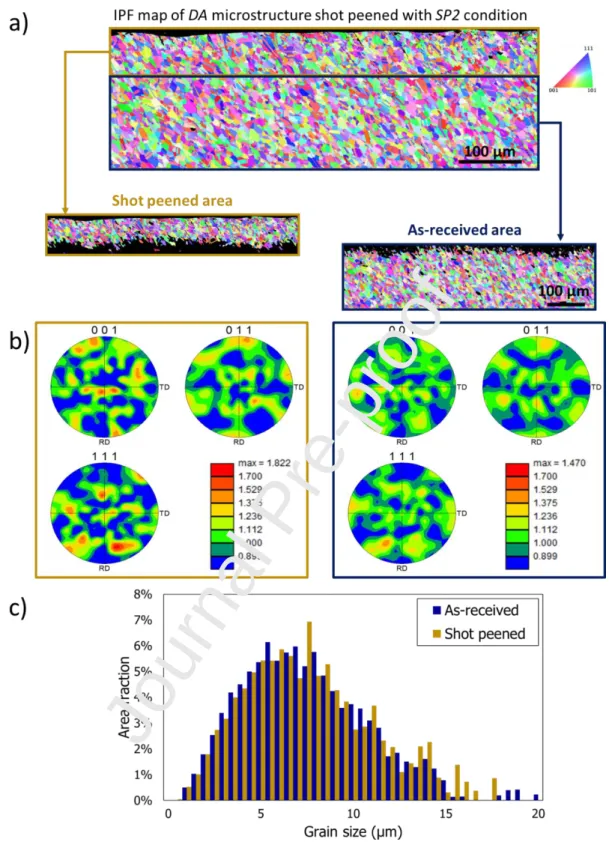
A significant influence of the material microstructure on the calibration curves has been observed (see section 4 of part I). The evaluation of work hardening in shot peened samples is therefore relevant only if the microstructural modifications induced by the treatment are limited. Because microstructural modifications have been reported in the literature for specific shot peening conditions [23], it appears necessary to verify if the microstructure has been modified in the samples under consideration. For this purpose, the grain size distribution has been evaluated along with the mean grain orientation obtained with a pole figure. This quantity has been measured on the same sample and on the same area as where the misorientation EBSD maps exposed in Figure 4 were evaluated. Two characteristic zones have been defined: the zone affected by the process and the as- received area, in the core of the material. For the DA microstructure, Figure 5.a compares the grain size distribution obtained after SP2 shot peening (the most severe treatment conditions) to the as- received material. A qualitative comparison of these diagrams shows that no major microstructural modifications are induced by the process. Figure 5.b and Figure 5.c further present the pole figures and grain size histograms obtained in the two zones. This confirms that the shot peening treatment applied in this study impacts neither the grain size nor the texture of the material: the pole patterns are indeed similar. The grain size distributions exhibit no major differences between the near-surface area and the core area. The same evaluations have been performed for the two coarse grain microstructures but the results are not presented here because they lead to exactly the same conclusion.
Journal Pre-proof
14
Figure 5. Grain size and crystallographic texture comparison between the shot peened (SP2 condition) and as- received materials obtained for DA microstructure.
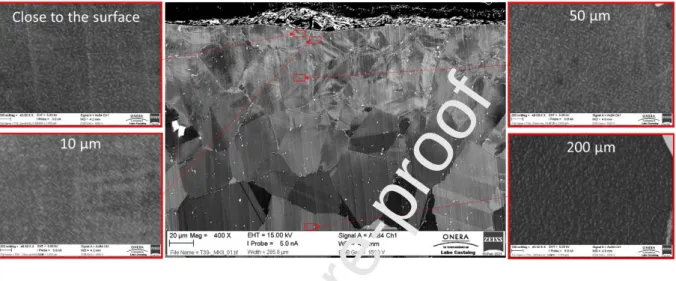
SEM images have been also acquired at various depths to evaluate the influence of shot peening on the size and distribution of the strengthening precipitates. Figure 6 shows SEM images obtained at
Journal Pre-proof
15
different depths (near the surface, at 10 µm, 50 µm and 200 µm below the shot peened surface) for the coarse grains and coarse strengthening precipitates microstructure. No major modifications on strengthening precipitates size have been observed for the three microstructures.
In the end, these analyses validate the fact that shot peening did not generate microstructural changes in the samples of this study.
Figure 6. SEM images at different depth for the coarse grains and coarse strengthening precipitates microstructure after SP2 shot peening.
3.1.5 Influence of the strain rate on the work hardening profiles obtained after shot peening
Numerical simulations of shot penning demonstrate that a strong gradient of strain rate is generated by the impacts, varying from 10-3 s-1 to 104 s-1; the highest strain rates are obtained at the surface of the shot peened specimens and decreases rapidly in depth [15], [19]. The calibration procedures that have been proposed in the literature to evaluate work hardening have been constructed with quasi- static tests [7]–[10]. It seems relevant to estimate the impact of the strain rate on the evaluation of work hardening on shot peened samples. In a previous study, the level of work hardening has been correlated to FWHM data for quasi-static (10-3 s-1) and high (103 s-1) strain rate loading conditions [1].
This experimental campaign has been performed for the DA microstructure alone because of its interest from an industrial point of view. Moreover, this strain rate analysis has been restricted to the FWHM evaluation to limit the experimental campaign. Figure 7.a presents the calibration curves
Journal Pre-proof
16
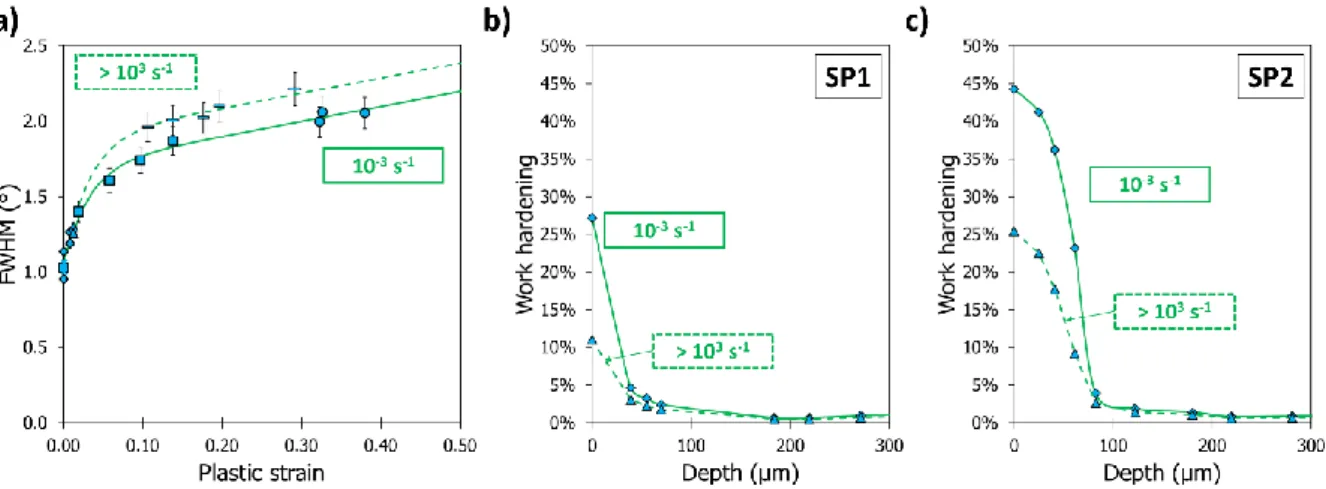
obtained for the two strain rates: for a given plastic strain, an increase in strain rate leads to an increase in the FWHM value; note that these results are in agreement with the observations made by Hoffmeister et al. [8].
Using the calibration method (see Figure 1 in section 2.3) the work hardening is evaluated on the shot peened samples for the calibration curves corresponding to these two strain rate values. Figure 7.b presents the results obtained for the DA microstructure considering that the strain rate is constant in depth. It clearly appears that the strain rate affects the work hardening profiles obtained after shot peening, especially in the area next to the surface of the specimens. For the SP1 shot peening condition, the work hardening values reach 10% for a strain rate of 103 s-1 whereas they reach 25% for a strain rate of 10-3 s-1. For the SP2 shot peening condition, the work hardening values reach 25% for a strain rate of 103 s-1 while they reach 45% for a strain rate of 10-3 s-1.
To fully consider the influence of the strain rate gradient and its history for shot peened samples a complex analysis would be required. First, the number of tests to be carried out on the same microstructure would increase significantly since it would require a calibration curve for several strain rates. In addition, the in-depth variation of the strain rate is only accessible via a finite element simulation of the shot peening process. Furthermore, even if we restrict ourselves to the surface, the strain rate is not constant in time during the different shot impacts. Implementing such a calibration procedure could thus be of interest as a future step in the method. The analysis made here by using two extreme values of the strain rate offers the advantage of proposing limit values as a function of the depth of the work hardening level. Our results clearly show that work hardening could be underestimated if the highest strain rate is considered while considering a quasi-static loading could strongly over-estimate the work hardening.
Journal Pre-proof
17
Figure 7. a) Strain rate influence on the calibration curve obtained by XRD method on the DA microstructure, b) Impact of strain rate on work hardening determination in the case of SP1 shot peened DA, c) Impact of
strain rate on work hardening determination in the case of SP2 shot peened DA microstructure.
3.2 Work hardening after shot peening: comparison of the three characterization techniques.
Using the methodology developed in [1], the gradient of work hardening is now evaluated in the shot peened samples within the scope of the hypotheses discussed in the previous section. As a first step, the three characterization techniques are compared with each other.
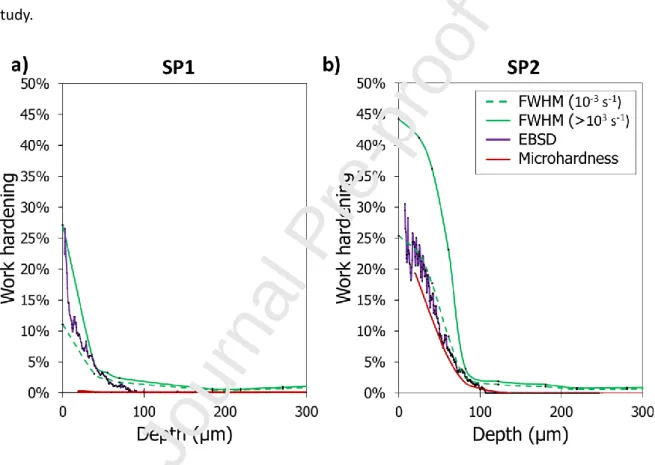
The evolution of the work hardening profiles obtained with the three characterization techniques is presented in for the DA microstructure and for the two shot peening conditions. As discussed in the previous section, the calibration has been established for two strain rates, 10-3 s-1 and 103 s-1 respectively. Figure 8 clearly shows that the three techniques are able to produce a work hardening evaluation that is, as a whole, coherent with what could be expected. The three techniques produce work hardening values that are analogous for a given shot peening condition (except for microhardness in SP1; this point is discussed below). For a given depth, the work hardening evaluated by EBSD is:
‐ in the case of SP1, comprised between the values obtained with the calibrations made with XRD for each respective strain rate.
Journal Pre-proof
18
‐ in the case of SP2, similar to the curve obtained by XRD for the 103 s-1 calibration and by microhardness.
As expected, work hardening decreases with depth and the affected area and work hardening levels are lower for SP1 than for SP2. Moreover, for the two shot peening conditions, EBSD and XRD methods feature a similar affected depth, corresponding to the depth that is known to be affected by shot peening for these conditions [6], [24]. This affected depth is also coherent with the results obtained with EBSD for both shot peening conditions (see Figure 3 and Figure 4). The calibration procedure demonstrates here one of its interests. Indeed, when KAM and FWHM evolutions are directly plotted as a function of depth for shot peened samples (see Figure 2), the affected work hardened depth is wider for XRD method; this is identified by the arrows: the work-hardened depth for the SP2 shot peening condition is 100 µm for the KAM parameter and 150 µm for the FWHM parameter. These results are in accordance with what has been observed without the use of a calibration procedure by Foss et al. [10]. The sharp variation of the FWHM parameter for small plastic strains in the corresponding calibration curve (Figure 7) explains why the evaluation of the affected depth is, in the end, equivalent to the one evaluated with the KAM parameter.
Concerning the microhardness, it can be seen that for the shot peening conditions presented in this paper, the results are more difficult to interpret. For SP1, the evaluated work hardening is nearly zero and does not change with depth (Figure 7). The microhardness is a quantity that depends on both the work hardening and the residual stresses. In the case of shot peening, the residual stresses are important close to the surface (see Figure 10). The results obtained for SP2 suggest that the impact of residual stresses on the measurement is lower as the work hardening increases. Also, remember that the calibration method has been performed on samples that were free of residual stresses. The results obtained here confirm the difficulty, to go back in the case of shot peening to a direct quantification of work hardening without taking into account the residual stresses beforehand in the analysis of the microhardness tests; this has been already mentioned in the literature [25]. Ideally, to exploit this technique, it would be necessary to identify the relationship between residual stress,
Journal Pre-proof
19
work hardening and microhardness using a series of finite-element simulations of micro-hardness tests with integration of the in-depth residual stress levels [25]. It could then be possible by an inverse method to get a consistent work hardening profile.
The results presented in this section make it possible to validate the three characterization techniques to evaluate work hardening in a shot peened part even though precautions must be taken when using microhardness due to the presence of a residual stress field. Since XRD and EBSD give similar results, the study has been limited to XRD analysis for the SP3 condition in the rest of this study.
Figure 8. Comparison of the different characterization methods for two shot peening conditions: left SP1 and right SP2.
3.3 Work hardening after shot peening: microstructure effects
The Figure 9 compares the work hardening profiles obtained for the three microstructures of Inconel 718 superalloy (DA, coarse grain, coarse grain and coarse precipitate microstructures) The calibration curves established in part I for each microstructure and for each experimental technique (XRD, EBSD and microhardness) have been used reversely to derive the work hardening evolutions as a function
Journal Pre-proof
20
of the depth for different shot peening conditions. As already mentioned, two calibration curves depending on the strain rates have been built for XRD (and DA microstructure). Both work hardening evaluations are thus reported in Figure 9.a.
Note that the results presented for SP1 and SP2, for DA microstructure, are then similar to those discussed in Figure 8.
Similar affected depths can be observed in Figure 9 for the three microstructures if we focus on SP1 and SP2 shot peening conditions. However, the effects of the microstructure appear quite different on the estimated values of work hardening according to the characterization technique. Results obtained from microhardness measurements show a clear difference between the three microstructures along the entire affected depth for SP2 condition. As for SP1 treatment, the evolution seems not consistent for the two coarse grain microstructures whereas the shot peening conditions are strictly the same (Almen intensity, coverage, number of runs). As already discussed, microhardness measurement is sensitive to both residual stress and work hardening. A consistent evaluation of the work hardening in shot peened samples requires taking into account the corresponding residual stresses. They are quite different between DA and coarse grain microstructures but close between the two coarse grain microstructures, as it will be illustrated later in section 3.4. The residual stresses seem to explain the differences between DA and coarse grain microstructures but not between the two coarse microstructures. A sensitivity of the microhardness measurements to the size of the strengthening precipitates might be pointed out. The size of the precipitates is effectively increased by a factor of 10 between the two coarse grain microstructures leading to a sensible modification of the yield strength.
It can be expected that the work hardening state after shot peening is then impacted. However, it has already been mentioned in part I of the article that the indent used in this study has a rather small size (indent diagonal equal to 20 µm). The analyzed volume is approximately of the same size as the grains for the two coarse grain microstructures. This might affect the work hardening profiles obtained for the two coarse grain microstructures. In particular, the size of the precipitates could
Journal Pre-proof
21
increase the dispersion when the indent is carried out on a single grain. This dispersion will be amplified after shot peening when residual stresses and work hardening are certainly not the same from one grain to another. Moreover, the residual stresses obtained from XRD correspond to an average response of the material stress state over several grains (X-ray penetration depth is estimated to be between 2 and 4 µm and the size of the analyzed volume is a few millimeters wide).
Potential differences in the stress state over one grain could not be captured. At this stage, the microhardness appears problematic to evaluate the work hardening after shot peening on the two coarse grain microstructures.
Concerning the profiles evaluated from XRD measurements, comparable values are obtained for the three SP2 shot peened microstructures, except at the surface of the samples. For a depth of less than 25-30 micrometers, differences can be observed between the three microstructures. However, the effect of strain rates (analyzed in section 3.1.5) is also particularly significant close to the surface. It is then difficult to conclude on the microstructure effect. Further investigation is required as the effect of the strain rates has not been evaluated for the coarse grain microstructures. The strain rate sensitivity may not be similar for the three generic microstructures and could explain a part of the gap noticed at the surface.
Finally, concerning the EBSD technique, comparable evolutions of the work hardening can be observed along the entire affected depth for the three microstructures. The values are also close to those obtained by XRD if the points at the extreme surface are spread out. It could be concluded that for SP1 and SP2 shot peening conditions the work hardening is quite similar for the three microstructures. This seems to be consistent with the applied shot peening conditions, which are theoretically identical for SP1 and SP2 shot peening conditions (same Almen intensity and coverage for the three microstructures). As already explained in section 2.1, the treatment parameters have been adapted according to the microstructure to achieve the same coverage. As expected, for equivalent treatment conditions, the work hardening is not very sensitive to the microstructure as for the SP1 and SP2 shot peening conditions.
Journal Pre-proof
22
For the SP3 shot peening conditions the comparison between the three microstructures illustrated for the XRD method in Figure 9.a shows a different trend. It can then be observed that the work hardening obtained for coarse grain microstructures is higher along the entire affected depth in comparison to the DA microstructure. It is recalled that for the SP3 treatment, the same Almen intensity is applied as SP2. The shot-peening conditions are also identical in terms of number of shot- peening runs for the three microstructures but not in terms of coverage. Thus, for the SP3 condition, the coverage is around 167% for DA microstructure and 200% for coarse grain microstructures (Table 1). As observed in section 2, the yield stress is lower in the case of both coarse grain microstructures.
The induced work hardening (assimilated to the Von Mises equivalent plastic deformation) is therefore greater for an identical applied stress as observed on the work hardening profiles after shot peening. This observation tends to validate the interest of using the coverage parameter to ensure similar trends between different microstructures in terms of work hardening profiles as for SP2 treatment.
It can be concluded from the observations made here that the proposed calibration procedure permits to quantify precisely how the microstructure affects the level of work hardening. This result represents an opportunity in order to get a complete picture of the mechanical state of industrial parts presenting microstructural heterogeneities induced by the elaboration process.
Journal Pre-proof
23
Figure 9. Comparison of a) XRD, b) EBSD and c) Microhardness methods to evaluate the work hardening evolution in the SP1 and SP2 conditions for the three studied microstructures. Note that the scale for work
hardening is the same in the seven figures
Journal Pre-proof
24
3.4 Work hardening and residual stresses after shot peening:
Influence of the treatment conditions
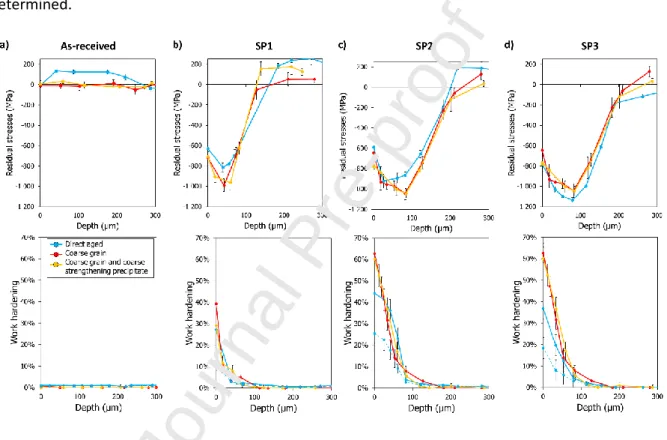
The Figure 10 illustrates the influence of the shot peening conditions on the induced mechanical state of the material. The evolution of the residual stress profiles in addition to the work hardening is represented before (a) and after the three shot peening conditions (b) SP1, (c) SP2, (d) SP3. The three generic microstructures are compared simultaneously and the XRD technique has been chosen as it gives consistent results for the work hardening profiles, and also allows residual stress profiles to be determined.
Figure 10. Residual stress and work hardening profiles obtained by XRD on the three microstructures prior to shot peening (a) as well as those obtained for the three peening conditions (b) SP1, (c) SP2, (d) SP3.
As seen in Figure 10.a, the residual stresses determined on the as-received material are close to 0.
The slightly positive values for the DA microstructure can be related to the forging step undergone by the turbine disc from which all the samples were extracted. On the contrary the heat treatment carried out to generate the coarse grain microstructures appears to have induced a complete relaxation of the residual stresses. After shot peening, the residual stress profiles for the SP1, SP2 and SP3 conditions are consistent with results reported in the literature for similar shot peening
Journal Pre-proof
25
treatments [7], [24]. An increase in shot peening intensity and coverage leads to a significant increase in the maximum compressive residual stresses, located below the surface as it can be observed by comparing the SP1 and SP2 conditions. The corresponding affected depth is also greater for SP2 than for SP1 (with the notations defined in Figure 11, zσresmaxSP1 = 50 μm; zσresmaxSP2 = 80 μm), as the size of the compression zone (zσres0SP1 = 175 μm; zσres0SP2 = 225 μm). On the surface, on the other hand, the residual stresses are relatively similar (σressurfSP1 ≈ σressurfSP2 ≈ -700 MPa) for the different conditions. The comparison between SP2 and SP3 conditions on the DA microstructure seems surprising as for a lower coverage (200% for SP2 and 175% for SP3), the compressive residual stresses appear higher as well as the affected depth. Further investigation seems however necessary. The initial stress state of the DA microstructure induced by the forging process may have an influence on the residual stresses obtained after shot peening. As already mentioned, all the samples were extracted from a turbine disc and some dispersion could be expected in terms of residual stresses between different zones of the disc. This could explain the residual stress state for SP3 in comparison to SP2 condition. To ensure a consistent comparison between the shot peening conditions (and eventually between the microstructures) a preliminary step aiming to relax these initial stresses is certainly required. This result confirms nevertheless, what has already been observed in the literature [26]–[28]: the elaboration process (forging, heat treatments,…) before shot peening has a significant influence on the residual stresses obtained after the surface treatment.
Figure 11. Notations used to describe the shape of shot-peening induced residual stress and work hardening profiles.
Journal Pre-proof
26
Concerning the influence of the microstructure, for identical shot peening conditions (same almen intensity and same coverage), the residual stresses differ depending on the microstructure. Coarse grain microstructures have similar profiles, whereas the DA microstructure presents lower compressive residual stresses. The grain size seems to affect the residual stress profiles contrary to precipitate sizes (the residual stresses being similar for the two coarse microstructures). However, as already mentioned, the residual stresses observed for the DA microstructure before shot peening could explain the difference.
Finally, the comparison between the profiles of residual stresses and work hardening shows different trends. The maximum values of work hardening (assimilated to the Von Mises equivalent plastic deformation) are obtained at the surface of the specimen, as expected, whereas it is below the surface for residual stresses. In particular, the depth corresponding to the maximum compressive stress changes with the shot peening conditions. On the contrary, the work hardening remains highest at the surface regardless of the surface treatment. This observation confirms that work hardening is more related to a local phenomenon whereas residual stresses have to be assimilated to a more “structural” effect.
The evolution of these two quantities (residual stresses and work hardening) between SP1 and SP2 conditions is also different. While the maximum of work hardening (on the surface) is increased by almost 50% between SP1 and SP2, the compressive residual stresses do not change on the surface and an increase of less than 10% of the maximum value is observed. SP3 condition confirms on the DA microstructure the influence of the shot peening conditions on work hardening values in addition to the residual stress level. In comparison to the SP2 treatment, the work hardening decreases as expected while the compressive residual stresses slightly increases. As already discussed, this increase could be a consequence of the initial stress state prior to shot peening. The work hardening evaluation then gives a complementary picture of the mechanical state.
As shot-peened parts are often subjected to thermal and/or mechanical stress, the observations made here are particularly interesting. It has been observed in the literature that the presence of
Journal Pre-proof
27
work hardening increases the relaxation of residual stresses under thermal and/or mechanical loading [25]-[29]. Neglecting residual stress relaxation leads to overestimate the fatigue life [30]. If, on the basis of residual stresses alone, it seems preferable to apply the SP2 condition to parts subjected to thermomechanical loading, it’s not so obvious when the work hardening profiles are also considered. Then, evaluating the quality of a shot peening treatment only on the knowledge of the residual stress profile could be insufficient to guarantee the service life of shot peened parts.
This work provides new opportunities in the fatigue life assessment of parts. It is then possible to quantify work hardening on a material and analyze its influence to get more accurate estimation models.
4 Conclusion
The calibration methodology proposed in Part I [1] has been applied to different Inconel 718 microstructures that have been subjected to three different shot peening conditions.
The various limitations observed in the literature concerning the use of classical calibration procedure on shot peened samples have been discussed. It is shown that the application of the calibration procedure is relevant to assess the level of work hardening of parts after shot peening. Some precautions have however to be taken. For a given equivalent plastic strain, the FWHM is higher when the strain rate increases. A variation in strain rate applied to the material during loading modifies the measured FWHM. However, it is particularly difficult to experimentally characterize the strain rates to which the material is submitted during shot peening: it varies in time and space. To overcome this problem, limit bounds for the work hardening level after shot peening have been estimated in the present work to account for the range of strain rates involved in shot peening.
The capacity of the three characterization techniques (microhardness, EBSD, XRD) to evaluate a work hardening gradient due to shot peening was then investigated. For the shot peening conditions studied in this work, microhardness seems to be the least relevant to properly evaluate work
Journal Pre-proof
28
hardening because this method is strongly dependent on the residual stress field present in the material. On the contrary, EBSD and XRD methods are well adapted and provide complementary information. The complementarity of the XRD and EBSD techniques, which give, thanks to the calibration, similar results, is particularly interesting since it can lead to a better understanding of the deformation mechanisms occurring during manufacturing processes.
Residual stress and work hardening profiles were also compared. It was shown that knowledge of the residual stress profile is insufficient to characterize the mechanical state of the material because work hardening provides additional information that needs to be taken into account when predicting the relaxation of residual stresses.
Finally, the methodology has been used to characterize three microstructures with different grain and strengthening precipitates sizes. A microstructure dependency has been observed and justifies a calibration curve for each microstructure. With the work proposed here, different microstructures can now be properly compared in terms of work hardening induced by shot peening allowing an accurate assessment of the fatigue life of different industrial parts by taking into account not only the residual stress but also the amount of work hardening accumulated in the material.
5 Acknowledgement
This work was conducted with the help of the French Technological Research Institute for Materials, Metallurgy and Processes (IRT M2P) under the CONDOR project. The authors would like to acknowledge IRT M2P and all the partners of the project led by IRT M2P. Safran is warmly thanked for its precious collaboration in this work.
6 Data availability
The raw/processed data required to reproduce these findings cannot be shared at this time due to legal or ethical reasons.
Journal Pre-proof
29 Declaration of interests
The authors declare that they have no known competing financial interests or personal relationships that could have appeared to influence the work reported in this paper.
7 References
[1] J. P. Goulmy et al., “A calibration procedure for the assessment of work hardening Part I: effects of the microstructure and load type.”
[2] N. Ben Salah, Shot Peening Applications and Future Research in the Aerospace Industry. 2017.
[3] R. F. Kubler, R. Rotinat, J. Badreddine, and Q. Puydt, “Experimental Analysis of the Shot Peening Particle Stream Using Particle Tracking and Digital Image Correlation Techniques,” Exp Mech, vol. 60, no. 4, pp. 429–443, Apr. 2020, doi: 10.1007/s11340-019-00574-4.
[4] L. Wagner, Ed., Shot Peening: WAGNER:SHOT PEENING O-BK. Weinheim, FRG: Wiley-VCH Verlag GmbH & Co. KGaA, 2003.
[5] R. C. McClung, “A literature survey on the stability and significance of residual stresses during fatigue,” Fatigue & Fracture of Engineering Materials and Structures, vol. 30, no. 3, pp. 173–
205, 2007, doi: 10.1111/j.1460-2695.2007.01102.x.
[6] P. S. Prevey, “The Effect of Cold Work on the Thermal Stability of Residual Compression in Surface Enhanced IN718,” St. Louis, Missouri, 2000.
[7] P. S. Prevey, “The measurement of sub-surface residual stress and cold work distributions in nickel base alloys,” in Residual Stress in Design, Process and Materials Selection, 1987, pp. 11–
19.
Journal Pre-proof
30
[8] J. Hoffmeister, V. Schulze, R. Hessert, and G. Koenig, “Effects of the surface treatment on the measured diffraction peak width of Inconel 718,” in ICSP-11, 2011, pp. 201–206, Accessed: Apr.
11, 2017. [Online]. Available: http://www.shotpeener.com/library/pdf/2011033.pdf.
[9] M. Kamaya, A. J. Wilkinson, and J. M. Titchmarsh, “Measurement of plastic strain of polycrystalline material by electron backscatter diffraction,” Nuclear Engineering and Design, vol. 235, pp. 713–725, 2004.
[10] B. J. Foss, S. Gray, M. C. Hardy, S. Stekovic, D. S. McPhail, and B. A. Shollock, “Analysis of shot- peening and residual stress relaxation in the nickel-based superalloy RR1000,” Acta Materiala, vol. 61, pp. 2548–2559, 2013.
[11] V. Schulze, “Characteristics of Surface Layers Produced by Shot Peening,” in Shot Peening, John Wiley & Sons, Ltd, 2006, pp. 143–160.
[12] K. A. Soady, B. G. Mellor, G. D. West, G. Harrison, A. Morris, and P. A. S. Reed, “Evaluating surface deformation and near surface strain hardening resulting from shot peening a tempered martensitic steel and application to low cycle fatigue,” International Journal of Fatigue, vol. 54, pp. 106–117, Sep. 2013, doi: 10.1016/j.ijfatigue.2013.03.019.
[13] D. Kumar, S. Idapalapati, W. Wang, D. J. Child, T. Haubold, and C. C. Wong, “Microstructure- mechanical property correlation in shot peened and vibro-peened Ni-based superalloy,” Journal of Materials Processing Technology, vol. 267, pp. 215–229, May 2019, doi:
10.1016/j.jmatprotec.2018.12.007.
[14] Norme AFNOR NFL 06-832. 1990.
[15] S. Meguid, G. Sagals, and J. C. Stranart, “3D FE analysis of peening of strain-rate sensitive materials using multiple impingement model,” International Journal of Impact Engineering, vol.
27, pp. 119–134, Feb. 2002, doi: 10.1016/S0734-743X(01)00043-4.
[16] F. Alexandre, S. Deyber, and A. Pineau, “Modelling the optimum grain size on the low cycle fatigue life of a Ni based superalloy in the presence of two possible crack initiation sites,” Scripta Materialia, vol. 50, no. 1, pp. 25–30, Jan. 2004, doi: 10.1016/j.scriptamat.2003.09.043.
Journal Pre-proof
31
[17] S. Deyber, F. Alexandre, J. Vaissaud, and A. Pineau, “Probabilistic life of DA 718 for aircraft engine disks,” in Superalloys 718, 625, 706 and derivatives, Pittsburgh, United States, Oct. 2005, p. 14 p., Accessed: Oct. 08, 2020. [Online]. Available: https://hal.archives-ouvertes.fr/hal- 00833002.
[18] M. Abikchi et al., “Fatigue life and initiation mechanisms in wrought Inconel 718 DA for different microstructures,” Chine, 2013, Accessed: Dec. 02, 2016. [Online]. Available:
http://www.gruppofrattura.it/ocs/index.php/ICF/icf13/paper/view/11242/10621.
[19] V. Boyer et al., “A constitutive model for simulation of shot-peening and fatigue,” Montréal, Canada, Sep. 2017, [Online]. Available: https://hal-utt.archives-ouvertes.fr/hal-02872966.
[20] A. Sáez-Maderuelo, L. Castro, and G. de Diego, “Plastic strain characterization in austenitic stainless steels and nickel alloys by electron backscatter diffraction,” Journal of Nuclear Materials, vol. 416, no. 1–2, pp. 75–79, Sep. 2011, doi: 10.1016/j.jnucmat.2010.11.092.
[21] J. Zarka, J. J. Engel, and G. Inglebert, “On a simplified inelastic analysis of structures,” Nuclear Engineering and Design, vol. 57, no. 2, pp. 333–368, May 1980, doi: 10.1016/0029- 5493(80)90111-9.
[22] A. P. D. Fournier, “Low cycle fatigue behavior of inconel 718 at 298 K and 823 K,” Metallurgical Transactions A, vol. 8, no. 7, pp. 1095–1105, 1977, doi: 10.1007/BF02667395.
[23] I. Altenberger, “Alternative Mechanical Surface Treatments: Microstructures, Residual Stresses
& Fatigue Behavior,” in Shot Peening, John Wiley & Sons, Ltd, 2006, pp. 419–434.
[24] T. Klotz, D. Delbergue, P. Bocher, M. Lévesque, and M. Brochu, “Surface characteristics and fatigue behavior of shot peened Inconel 718,” International Journal of Fatigue, vol. 110, pp. 10–
21, May 2018, doi: 10.1016/j.ijfatigue.2018.01.005.
[25] Y. G. Li, P. Kanoute, and M. François, “Characterization of Residual Stresses and Accumulated Plastic Strain Induced by Shot Peening through Simulation of Instrumented Indentation,”
Advanced Materials Research, vol. 996, pp. 367–372, 2014, doi:
10.4028/www.scientific.net/AMR.996.367.
Journal Pre-proof
32
[26] O. Hatamleh and A. DeWald, “An investigation of the peening effects on the residual stresses in friction stir welded 2195 and 7075 aluminum alloy joints,” Journal of Materials Processing Technology, vol. 209, no. 10, pp. 4822–4829, Jun. 2009, doi: 10.1016/j.jmatprotec.2008.12.010.
[27] A. H. Mahmoudi, A. Ghasemi, G. H. Farrahi, and K. Sherafatnia, “A comprehensive experimental and numerical study on redistribution of residual stresses by shot peening,” Materials & Design, Nov. 2015, doi: 10.1016/j.matdes.2015.10.162.
[28] K. Sherafatnia, G. H. Farrahi, and A. H. Mahmoudi, “Effect of initial surface treatment on shot peening residual stress field: Analytical approach with experimental verification,” International Journal of Mechanical Sciences, vol. 137, pp. 171–181, Mar. 2018, doi:
10.1016/j.ijmecsci.2018.01.022.
Graphical abstract
Highlights
Evaluating work hardening induced by shot peening is possible
The strain rate has an influence on the calibration
Influence of the microstructure on work hardening can be taken into account
Residual stress and work hardening measurements are complementary