HAL Id: hal-00646642
https://hal.archives-ouvertes.fr/hal-00646642
Submitted on 30 Nov 2011
HAL is a multi-disciplinary open access
archive for the deposit and dissemination of
sci-entific research documents, whether they are
pub-lished or not. The documents may come from
teaching and research institutions in France or
abroad, or from public or private research centers.
L’archive ouverte pluridisciplinaire HAL, est
destinée au dépôt et à la diffusion de documents
scientifiques de niveau recherche, publiés ou non,
émanant des établissements d’enseignement et de
recherche français ou étrangers, des laboratoires
publics ou privés.
Comparison between rough and smooth plates within
the same Rayleigh-Bénard cell
Jean-Christophe Tisserand, Mathieu Creyssels, Yoann Gasteuil, Hervé Pabiou,
Mathieu Gibert, Bernard Castaing, Francesca Chillà
To cite this version:
Jean-Christophe Tisserand, Mathieu Creyssels, Yoann Gasteuil, Hervé Pabiou, Mathieu Gibert, et
al.. Comparison between rough and smooth plates within the same Rayleigh-Bénard cell. Physics of
Fluids, American Institute of Physics, 2011, 23, pp.015105. �10.1063/1.3540665�. �hal-00646642�
Comparison between rough and smooth plates within the same
Rayleigh–Bénard cell
J.-C. Tisserand, M. Creyssels, Y. Gasteuil, H. Pabiou, M. Gibert et al.
Citation: Phys. Fluids 23, 015105 (2011); doi: 10.1063/1.3540665 View online: http://dx.doi.org/10.1063/1.3540665
View Table of Contents: http://pof.aip.org/resource/1/PHFLE6/v23/i1
Published by the American Institute of Physics.
Related Articles
Direction of scalar transport in turbulent channel flow
Phys. Fluids 23, 115105 (2011)
Effect of plumes on measuring the large scale circulation in turbulent Rayleigh-Bénard convection
Phys. Fluids 23, 095110 (2011)
Internal heating driven convection at infinite Prandtl number
J. Math. Phys. 52, 093101 (2011)
Heat transfer and pressure drop through rectangular helical ducts
J. Renewable Sustainable Energy 3, 043119 (2011)
Rayleigh–Bénard convection: Improved bounds on the Nusselt number
J. Math. Phys. 52, 083702 (2011)
Additional information on Phys. Fluids
Journal Homepage: http://pof.aip.org/
Journal Information: http://pof.aip.org/about/about_the_journal
Top downloads: http://pof.aip.org/features/most_downloaded
Comparison between rough and smooth plates within the same
Rayleigh–Bénard cell
J.-C. Tisserand, M. Creyssels,a兲Y. Gasteuil, H. Pabiou, M. Gibert,b兲 B. Castaing, and F. Chillàc兲
Université de Lyon, ENS Lyon, CNRS, 46 Allée d’Italie, 69364 Lyon, Cedex 7, France
共Received 17 February 2010; accepted 30 November 2010; published online 20 January 2011兲 In a Rayleigh–Bénard cell at high Rayleigh number, the bulk temperature is nearly uniform. The mean temperature gradient differs from zero only in the thin boundary layers close to the plates. Measuring this bulk temperature allows to separately determine the thermal impedance of each plate. In this work, the bottom plate is rough and the top plate is smooth; both interact with the same bulk flow. We compare them and address in particular the question whether the influence of roughness goes through a modification of the bulk flow. © 2011 American Institute of Physics. 关doi:10.1063/1.3540665兴
I. INTRODUCTION
Understanding natural heat convection is of obvious practical interest. It also represents a very actual intellectual challenge, despite the apparent simplicity of its academic version, the Rayleigh–Bénard 共RB兲 problem. The contro-versy in the past ten years around the high Rayleigh number behavior of RB cells1–6shows that the basic physical mecha-nisms of heat convection are not well understood.
In such a situation, tackling slightly different problems can shed new light on the main one. It is the purpose of the present paper, which explores the effect of a well defined roughness of a plate on the heat transfer between it and a fluid. Previous attempts give somewhat contradictory results.7–11We do not consider the work of Ciliberto et al.,12 inspired by a proposition of Villermaux,13which shows that the absence of characteristic length in the roughness structure can modify the power law dependence of the Nusselt 共Nu兲 versus the Rayleigh共Ra兲 number. Our work concentrates on well defined, regular, and periodic roughness.
At this stage, it is worth defining precisely the problem we consider. A Rayleigh–Bénard cell is a closed volume con-taining a fluid between two horizontal plates and vertical walls. With smooth boundaries, the control parameters are those defining the shape of the cell, as the aspect ratio ⌫=D/H, where H is the height and D is the diameter of the cell, and two more specific ones, the Prandtl number Pr and the Rayleigh number Ra. Pr=/, where is the kinematic viscosity and, the heat diffusivity, is characteristic of the fluid.
Ra =g␣⌬TH
3
共1兲
is the nondimensional measure of the temperature difference ⌬T=Th− Tc between the hot 共Th兲 and cold 共Tc兲 plates. g is
the gravitational acceleration and ␣ the constant pressure thermal expansion coefficient. The thermal global response is given by the Nusselt number
Nu = QH
⌬T, 共2兲
which compares the heat flux Q to the purely diffusive one ⌬T/H, where is the fluid thermal conductivity.
Several experiments7–10and a numerical simulation11 ex-amine the effect of the roughness of the plates on Nu. Shen
et al.7 and Du and Tong8 use perpendicular triangular grooves to define square based pyramids on their plates. With 3 mm high pyramids, they observe a short cross-over when the thermal boundary layer height 共H/2Nu兲 matches the pyramids’ one. For Rayleigh numbers under the crossover, the plate works as a smooth one. Above the cross-over, Nu is simply enhanced by a constant factor compared to the smooth case. With 9 mm high pyramids, they do not observe the cross-over, only the enhanced regime, by a factor signifi-cantly larger than that in the previous case. They observe systematic plumes at the tips of the pyramids. Qiu et al.9use the same pyramids, but sunk into the plate rather than glued. Either with 3 or 8 mm high pyramids, they observe the same power law Nu⬀Ra0.35, with a higher prefactor in the 8 mm
case.
In Ref.10, linear triangular grooves are used. Matching the thermal boundary layer height with the grooves one oc-curs here at much higher Rayleigh number共Ra⯝1012instead
of Ra⯝109for Refs.7 and8兲 and they interpret the
follow-ing regime共Nu⬀Ra1/2兲 as the settlement of a turbulent ther-mal boundary layer.14,15 Note that van den Berg et al.16 ob-tain an equivalent result with a Taylor–Couette flow, whose equations are very similar to the Rayleigh–Bénard ones.
With a numerical simulation, Stringano et al.11 also use linear triangular grooves. As in the experimental works,7–10a transition is observed toward an enhanced Nusselt regime when the thermal boundary layer height matches the grooves one. The behavior reported by Stringano et al.11 for this re-gime is Nu⬀Ra0.37for the full three-dimensional calculation
a兲Also at Ecole Centrale de Lyon, CNRS, 36, avenue Guy de Collongue
69134 Ecully cedex, France.
b兲Also at MPI-DSO Bunsenstrasse 10, D-37073 Göttingen, Germany. c兲Electronic mail: [email protected].
PHYSICS OF FLUIDS 23, 015105共2011兲
and Nu⬀Ra1/2for the axisymmetric approximation, without
any saturation up to the maximum Ra reached, implying a much wider cross-over than that in Ref.7. However, Stevens
et al.17suggest that the spatial resolution of this work is not high enough for large values of Ra, so that the calculated Nu is not accurate enough to pin down the scaling exponent. This argument does not hold for moderate Ra, just before the transition, and Stringano et al.11reported here a Nusselt sur-prisingly smaller than that for the smooth case.
Note that not only the height, but also the spatial period of the roughness could determine the thermal boundary layer thickness at the transition. However, with the kind of rough-ness used up to now, these two lengths are closely linked. It is why we choose here a different geometry which will allow us, in a future work, to explore these two influences.
The paper is organized as follows. In Sec. II, we present the apparatus, with particular emphasis on the differences with our previous works. In Sec. III, we present the results, both raw data and the various corrections we propose. The discussion and interpretation are given in Secs. IV and V. Before we conclude共Sec. VII兲, we present in Sec. VI hys-teretic effects and long time relaxations associated with the transition observed.
II. EXPERIMENTAL SETUP AND MEASUREMENTS The apparatus is basically similar to that described in Ref.18. Our cell is cylindrical, D = 50 cm in diameter. The wall is a stainless steel cylinder of thickness e = 2.5 mm for two different heights: H = 1 m 共the tall one兲 or H=0.2 m 共the small one兲. The plates are 3 cm thick. The top one is smooth made of copper and nickel plated. The bottom one is made of aluminium. Its roughness consists in a square array of square plots, d = 5 mm of side and ho= 2 mm in height,
with a period of 2d = 1 cm. The working fluid is de-ionized water, which is made free of gas in situ by boiling several hours under partial vacuum. The bottom plate has a heating wire, 13.55⍀, embedded as a spiral at the rear of this alu-minium plate. It lies on a 2 cm thick isolating polytetrafluo-rethylene plate, which is supported by a 3 cm thick square aluminium table through eight hollow stainless steel feet. These feet go through a copper thermal screen which sur-rounds the whole cell. Heat leaks from the bottom plate are modelized by linear thermal links to the screen, the alu-minium table, and the top plate共respectively, 0.7, 0.5, and 0.1 W/ °C兲. Calibration of these links allows estimating the heat leaks within 0.5W.
The top plate is cooled through two counterflow spiral tubes, with 1 cm inner diameter, welded on the plate. Tem-peratures are measured through type K thermocouples. Three of them, including the control sensor, are on the top plate. Three other ones are on the bottom plate. One is stuck on the stainless steel wall to measure the bulk temperature Tb.
Ad-ditional control platinum thermometers are glued on both plates. Eventual differences between measured temperatures in the same plate, which never go more than 3% of the total ⌬T, are strictly proportional to the applied power. They can thus be attributed to heat conduction in the plates. For the
measured Nu values, we use the sensors in the middle of the plates.
The water cooling the top plate is itself cooled through heat exchange with fresh water and temperature regulated via a 1 kW heater-cooler bath. To minimize uncontrolled heat leaks, the screen is regulated at the temperature of the middle of the cell 共bulk temperature兲. The aluminium table is also temperature regulated.
Studies are made with water at various bulk tempera-tures from 25共Pr=6.2兲 to 70 °C 共Pr=2.5兲. This temperature is maintained constant for a series of experiments at various applied powers. This is the temperature chosen for the cop-per screen and for calculating the water physical procop-perties.
III. RESULTS
In Fig.1 we present our data. Nuglobal=
QH
共Th− Tc兲
共3兲
is presented in a compensated way NuglobalRaglobal−1/3
Raglobal=g␣共Th− Tc兲H
3
共4兲
to stress the differences with the smooth case. In the same figure, we plot the results of a previous work19 using the same cell, but with both plates being smooth and made of copper共3 cm thick兲. It is clear that both sets of results are similar up to some threshold. After this threshold, the present results are above the previous ones. The depth of the thermal boundary layer at the threshold␦thcan be estimated as
␦th=
H
2Nuglobal⯝ 2 mm, 共5兲 which is the height of our square plots. We thus perfectly agree with previous works on this point.
10
1010
1110
1210
130.04
0.06
0.08
0.1
Nu
globalRa
global −1 /3Ra
globalFIG. 1. The present global results are compared with previous results, ob-tained with two smooth plates, and the same wall. Open triangles: present work. Stars: symmetric smooth cell共Ref. 19兲. The shown error bars take
into account our uncertainties on temperature and input power measurements.
The measure of the bulk temperature Tb, gives both
共Tb− Tc兲, which is the temperature drop across the boundary
layer of the smooth 共top兲 plate, and 共Th− Tb兲, which is the
temperature drop across the boundary layer of the rough 共bottom兲 plate. With the same information, some authors20–22
studied the asymmetric behavior of these plates. In their case, the asymmetry comes from the temperature dependence of the fluid properties. Here, it comes from the difference between the plates.
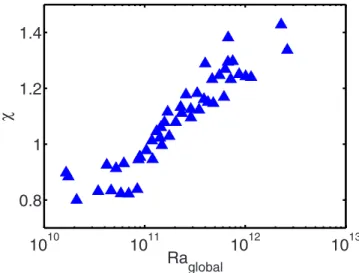
To quantify this asymmetry, they introduce the param-eter
=Tb− Tc
Th− Tb
, 共6兲
which is 1 in the symmetric case. Our values forare shown in Fig.2.
Above the threshold, is larger than 1 as expected. Note, however, that it is lower than 1 before the threshold. In the cited works,20–22the authors have no means to determine if the two boundary layers behave independently or if they mutually influence their behaviors through the bulk flow. Here, we can test this independency, as we know the behav-ior of a smooth plate.
If a symmetric cell has two independent smooth plates behaving the same as our top plate, the total temperature difference across this cell is⌬Ts= 2共Tb− Tc兲. Its Nusselt
num-ber is Nus=
QH
⌬Ts
共7兲
and its Rayleigh number is Ras=
g␣⌬TsH3
. 共8兲
We have to add a remark here. Measuring Tb with a
single probe gives a more noisy and uncertain result than averaging on many probes all around the cell. Moreover, Brown and Ahlers23have shown that the large scale
circula-tion共LSC兲 can sometimes be locked. This would result in an uncertainty in Tb− Tc and Th− Tb equal to the temperature
amplitude of the LSC, which can amount to 2%–8% of ⌬T/2.24
While not significant for our larger values of , it could question our result that is smaller than 1 before the transition.
We have reasons, however, for arguing that our uncer-tainty cannot be so high. First, as will be seen later, our results for the smooth plate are in good agreement with pre-vious ones, obtained in a symmetric cell.19 Second, ⬍1 before the transition is confirmed with a second cell, also discussed in this work, with aspect ratio much larger 共2.5兲 and thus a completely different LSC.
In Fig. 1, we show examples of error bars taking only account of our temperature and input power measurements uncertainty. Apart from a few points, they agree with the local dispersion of our results. The few exceptions could be due to systematic errors as discussed above or to the hyster-etic behavior discussed in Sec. VI.
Similar to what we make for the top smooth plate, we can define a Nusselt number for the rough bottom plate
Nur=
QH
⌬Tr
, 共9兲
with⌬Tr= 2共Th− Tb兲 and a Rayleigh number
Rar=
g␣⌬TrH3
. 共10兲
As the⌬T can be different because of the asymmetry, a same run corresponds to different Ra values for the two plates. We thus prefer to use as the characteristic number
Raⴱ= RaNu =g␣QH
4
, 共11兲
which has the same value for both plates.
There are two reference behaviors for Nu versus Ra. The first one is Nu⬀Ra1/3, which corresponds to a heat flux
in-dependent of the height H of the cell. That one is equivalent to Nu⬀Raⴱ1/4. The second one is Nu⬀Ra1/2, corresponding to
a heat flux independent of the dissipative coefficients共purely inertial convection兲. It is equivalent to Nu⬀Raⴱ1/3.
For clarity of the results, it will be interesting to define a reduced Nusselt red Nu = Nu Ra1/3=
冉
Nu Raⴱ1/4冊
4/3 . 共12兲A purely inertial behavior gives a reduced Nusselt
redNu⬀Ra ⴱ 1/9.
Tables I–III show part of our results 共see Sec. VI for other results兲. Together with the raw data and the corre-sponding Nu for each plate, we give the corrected values corresponding to two effects. The first one is the finite con-ductivity of the wall, discussed in Ref.25 or Ref. 26. The second one corresponds to the non-Oberbeck–Boussinesq 共NOB兲 effects. We discuss them separately.
Roche et al.25propose an analytical formula for the cor-rection of the wall conduction effect
10
1010
1110
1210
130.8
1
1.2
1.4
χ
Ra
globalFIG. 2.共Color online兲, the ratio between the temperature drops of the top and the bottom boundary layers, is plotted against the global Rayleigh num-ber Raglobal.
Nucor= Numeasured 1 + f共W兲, 共13兲 with f共W兲 = A 2 ⌫Nu冉
冑
1 +2W⌫Nu A2 − 1冊
⯝ A冑
2冑
W ⌫Nu 共14兲 and W = 4We/D⯝0.5, the ratio between the wall and thequiescent fluid heat conductances and A⯝0.8.
A warning must be raised, however. As explained in Ref.
25, this correction comes from a part of the heat power being directly injected in the bulk flow through the walls close to the plates, acting as an additional plate area. But this addi-tional area is smooth. The extension of the correction to the case of a rough plate is not obvious. As a conservative ap-proximation, we shall refer to the naive interpretation of roughness effects, as an enhancement factor S/Sofor the area
of the plate共which is doubtful, however; see below兲. Within this interpretation, the ratio between the rough and smooth Nusselt numbers would be共S/So兲3/4 and the boundary layer
on the rough plate would be thicker than that on the smooth one by a factor 共S/So兲1/4. The relative corrections for the
rough and smooth plates would be related as
冉
␦Nu Nu冊
rough=冉
␦Nu Nu冊
smooth冉
Nusmooth Nurough冊
7/6 . 共15兲The second correction comes from NOB effects and de-serves a longer discussion.
NOB effects are extensively discussed for instance in Refs.20–22. It appears from all these studies that the relative
correction to the Nusselt number is second order in the tem-perature difference between the plates if the cell has symmet-ric plates. It would result in negligible共less than 1%兲 correc-tions with the temperature applied here. However, NOB effects result in a relative first order shift of the bulk tem-perature Tb from the mean temperature Tm=共Th+ Tc兲/2.
From the work of Ref. 20 the effect is often discussed in terms of the parameter
=Th− Tb Tb− Tc = 1 − c2⌬T + ¯ 共16兲 and thus Tb− Tm= ⌬T 2 1 − 共1 +兲= c2
冉
⌬T 2冊
2 + ¯ . 共17兲Two theories attempted in calculating . References20
and22start from the hypothesis that the hot共bottom,␦h兲 and
cold 共top, ␦c兲 thermal boundary layer thicknesses are such
that their characteristic temperatures
i=
ii
g␣i␦i
3 共18兲
are equal共the fluid properties are evaluated at the mean tem-perature of the boundary layer兲. While giving good agree-ment with some experiagree-ments, particularly for Nusselt correc-tions, this basic assumption has been proved to be wrong.22
TABLE I. Small cell results. Index s is for smooth and r is for rough. The two last columns are the corrected results.
Pr Raⴱ Nus共raw兲 Nur共raw兲 Nus Nur 4.49 4.60⫻1010 66 70 62 65 4.34 9.60⫻1010 76 88 71 84 4.32 1.94⫻1011 87 110 83 105 4.34 3.85⫻1011 101 136 97 130 4.33 5.33⫻1011 108 148 104 142 6.19 4.96⫻1010 64 70 60 66 6.19 4.91⫻1010 63 70 59 66 6.10 2.55⫻1010 56 57 52 53 6.12 1.27⫻1010 48 48 45 44 6.20 5.02⫻1009 39 39 36 36 6.19 6.29⫻1009 42 40 38 37 2.46 4.38⫻1012 190 274 186 264 2.46 3.82⫻1012 184 264 180 255 2.46 3.82⫻1012 184 261 180 252 2.46 3.27⫻1012 178 250 173 242 2.50 2.67⫻1012 169 235 164 227 2.49 1.61⫻1012 151 202 146 195 2.49 8.58⫻1011 130 168 125 162 2.49 4.27⫻1011 111 137 106 132 2.49 2.12⫻1011 95 110 91 105 2.53 1.04⫻1011 83 87 78 83 2.49 4.10⫻1010 65 67 61 63
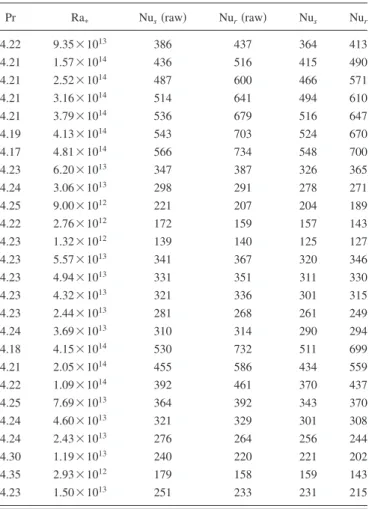
TABLE II. Tall cell results for T = 40 ° C.
Pr Raⴱ Nus共raw兲 Nur共raw兲 Nus Nur 4.22 9.35⫻1013 386 437 364 413 4.21 1.57⫻1014 436 516 415 490 4.21 2.52⫻1014 487 600 466 571 4.21 3.16⫻1014 514 641 494 610 4.21 3.79⫻1014 536 679 516 647 4.19 4.13⫻1014 543 703 524 670 4.17 4.81⫻1014 566 734 548 700 4.23 6.20⫻1013 347 387 326 365 4.24 3.06⫻1013 298 291 278 271 4.25 9.00⫻1012 221 207 204 189 4.22 2.76⫻1012 172 159 157 143 4.23 1.32⫻1012 139 140 125 127 4.23 5.57⫻1013 341 367 320 346 4.23 4.94⫻1013 331 351 311 330 4.23 4.32⫻1013 321 336 301 315 4.23 2.44⫻1013 281 268 261 249 4.24 3.69⫻1013 310 314 290 294 4.18 4.15⫻1014 530 732 511 699 4.21 2.05⫻1014 455 586 434 559 4.22 1.09⫻1014 392 461 370 437 4.25 7.69⫻1013 364 392 343 370 4.24 4.60⫻1013 321 329 301 308 4.24 2.43⫻1013 276 264 256 244 4.30 1.19⫻1013 240 220 221 202 4.35 2.93⫻1012 179 158 159 143 4.23 1.50⫻1013 251 233 231 215
Ahlers et al.22propose to revisit thermal convection in a Blasius profile, taking into account the temperature depen-dence of fluid properties. They obtain without adjustable parameter and good agreement with their experimental re-sults and those of Zhang et al.21 However, they cannot pro-pose an analytical formula and it is not clear if the Nusselt number obtained through their theory in Boussinesq condi-tions agrees with the observed one.
As we are concerned with linear corrections, the fluid being water, we can follow a different path. The theory of Ahlers et al.22 shows well that at the linear level, the tem-perature dependence of␣might have no influence. The only influent parameters are the temperature derivatives of and
. In water, is nearly temperature independent. Dimen-sional considerations then yield to
c2= K共Pr兲
d ln共兲
dT . 共19兲
Indeed, K cannot depend on the other nondimensional parameter Ra, as it has to be independent of the height H of the cell, if the two plates behave independently. Ahlers
et al.22propose two experimental values for c2at two
differ-ent temperatures, thus differdiffer-ent Pr: T = 29 ° C, Pr= 5.53 and
T = 40 ° C, Pr= 4.34. Assuming a power law dependence of K共Pr兲, we propose
c2= − 0.061Pr0.25
冋
d ln共兲
dT
册
. 共20兲This formula gives also reasonable agreement with the results of Ref.21, in spite of the very large difference in the Prandtl number共Pr=2550 for glycerol兲.
Again, this correction is designed for smooth plates. However, we use the same formulas for rough plates. So, in both cases, the corrections for the rough plate are uncertain, except at low Raⴱ, where the behaviors of both plates are similar. On the other hand, when different from the smooth one, the rough Nusselt number is much larger共see Sec. IV兲, making the corrections small.
Anyway, we use these corrections with two goals: first, to compare as finely as possible the smooth plate results with the traditional ones and second, to show that these correc-tions are small compared to the huge effects observed on the rough plate. Figure 3 resumes the applied factors for the Nusselt of the smooth plate.
Finally, we renounce to apply any correction for the fi-nite heat conductivity of the plates. Indeed, in Ref.27, such a correction is proposed based on the experimental compari-son between various plates and a numerical simulation28 gives some support for the existence of such a correction. However, contrary to previous corrections, we have no theory or model supporting the proposed formula. Moreover, in a recent work,29this correction proves to be inadequate, so we have no guarantee that such a correction would be mean-ingful in our case.
IV. DISCUSSION
The corrected values for the smooth plate are shown in Fig.4asredNus= NusRas−1/3. They are in good agreement with
previous measurements in the same cell, where both plates are smooth, shown as stars in the same figure. This agree-ment has many important consequences. It validates the usual approximation of two separate thermal resistances共the boundary layers兲, with a bulk between them approximately uniform in temperature. Certainly, the larger dispersion of the present results compared to the previous ones is partly due to some spatial variations of the bulk temperature, but this dispersion cannot hide the important trends. The small 共⌫=2.5兲 and the tall 共⌫=0.5兲 cell results nicely fit together, in agreement with previous observations on the poor
influ-TABLE III. Tall cell results for T = 70 ° C.
Pr Raⴱ Nus共raw兲 Nur共raw兲 Nus Nur 2.48 2.22⫻1015 829 1184 809 1141 2.49 8.70⫻1014 687 851 662 818 2.49 7.36⫻1014 657 817 632 785 2.48 6.03⫻1014 624 780 599 749 2.49 4.67⫻1014 589 726 564 697 2.49 2.64⫻1014 514 590 490 563 2.49 1.98⫻1014 473 549 450 524 2.49 1.31⫻1014 428 482 406 458 2.49 9.71⫻1013 395 439 373 416 2.49 6.37⫻1013 357 368 336 346 2.49 5.01⫻1013 339 337 318 316 2.49 3.67⫻1013 315 298 295 277 2.49 2.34⫻1013 277 262 258 243 2.49 1.67⫻1013 267 220 249 201 2.49 1.34⫻1013 256 211 238 192 2.49 1.01⫻1013 240 200 223 182 2.49 6.91⫻1012 221 183 204 166 2.49 3.58⫻1012 191 153 176 137 2.49 2.14⫻1013 277 233 259 213 2.49 1.30⫻1014 433 474 410 450 2.49 1.71⫻1014 464 521 440 496 2.49 2.24⫻1014 491 565 467 539 2.49 3.66⫻1014 553 646 529 618 2.49 2.69⫻1015 896 1197 876 1150 109 1011 1013 1015 0.9 0.95 1 1.05 Ra * Corr. factor
FIG. 3. 共Color online兲 The correction factors used for the smooth plate’s Nusselt number. Open symbols: small cell. Full symbols: tall cell. Circles: NOB corrections. Triangles: wall corrections.
ence of the aspect ratio ⌫.30 The influence of the Prandtl number is clear, in reasonable agreement with previous studies.31–34
It is also clear that the present smooth plate results show no signature of the transition observed in the global results 共see Fig.1兲. It shows that the two boundary layers are
inde-pendent of each other. This conclusion could not have been reached with a symmetric cell.
In contrast, the rough plate results共Fig.5兲 show a clear
transition when the thermal boundary layer approximately matches the height of the grooves. It corresponds to a differ-ent value of Raⴱfor each set of data due to the different value of H in the tall cell共1 m兲 and in the small cell 共20 cm兲. Note, however, as remarked in Sec. I, that we do not check the relative influence of the height and the period of the grooves.
Before the transition, the Nusselt number is slightly reduced compared to the smooth case, as in Ref. 11. To qualify the behavior after the transition, we prefer to write: close to Nu⬀Ra1/2 共or Ra
ⴱ
1/3兲, with no visible saturation. The
com-parison is shown in Fig.5. The Ra interval is too small and our uncertainty too large for any significant measure of the exponent.
The comparison between the tall and small cells allows to finely check the eventual influence of the bulk flow. In-deed, reducing H by a factor of 5 lowers Ra by 125 and thus the Reynolds number by approximately 10.35For clarity, we present the results as the ratio between the rough and smooth reduced Nusselt 共Fig.6兲, which coincides with the ratio of
the corresponding ⌬T to the power ⫺4/3, namely, 共⌬Ts/⌬Tr兲4/3. It thus exactly represents the enhancement
fac-tor due to the roughness. As the abscissa, we take Raⴱ, in the definition of which we use the tall cell height H = 1 m. We multiply it by the Prandtl number Pr as we remark that it merges nicely the different temperatures. However, it well corresponds to our observed Prandtl dependence of the smooth plate Nusselt. So, this Pr factor should be interpreted as the rough plate Nusselt being Pr independent after the transition.
This plot confirms the previous analysis and shows that the enhancement factor is the same in both cells, tall and small. This, and the absence of any signature of the transition on the smooth plate, shows that the bulk flow has a negli-gible influence on the Nusselt number.
With our roughness profile, the contact area between the plate and the fluid is 1.4 larger than that with a smooth plate 共1.4 is the area ratio兲. We see in Fig.6that the enhancement factor goes over this number without apparent saturation. An enhancement factor larger than the area ratio is also no-ticed in Ref.8. However, they report a Nusselt behavior par-allel to the smooth one, as if the enhancement reached a saturation. Indeed, as their grooves are 9 mm high rather
10
910
1110
1310
150.04
0.06
0.08
0.1
redNu
sRa
*FIG. 4. 共Color online兲 The reduced Nusselt number for the smooth plate. Open symbols: small cell. Full symbols: tall cell. Up triangles: T = 70 ° C, Pr= 2.5. Circles: T = 40 ° C, Pr= 4.3. Down triangles: T = 25 ° C, Pr= 6.2. Stars correspond to a previous work with symmetric smooth plates共Ref.
19兲. The shown error bars take into account our uncertainties on temperature
and input power measurements.
10
910
1110
1310
150.04
0.06
0.08
0.1
redNu
rRa
*FIG. 5.共Color online兲 The reduced Nusselt number for the rough plate. The continuous line corresponds to Nu⬀Ra1/2. Open symbols: small cell. Full symbols: tall cell. Up triangles: T = 70 ° C, Pr= 2.5. Circles: T = 40 ° C, Pr= 4.3. Down triangles: T = 25 ° C, Pr= 6.2. The shown error bars take into account our uncertainties on temperature and input power measurements.
10
1210
1310
1410
151
1.4
1.8
(Δ
T
r/Δ
T
s)
4 /3Ra
*Pr
FIG. 6. 共Color online兲 Ratio between the smooth and rough reduced Nusselts. The dashed line at 1.4 corresponds to the total area of the rough plate divided by the smooth one. The full line corresponds to a共RaⴱPr兲1/9 behavior, i.e., the ratio between a Nu⬀Ra1/2one for the rough plate and Nu⬀Ra1/3for the smooth one. The shown error bars take into account our uncertainties on temperature measurements.
than ho= 2 mm for ours, their transition Raⴱvalue should be
共9/2兲4⯝400 times smaller than ours. The saturation can
oc-cur under their explored range, while being above ours. V. INTERPRETATION
What could be the interpretation of our results? It seems clear that the total area enhancement, the area ratio, is not a good reference. If the ratio between rough and smooth Nusselt has to saturate, its value after saturation has to rely on a different basis.
Let us first examine the possibility that no saturation occur. This is indeed the interpretation of Roche et al.10for their experiment. They argue that the roughness of the plate fixes the size of the viscous sublayer of a turbulent thermal boundary layer, transforming the Nu⬀关Ra/共ln Ra兲3兴1/2
be-havior predicted by Kraichnan14 in a pure Nu⬀Ra1/2 one 共note that the Pr dependence for the rough plate cannot be deduced from the Kraichnan work兲. However, they have the argument that a previous experiment in a similar cell,35 with smooth plates, gives a behavior compatible with the Kraichnan one. Here, the smooth plate remains in the same regime, showing no trace of a transition to turbulence. More-over, changing the height of the cell by a factor of 5 lowers the Reynolds number of the cell by a factor of 10 and that based on the height ho of the roughness by a factor of 2. It
has no influence on the behavior of the rough plate. Despite the Nu⬀Ra1/2 behavior, a transition to a
turbu-lent state is thus improbable, while we cannot totally exclude it: some Taylor–Couette results16suggest that in the presence of boundary roughness, turbulence can occur for even smaller values of the Reynolds numbers than that of the small cell.
For an alternative explanation, we prefer to focus on the fact that part of the fluid, close to the plate, within the notches between the plots, cannot be taken by the flow and remain at rest until its buoyancy destabilization. Before this buoyancy destabilization, it thus reduces the heat exchange as it prevents the convection to go closer to the plate. After the buoyancy destabilization, on the opposite, it vigorously contributes to the heat exchange. This part, the shaded one in the Fig. 7, occupies a fraction of the plate. We shall call it the “sensitive area.” Figure 7 suggests that = 1/4. The rest of the plate contributes to the Nusselt number in the same way as that for the smooth plate. Thus, Nur=Nusens
+共1−兲Nusand Nusens= 1 Nur−
冉
1 − 1冊
Nus⯝ 4Nur− 3Nus. 共21兲We thus consider that 4Nur− 3Nus gives us an
experi-mental estimation of the heat conductivity of this sensitive area. We can compare it with our model in two separate cases, before and after the buoyancy destabilization of the fluid within the notch.
Such a destabilization is similar to that of a Rayleigh– Bénard cell of height 2ho= 4 mm. The Rayleigh number
Ranotch of such a cell is related to Raras
Ranotch= g␣⌬Tr共2ho兲3 =
冉
2ho H冊
3 Rar. 共22兲We thus expect this destabilization to occur for Ranotch
being a few thousand, taking into account the limited aspect ratio of this cell: 5/4. Indeed, we obtain a critical value of Ro⯝6⫻103 for Ranotch, fairly coherent with this
interpretation.
For Ranotch⬎Ro, the heat conductivity of the notch
should be similar to that of such a cell. We estimate the Nusselt number of the notch as
Nunotch=
2ho
H Nusens. 共23兲
Figure8 compares the obtained experimental values for Nunotch to another experiment 共full symbols兲, where the
as-pect ratio is even smaller共1/2兲.35The critical Rayleigh num-ber of this experiment is thus larger共3⫻104兲 and we
renor-malize its Rayleigh numbers by a factor of 5 to fit with ours. For Ranotch⬍Ro, the quiescent fluid of height ho should
be topped with a smooth type boundary layer of height ␦. The thermal conductivity of the sensitive area is thus equiva-lent to a layer of quiescent fluid, of total height ho+␦, and we
can write d
d 2ho
FIG. 7.共Color online兲 Schematic view of the rough plate. The shaded part is the fluid at rest, not washed by the flow共arrow兲. Also shown is the equiva-lent Rayleigh–Bénard cell whose buoyancy destabilization corresponds to the transition of the rough plate. d = 5 mm is the half period of the rough-ness. 2ho= 4 mm is twice the height of the notch.
10
210
310
410
50.5
1
2
5
10
20
N
u
notch
Ra
notch
FIG. 8. 共Color online兲 Effective Nusselt of the water between plots on the rough plate. Full triangles: small cell data, with proper height renormaliza-tion. Small black circles: data of Ref.35with renormalization of Ra to take account of the different aspect ratio共0.5 vs 1.25 here兲. Open triangles down: 2hoNusens/HN. Continuous line: 1/共1+N兲, with N=6⫻10−2Ranotch1/3 .
Nusens= H 2共ho+␦兲 = H 2ho N 1 + N 共24兲
with N = ho/␦. To estimate␦, we take it equal to the boundary
layer thickness on the adjacent areas, which behaves as a smooth plate. For such a smooth plate, according to the re-sults of Fig.4, Nu⯝6⫻10−2Ra1/3. Thus,
N =ho ␦ = 2ho H H 2␦ ⯝ 6 ⫻ 10 −2Ra r 1/32ho H =6⫻ 10−2Ranotch1/3 . 共25兲 In Fig.8, we compare 2hoNusens/HN and 1/共1+N兲 with
N = 6⫻10−2Ra notch
1/3 共open symbols兲. We clearly miss of low
Ra data to be categoric, but the agreement is fair.
To conclude, the enhancement factor observed for the rough plate Nusselt compared to the smooth one is consistent with the buoyancy destabilization of the fluid captured inside the notches. This model not only justifies the general obser-vation that the depth of the boundary layer fits the height of the plots at the transition, it also explains why the rough plate has a lower Nusselt than that of the smooth one just before the transition, as was previously observed by Stringano et al.11 in their numerical simulation. The model also gives the right value of the enhancement factor after the transition. For much higher Raⴱnumber, it would predict that the rough plate comes back to the same Nusselt as that of the smooth one. However, in the mean range, a turbulent transi-tion will probably occur.
Note that if this interpretation is correct, the Ra1/2 depen-dence of the rough plate Nusselt is fortuitous. Such a power law behavior cannot be predicted by our model.
VI. HYSTERESIS AND RELAXATION
In this section, we discuss some occurrences of hyster-etic behavior of the rough plate, as for instance shown in Fig.9.
In this example, the transition discussed in Sec. VI does not occur at the usual Rar value. Rather, when growing Rar
by small steps, the rough plate continues in a Nu⬀Ra1/3
mode, up to Rarvalues twice as large before raising its
re-duced Nusselt. Yet, instead of going to its equilibrium value within 1 h or so, the rough plate temperature slowly drops in a relaxation way during several days. We can follow such a relaxation during half a month, which is shown in Fig.10. The applied power is 3300 W, corresponding to the highest Ra value at Tb= 70 ° C. The squares correspond to the
evo-lution of ⌬Tr= 2共Th− Tb兲. The triangles correspond to the
evolution of⌬Ts= 2共Tb− Tc兲. Their constant value shows that
during all the relaxation of the rough plate, the smooth one keeps a constant Nusselt.
The time dependence of⌬Tr better fit with an
exponen-tial function of time t, with time constant close to 6 days, than with a ln t behavior. A ln t behavior, corresponding to the absence of characteristic time, would have meant that the origin of the relaxation is in a complex system as the turbu-lent bulk flow itself. On the contrary, the origin has to be searched in a simple system.
Such observations can be interpreted in the frame of our model for the rough plate behavior. It would mean that maybe, depending on the orientation of the large scale flow, the bifurcation of the trapped quiescent fluid共shaded part in Fig.7兲 to a convective state can turn to subcritical. Then, on
some Ra range, each trapped part has a finite probability per unit time to become convective, resulting in an exponential relaxation of the global Nusselt number.
Note that we never observed such a hysteretic behavior with the small cell.
VII. CONCLUSION
The initial goal of this experiment is to look if the rough-ness of the plate can trigger the turbulence in the boundary layer. While not directly answering the question, our results give many interesting hints.
The Nusselt number of the top smooth plate is spectacu-larly similar to that obtained with two symmetric smooth plates. Its behavior seems insensitive to the transition expe-rienced by the opposite rough plate. This is to be noted as, on the other hand, this behavior slightly differs from a pure Ra1/3 one, which means that the bulk flow has some influ-ence on it. However, this result is consistent with many works共e.g., Ref.36兲 showing the poor influence of the large
10
1010
1110
1210
130.04
0.05
0.06
0.07
0.08
0.09
Ra
Nu Ra −1 /3Decreasing Heat Flux Increasing Heat Flux
FIG. 9.共Color online兲 Hysteretic behavior of the rough plate for the tall cell. Stars: increasing Ra by small steps. Squares: decreasing Ra from its largest value. 0 5 10 15 −2.5 −2 −1.5 −1 −0.5 0 0.5 δ T (K) t (days)
FIG. 10.共Color online兲 Time evolution of the plates temperatures compared to their initial one. Squares: rough plate. Triangles: smooth plate. Continu-ous line: exponential relaxation with time constant 6 days, and −1.8 ° C of limit value.
scale motion on the Nusselt number. Even those suggesting such an influence show that it is very tiny共close to 1%兲.18
Moreover, this work strongly corrects common intuitive feelings about the influence of roughness. At least close to the Rayleigh number where its effect appears, the increase in contact area with the fluid共the area ratio兲 is not a reference. The enhancement factor of the Nusselt number overcomes this limit without apparent saturation. If this saturation exists8 and if the Nusselt number returns to a Nu⬀Ra1/3 mode, the cross-over range is much larger than that sug-gested in Ref.7. Our model, focusing on the destabilization of quiescent preserved fluid zones, has the advantage to cap-ture most of the characteristics of the enhancement factor, including probably the hysteretic behavior.
If this interpretation is correct, the Ra1/2behavior of the rough plate’s Nusselt number Nur is fortuitous. A turbulent
transition, which would more naturally explain it, is improb-able. The main objection against it is that reducing the height of the cell by a factor of 5, and thus the Reynolds number based on the roughness size ho by more than a factor 2, has
no influence on this behavior. We cannot totally exclude it, however. The Taylor–Couette results16 suggest that turbu-lence can occur for even smaller values of this Reynolds number. The final answer will come at larger values of the Rayleigh number based on ho, by the occurrence or not of a
saturation in Nur/Rar1/3.
To resume, the independent behavior of both plates shows that the thermal exchange between a solid boundary and a fluid is largely a local process. However, the discrep-ancy between the Nusselt enhancement factor and the area ratio shows the limits of this locality. It shows how important is to understand the coherence of the flow along the plate. ACKNOWLEDGMENTS
We thank M. Moulin and F. Vittoz for technical assis-tance. This work has been partly supported by the Agence Nationale pour la Recherche under Contract No. ANR-07-BLAN-0181.
1M. Sano, X. Z. Wu, and A. Libchaber, “Turbulence in helium-gas
free-convection,”Phys. Rev. A 40, 6421共1989兲.
2X. Chavanne, F. Chillà, B. Castaing, B. Hébral, B. Chabaud, and J.
Chaussy, “Observation of the ultimate regime in Rayleigh-Bénard convec-tion,”Phys. Rev. Lett. 79, 3648共1997兲.
3J. J. Niemela, L. Skrbek, K. R. Sreenivasan, and R. J. Donnelly,
“Turbu-lent convection at very high Rayleigh numbers,”Nature共London兲 404, 837共2000兲.
4J. J. Niemela and K. R. Sreenivasan, “Confined turbulent convection,”J.
Fluid Mech.481, 355共2003兲.
5D. Funfschilling, E. Bodenschatz, and G. Ahlers, “Search for the “ultimate
state” in turbulent Rayleigh-Bénard convection,”Phys. Rev. Lett. 103, 014503共2009兲.
6G. Ahlers, S. Grossmann, and D. Lohse, “Heat transfer and large scale
dynamics in turbulent Rayleigh-Bénard convection,”Rev. Mod. Phys. 81, 503共2009兲.
7Y. Shen, P. Tong, and K. Q. Xia, “Turbulent convection over rough
sur-faces,”Phys. Rev. Lett. 76, 908共1996兲.
8Y. B. Du and P. Tong, “Turbulent thermal convection in a cell with ordered
rough boundaries,”J. Fluid Mech. 407, 57共2000兲.
9X.-L. Qiu, K.-Q. Xia, and P. Tong, “Experimental study of velocity
bound-ary layer near a rough conducting surface in turbulent natural convection,”
J. Turbul. 6, N30共2005兲.
10P. E. Roche, B. Castaing, B. Chabaud, and B. Hébral, “Observation of the
1/2 power law in Rayleigh-Bénard convection,”Phys. Rev. E 63, 045303 共2001兲.
11G. Stringano, G. Pascazio, and R. Verzicco, “Turbulent thermal convection
over grooved plates,”J. Fluid Mech. 557, 307共2006兲.
12S. Ciliberto and C. Laroche, “Random roughness of boundary increases
the turbulent convection scaling exponent,” Phys. Rev. Lett. 82, 3998 共1999兲.
13E. Villermaux, “Transfer at rough sheared interfaces,”Phys. Rev. Lett. 81,
4859共1998兲.
14R. H. Kraichnan, “Turbulent thermal convection at arbitrary Prandtl
num-ber,”Phys. Fluids 5, 1374共1962兲.
15E. Siggia, “High Rayleigh number convection,”Annu. Rev. Fluid Mech. 26, 137共1994兲.
16T. H. van den Berg, C. R. Doering, D. Lohse, and D. P. Lathrop, “Smooth
and rough boundaries in turbulent Taylor-Couette flow,”Phys. Rev. E 68, 036307共2003兲.
17R. J. A. M. Stevens, R. Verzicco, and D. Lohse, “Radial boundary layer
structure and Nusselt number in Rayleigh-Benard convection,”J. Fluid
Mech. 643, 495共2010兲.
18F. Chillà, M. Rastello, S. Chaumat, and B. Castaing, “Long relaxation
times and tilt sensitivity in Rayleigh Bénard turbulence,”Eur. Phys. J. B
40, 223共2004兲.
19S. Chaumat, Ph.D. thesis, Ecole Normale Supérieure de Lyon, 2002
共un-published兲.
20X. Z. Wu and A. Libchaber, “Non-Boussinesq effects in free thermal
convection,”Phys. Rev. A 43, 2833共1991兲.
21J. Zhang, S. Childress, and A. Libchaber, “Non-Boussinesq effect:
Ther-mal convection with broken symmetry,”Phys. Fluids 9, 1034共1997兲. 22G. Ahlers, E. Brown, F. Fontenele Araujo, D. Funfschilling, S.
Grossmann, and D. Lohse, “Non-Oberbeck-Boussinesq effects in strongly turbulent Rayleigh-Bénard convection,”J. Fluid Mech. 569, 409共2006兲. 23E. Brown and G. Ahlers, “Effect of the Earth’s Coriolis force on the
large-scale circulation of turbulent Rayleigh-Benard convection,” Phys.
Fluids 18, 125108共2006兲.
24E. Brown and G. Ahlers, “A model of diffusion in a potential well for the
dynamics of the large-scale circulation in turbulent Rayleigh-Benard con-vection,”Phys. Fluids 20, 075101共2008兲.
25P. E. Roche, B. Castaing, B. Chabaud, B. Hébral, and J. Sommeria, “Side
wall effects in Rayleigh Bénard experiments,”Eur. Phys. J. B 24, 405 共2001兲.
26G. Ahlers, “Effect of sidewall conductance on heat-transport
measure-ments for turbulent Rayleigh-Bénard convection,” Phys. Rev. E 63, 015303共2000兲.
27E. Brown, A. Nikolaenko, D. Funfschilling, and G. Ahlers, “Heat transport
in turbulent Rayleigh-Bénard convection: Effect of finite top- and bottom-plate conductivities,”Phys. Fluids 17, 075108共2005兲.
28R. Verzicco, “Effects of nonperfect thermal sources in turbulent thermal
convection,”Phys. Fluids 16, 1965共2004兲.
29G. Ahlers, D. Funfschilling, and E. Bodenschatz, “Transitions in heat
transport by turbulent convection at Rayleigh numbers up to 1015,”New
J. Phys. 11, 123001共2009兲.
30A. Nikolaenko, E. Brown, D. Funfschilling, and G. Ahlers, “Heat transport
by turbulent Rayleigh-Bénard convection in cylindrical cells with aspect ratio one and less,”J. Fluid Mech. 523, 251共2005兲; D. Funfschilling, E. Brown, A. Nikolaenko, and G. Ahlers, “Heat transport by turbulent Rayleigh-Bénard convection in cylindrical samples with aspect ratio one and larger,”ibid. 536, 145共2005兲.
31G. Ahlers and X. Xu, “Prandtl-Number dependence of heat transport in
turbulent Rayleigh-Bénard convection,”Phys. Rev. Lett.86, 3320共2001兲. 32P. E. Roche, B. Castaing, B. Chabaud, and B. Hébral, “Prandtl and
Rayleigh numbers dependences in Rayleigh-Bénard convection,”
Euro-phys. Lett. 58, 693共2002兲.
33K. Q. Xia, S. Lam, and S. Q. Zhou, “Heat-Flux measurement in
high-Prandtl-number turbulent Rayleigh-Bénard convection,”Phys. Rev. Lett.
88, 064501共2002兲.
34S. Grossmann and D. Lohse, “Thermal convection for large Prandtl
num-bers,”Phys. Rev. Lett. 86, 3316共2001兲; “Fluctuations in Rayleigh-Bénard convection: The role of plumes,”Phys. Fluids 16, 4462共2004兲. 35X. Chavanne, F. Chillà, B. Chabaud, B. Castaing, and B. Hébral,
“Turbu-lent Rayleigh-Bénard convection in gaseous and liquid He,”Phys. Fluids
13, 1300共2001兲.
36S. Ciliberto, S. Cioni, and C. Laroche, “Large-scale flow properties of
turbulent thermal convection,”Phys. Rev. E 54, R5901共1996兲. 015105-9 Comparison between a rough and a smooth plate Phys. Fluids 23, 015105共2011兲