HAL Id: hal-02592986
https://hal.inrae.fr/hal-02592986
Submitted on 15 May 2020HAL is a multi-disciplinary open access archive for the deposit and dissemination of sci-entific research documents, whether they are pub-lished or not. The documents may come from teaching and research institutions in France or abroad, or from public or private research centers.
L’archive ouverte pluridisciplinaire HAL, est destinée au dépôt et à la diffusion de documents scientifiques de niveau recherche, publiés ou non, émanant des établissements d’enseignement et de recherche français ou étrangers, des laboratoires publics ou privés.
Monitoring the effects of deer on plant abundance and
diversity in old-growth coastal temperate rainforests,
Haida Gwaii, British Columbia
A. Mckenzie
To cite this version:
A. Mckenzie. Monitoring the effects of deer on plant abundance and diversity in old-growth coastal temperate rainforests, Haida Gwaii, British Columbia. Environmental Sciences. 2009. �hal-02592986�
Monitoring the effects of
deer on plant abundance
and diversity in
old-growth coastal
temperate rainforests
Haida Gwaii, British Columbia
Annie McKenzie
Final MFC paper
December 2009
CemOA : archive ouverte d'Irstea / CemagrefUniversity of Toronto:
Terry Carleton Tat Smith Andy Kenney
Haida Gwaii Forest District:
Len Munt Tyler Peet Sean Muise
Research Group on Introduced Species:
Jean Louis Martin (Cefe-CNRS) Christophe Baltzinger (Cemagref)
Report submitted to:
CemOA
: archive
ouverte
d'Irstea
Acknowledgements
I need to send a big thank you to all the people who helped me with this research and who contributed to making my internship experience in Haida Gwaii truly incredible. Thank you to Jean-Louis Martin for inviting me to participate in this long-term monitoring deer exclosure project. Christophe Baltzinger and Soizic Lesaout for endless laughs and doughnuts while carrying out field work, and for assisting me with sedge identifications and data analysis. Having the opportunity to visit smaller Islands in Laskeek Bay and Gwaii Hanaas gave me valuable insight into the impacts of deer on understory vegetation, and I need to thank the Laskeek Bay Conservation Society, Parks Canada and the Research Group on Introduced Species (RGIS) for making this possible. A huge thank you goes out to all the staff at the Haida Gwaii Forest District – Ministry of Forests and Range. I need to thank Len Munt for making this internship possible and for providing me with the unique opportunity to learn about resource management in Haida Gwaii. Thank you to Tyler Peet and Sean Muise for provided me with endless guidance and support throughout my internship. I am also grateful to Berry Wijdeven, Dave Crossley, Colin Richardson and Mark Salzl for taking me into the field with them and to everyone else in the office for being so welcoming. I also need to thank Doug Louis for providing the map for this report and Steph Regi and Celena Faulkner for sending me great deer pictures.
At the University of Toronto, I am grateful to Andy Kenny for making this internship possible and for encouraging me throughout my time in the MFC program. Thank you to Terry Carleton and Jay Malcolm for assisting me with the multivariate analyses and to Tat Smith for his support. I also need to thank Jess Kaknevicius for her advice and help with statistics. A big thank you goes out to my friends Martin Danyluk, Katie Mazer and Alex MacIntosh for their editing assistance and home-cooked meals. Finally, I need to thank my fellow masters of forest conservation students for making the MFC program so enjoyable. CemOA : archive ouverte d'Irstea / Cemagref
Abstract
Overabundant deer populations are a major factor affecting forest ecosystem dynamics in many parts of North America. Sitka black-tailed deer (Odocoileus hemionus
sitkensis) were introduced to Haida Gwaii, a remote island archipelago in British
Columbia, in the late 19th century. The mild climate, abundant vegetation, absence of
predators, low hunting pressure and lack of competing herbivores on Haida Gwaii allowed the deer to flourish and the population exploded. This long-term monitoring experiment studies the effects of Sitka black-tailed deer on the diversity, abundance and reproduction of understory vegetation. In this study 20 deer exclosures were monitored over a period of 12 years from 1997 to 2009 in old growth forests on Graham Island, the largest island of the Haida Gwaii archipelago. The results showed that protection from deer did not have an effect on species richness. However, deer are having a significant impact on the abundance of understory vegetation in the medium height stratum (0.5 m - 1.5 m) and they are shifting the community composition towards less palatable species. The plant species most affected by deer browsing were bunchberry (Cornus
unalaschkensis) and fern-leaved goldthread (Coptis aspleniifolia), and these are
important forage species for Sitka black-tailed deer in their natural habitat in Alaska. Deer are also having an impact on plant reproduction, as a significantly higher proportion of flowers and fruits were found inside the exclosures. More research is needed to understand the impacts of deer on understory vegetation and therefore this study provides practical recommendations for improving this long-term monitoring experiment as well as recommendations for future research.
CemOA
: archive
ouverte
d'Irstea
Table of Contents
1 Background ... 7 2 Literature Review ... 8 3 Objective ... 10 4 Methodology ... 11 4.1 Study Site ... 11 4.2 Data Analysis ... 15 4.2.1 Species richness ... 154.2.2 Understory plant abundance ... 15
4.2.3 Vegetation Community Composition ... 16
4.2.4 Plant Reproduction... 17
4.2.5 Ground Cover and Canopy Cover ... 18
5 Results ... 18
5.1 Species richness ... 18
5.2 Understory plant abundance ... 19
5.3 Vegetation Community Composition ... 23
5.4 Plant Reproduction... 27
5.5 Overstory Canopy Cover and Ground Cover ... 29
6 Discussion... 29
6.1 Impact of deer on plant species richness ... 29
6.2 Impact of deer on plant abundance ... 31
6.3 Impact of deer on plant community composition ... 32
6.4 Impact of deer on plant reproduction ... 34
6.5 Changes in ground cover and canopy cover ... 35
7 Recommendations ... 36
7.1 Practical recommendations ... 36
7.2 Recommendations for future research ... 37
8 Conclusion ... 38 9 Literature cited ... 39 CemOA : archive ouverte d'Irstea / Cemagref
List of Figures
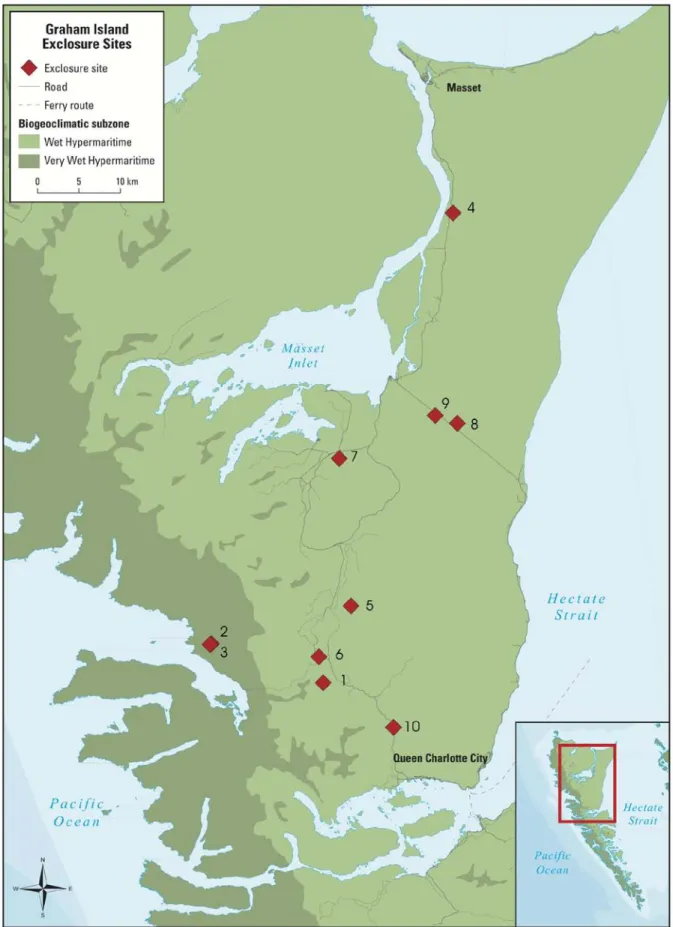
Figure 1. Location of study sites on Graham Island, Haida Gwaii ... 12
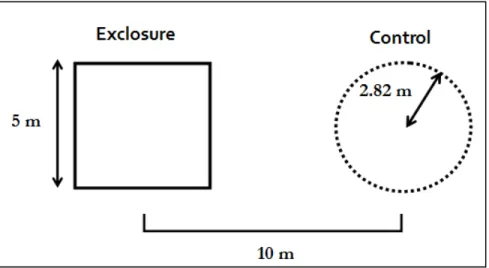
Figure 2. Experimental design showing paired exclosure and control plot ... 13
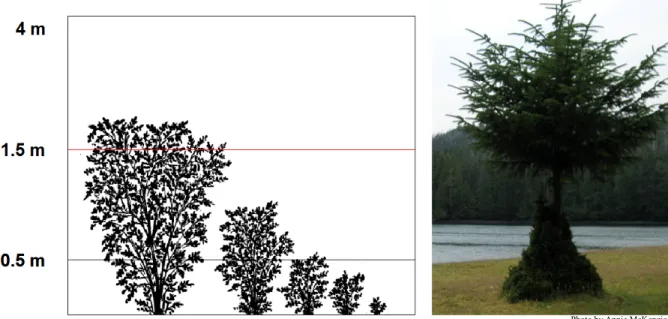
Figure 3. Illustrations of the 1.5 m browse limit. ... 14
Figure 4. Changes in average percent cover of understory vegetation ... 21
Figure 5. Changes in average percent cover of bunchberry over time ... 22
Figure 6. Photographs of bunchberry plants in exclosures ... 22
Figure 7. Changes in average percent cover of fern-leaved goldthread over time ... 23
Figure 8. Photographs of fern-leaved goldthread ... 23
Figure 9. Samples ordination diagram showing the results of the partial principal components analysis (PPCA) with samples classified according to treatment. ... 25
Figure 10. Samples ordination diagram showing the results of the partial principal components analysis (PPCA) with samples classified according to treatment and years. 26 Figure 11. Species ordination diagram for partial redundancy analysis (PRDA) with treatment used as constraining environmental variables. ... 27
Figure 12. The proportion of plots containing plants with reproductive structures ... 28
Figure 13. Change in average percent cover of moss in exclosures and control plots .... 29
List of Tables
Table 1. Species richness in four sampling years ... 19Table 2. Mean percent cover of plant species in four sampling years ... 20
Appendices
Appendix I. Average total percent cover of all species
Appendix II. Graphs of the average percent cover of each species at each site Appendix III. Site numbers, names and locations of exclosures on Graham Island
CemOA
: archive
ouverte
d'Irstea
1
Background
The explosion of deer populations, in the absence of natural predators, has become a major factor affecting forest ecosystem dynamics in many parts of North America (Sullivan et al. 1990, McShea et al. 1997) and Europe (Baines et al. 1994, Gill 1999). These population explosions can be triggered by natural processes or result from imbalances caused by human activities, such as species introductions (Vila et al. 2004). Sitka black-tailed deer (Odocoileus hemionus sitkensis) were introduced to Haida Gwaii, a remote island archipelago in British Columbia, in the late 19th century. The deer were purposely introduced by the British Columbia Gaming Commission in 1911 as a source of game for settlers of European descent (RGIS 2009). The mild climate, abundant vegetation, absence of predators, low hunting pressure and lack of competing herbivores on Haida Gwaii allowed the deer to flourish and the population exploded (Martin and Baltzinger 2002). Current deer populations on Haida Gwaii are estimated to range between 113,000 and 250,000 individuals in 8,500 km2 of available habitat (Martin and
Baltzinger 2002). Average population density on larger islands in the archipelago has been estimated at about 13 deer per km2, which is much higher than the density on the adjacent mainland (Daufresne and Martin 1997). Understanding the ecological role of this introduced and overabundant species in the forests of Haida Gwaii has become an important focus of research and a major concern for local communities and forest managers in recent years.
CemOA
: archive
ouverte
d'Irstea
2
Literature Review
In the absence of predators, deer can have a strong effect on the structure and composition of forest herb layers, subcanopy and ultimately forest canopies, as they impact tree regeneration (Stroh et al. 2008). Overabundant deer populations have been shown to shift plant community composition from a forest understory dominated by shrubs and herbs to one dominated by ferns and graminoids (Horsley et al. 2003, Stockton et al. 2005, Rooney 2009). This change in community composition reflects a decline in the abundance and diversity of palatable species and an increase in unpalatable, resistant or browse-tolerant species (Kirby 2001, Horsley et al. 2003, Rooney and Waller 2003, Gill and Fuller 2007) In general, studies have indicated that overabundant deer populations decrease plant species diversity, simplify vegetation structure and contribute to the biotic homogenization of forest ground-layer vegetation (Anderson and Katz 1993, Wardle et al. 2001, Coomes et al. 2003, Kraft et al. 2004, Gaston et al. 2006, Rooney 2009). As a consequence, deer exert cascading effects on small mammals, birds and invertebrates by competing directly for resources and by modifying the composition and structure of understory habitats (Flowerdew and Ellwood 2001, Allombert et al. 2005a, Allombert et al. 2005b, Gill and Fuller 2007).
Many studies have evaluated the effects of high population densities of white tailed deer (Odocoileus virginianus) on the vegetation of the eastern hardwood forests of North America (Reviewed in Russell 2001). These studies have shown that overabundant populations of white tailed deer reduce the abundance and diversity of woody plants (Alverson et al. 1988, Tilghman 1989, Hobbs 1996, deCalesta 1997, Waller and Alverson 1997, McShea et al. 1997). In some cases deer have caused the extirpation of plant
CemOA
: archive
ouverte
d'Irstea
species (Whitney, 1984; Rooney and Dress, 1997). Fewer studies have examined the effects of black-tailed deer on the plant communities of the temperate rainforest of North America (Woodward et al. 1994, Daufresne and Martin 1997, Stockton et al. 2005).
Several studies have been carried out to characterize the impacts of the introduced Sitka black-tailed deer on the understory vegetation communities in the temperate rainforest Haida Gwaii (Daufresne and Martin 1997, Engelstoft 2001, Gaston et al. 2006, Martin and Baltzinger 2002, Martin and Daufresne 1999, Pojar et al. 1980, Stockton et al. 2005, Stroh et al 2008). To date, published research has largely been focused on small islands in Laskeek Bay in the south of Haida Gwaii. Selecting islands of similar size but differing in their history of deer browsing, these studies found that deer have important negative impacts on the vegetation structure and composition on these island communities (Stockton et al. 2005). Deer have reduced plant diversity and simplified the forest ecosystems on these small islands. However, deer culls have resulted in the recovery of understory plants and an increase in species diversity (Golumbia 1999, Gaston 2002, Gaston et al. 2006).
Much less is known about the impacts of deer on Graham Island, the largest island in the Haida Gwaii archipelago. A long-term monitoring deer exclosure experiment was set up on Graham Island in 1997 by the Research Group on Introduced Species (RGIS) to monitor the effects of the introduced black-tailed deer on understory vegetation and tree regeneration in old-growth forests. Stroh et al. (2008) published the first study based on this long-term monitoring experiment. Their study revealed that Sitka black tailed deer had a drastic negative impact on western red cedar (Thuya plicata) regeneration, however red cedar seedlings did show a significant recovery following deer exclusion. Two unpublished
CemOA
: archive
ouverte
d'Irstea
studies analyzed the data collected from this long-term monitoring experiment from 1997 to 2005 in order to evaluate the impact of deer on understory vegetation and to test the potential for the recovery of plant species following the prolonged exclusion of deer (Kaknevicius 2008 and Stroh 2008). These studies found that understory vegetation recovery was much slower on Graham Island than on the smaller islands in the south, and the protection from deer did not affect plant species richness. Both of these studies concluded that additional research was needed to understand the dynamics of understory vegetation recovery on Graham Island.
This study extends this research by evaluating the composition and abundance of plant species after an additional four years of deer exclusion in order to determine if there was a continued divergence in species composition and an increase in plant abundance within the exclosures over the long-term. The results of this study are compared with those found by Kaknevicius (2008) and Stroh (2008) and the data collected in 2009 was added to the database for this long-term monitoring experiment. Finally, recommendations for improving this long-term monitoring experiment and for further research are made.
3
Objective
The objective of this study is to determine if Sitka black-tailed deer limit the diversity, abundance and reproduction of understory vegetation below the 1.5m browse limit in old growth forests on Graham Island, Haida Gwaii.
CemOA
: archive
ouverte
d'Irstea
4
Methodology
4.1
Study Site
Haida Gwaii is a remote island archipelago in British Columbia, situated 80km west of mainland British Columbia and 50 km south of Alaska. Haida Gwaii is the largest archipelago in western Canada at 300 km long, and is composed of two main islands, Graham and Moresby, as well as hundreds of smaller islands (Stroh et al. 2008). The study was carried out on the largest island, Graham Island which is 6,361 km2, in the
northern part of the archipelago.
Haida Gwaii is in the Coastal Western Hemlock (CWH) bioclimatic zone (Banner et al. 1989) and the climate is a cool temperate, oceanic, humid-perhumid type (Pojar 2002). Haida Gwaii has 2,000-4,000 mm of precipitation annually with cool summers and mild winters (Pojar 2002). The Haida Gwaii landscape is largely forested with coastal temperate rainforest. The forest canopy is dominated by Sitka spruce (Picea
sitchensis), western hemlock (Tsuga heterophylla), and western red cedar (Pojar 2002).
At higher elevations, mountain hemlock (Tsuga mertensiana) and yellow cedar (Chamaecyparis nootkatensis) are also present (Pojar 2002). The flora of the Haida Gwaii archipelago is similar to that of southeast Alaska (Banner et al. 1989) however the species richness is lower with 665 vascular plant species compared to 2,300 on the mainland (Douglas et al. 1998).
CemOA
: archive
ouverte
d'Irstea
Figure 1. Location of study sites on Graham Island, Haida Gwaii Source: BC Ministry of Forests and Range Map produced by Martin Danyluk CemOA : archive ouverte d'Irstea / Cemagref
Deer exclosures were set up on Graham Island in 1997 to monitor the long-term impacts of deer on forest understory vegetation and western red cedar regeneration. As this is a long-term monitoring experiment, the experimental design and sampling procedures used in this study were consistent with previous years. The experiment consisted of 10 sites on Graham Island in remnant old-growth forest patches (Figure 1). The names and locations corresponding to the site numbers shown in Figure 1 are found in Appendix III. The sites were initially chosen because they were under mature forest canopy and had an abundance of red cedar seedlings (Stroh et al. 2008). All of the sites are within the Coastal Western bioclimatic zone. Two of the sites are in the Very Wet Hypermaritime subunit, as shown in Figure 1.
Every site contained two square deer exclosures that measured 25 m2. Each deer
exclosure plot was paired with an unfenced control plot. The control plots were circular, with a radius of 2.82 m and a total area of 25 m2. The center of the control plot was
located 10 m from the center of the exclosure. Field sampling was carried out from July 3rd to July 14th 2009. Previous data used in this study was collected in the fall of 1997,
2000, 2005 and 2009.
Figure 2. Experimental design showing paired exclosure and control plot
CemOA
: archive
ouverte
d'Irstea
To measure the abundance and diversity of the understory vegetation, all the plants in the exclosures and control plots were identified to the species level according to Pojar and MacKinnon (1994). Grasses and sedges were identified according to Douglas et al. (2001) to the species level. The percent cover of each plant species was estimated in all exclosures and control plots. The percent cover was measured in eight different height classes. For simplification, the height class data will be classified into 3 categories for the statistical analyses: 0-0.5 m, 0.5-1.5 m and 1.5-4.0 m. The first two categories are below the browse line which was identified at 1.5m by Martin and Daufresne (1999) and is shown in Figure 3. This method of measuring the abundance and diversity of understory vegetation is consistent with previous studies that collected data for this long-term monitoring experiment (Stroh et al. 2008, Stroh 2008, Kaknevicius 2008).
Figure 3. Illustrations of the 1.5 m browse limit (diagram from: Martin and Daufresne 1997).
To study the impact of deer on ground cover, the percent cover of various substrates was estimated, including wood, rock, lichen, moss, root, litter, bare soil and
Photo by Annie McKenzie
CemOA
: archive
ouverte
d'Irstea
grass. The total canopy cover was also estimated from the center of each exclosure and control plot.
Additional data was collected in 2009 that was not collected in previous years. The presence or absence of reproductive structures (flowers and fruits) was recorded in the exclosures and control plots for all species. The presence or absence of deer browse damage was also recorded for all the species in the control plots.
4.2
Data Analysis
4.2.1 Species richness
To calculate species richness, the total number of species found in the exclosures and the control plots was counted for all four years (1997, 2000, 2005 and 2009). The number of species only found in the exclosures, in the control plots, and in both the exclosures and the control plots was recorded. The species observed in 2009 were then compared with the British Columbia list of plant species at risk (B.C. Ministry of Environment n.d.) to determine if any of them were threatened or endangered on Haida Gwaii.
4.2.2 Understory plant abundance
A Before-After Control Paired (BACIP) test was used to compare the changes in average total percent cover of all understory vegetation in the exclosures and control plots from 1997 (before they were established) to 2009 (12 years after the exclosures were established). To do this, the average total percent cover of vegetation in the exclosures was subtracted from the average total percent cover of vegetation in the
CemOA
: archive
ouverte
d'Irstea
control plots for 1997 and 2009. The mean differences between exclosures and controls in 1997 and 2009 were compared using a two-sample paired t-test for means (Smith 2002). The following formula was used for the BACIP test:
Equation 1: Dik= XiCj – XiIk = µ + ηi + εik
µ = the mean difference between control and impact ηi = the change in difference from before to after
εik = the error associated with the difference (Smith 2002).
In addition to comparing the changes in average total percent cover, the BACIP test was also used to compare changes in average understory cover within the three height strata and to compare changes in average total cover for various species groups (trees, shrubs, ferns, herbs and graminoids). Finally, BACIP tests were performed on an individual species basis to evaluate whether individual species responses to the exclosure treatment were significant.
4.2.3 Vegetation Community Composition
To prepare the data for statistical analyses, a species table matrix was created for all species and all years. As there were two paired plots per site, the average total percent cover of each species was calculated for the two exclosures and the two control plots at each site. This was carried out for the data in 1997, 2000, 2005 and 2009. The table was organized so that species were columns and rows represented the treatments (exclosure vs. control plot), within plots, within years. This species matrix was used for all of the multivariate analyses. In addition to the species data table, a design matrix of incidences was constructed indicating the membership in plots, year of survey and treatment effect.
CemOA
: archive
ouverte
d'Irstea
The average percent cover of each species was also calculated for all 10 sites in 1997, 2000, 2005 and 2009 both in the exclosures and the control plots, to gain a better understanding of the overall abundance of each species. The graphs in Appendix II illustrate the total average percent cover for each species in the exclosures and control plots in 2009.
Multivariate analyses
Several multivariate analyses were performed to gain a better understanding of the effect of the exclosures on community composition. Because the primary interest focused on the exclosure effects, and to a lesser extent on yearly variation, the effects of plot variation were partialled out of the multivariate analyses.
A partial principal components analysis (PPCA) was carried out on the species data table described earlier, from which the plot effects were removed as covariates. In the analysis, the data were centered by species with no prior normalization (Leps and Smilauer 2003). To emphasize the species that contributed most to treatment differences (the differences between the exclosures and the control plots), a partial redundancy analysis (PRDA) was conducted using the same options as for the PPCA described above, but with the treatment used as constraining environmental variables (Leps and Smilauer 2003). Another PRDA was conducted as above, but with years included as covariates in order to evaluate the significance of the treatment effect. Two tests were conducted, one on untransformed data, and one on log-transformed data.
4.2.4 Plant Reproduction
A likelihood-ratio chi-square test was used to test the null hypothesis that the proportion of plots with plants with reproductive structures (fruits and flowers) is the
CemOA
: archive
ouverte
d'Irstea
same for exclosures and control plots. This test was performed for each species that had reproductive structures in more than 5 plots. To carry out this test, a 3x2 contingency table was constructed for each species. The first column contained the position (exclosure or control), the second column contained the presence of reproductive structures (yes or no) and the last column contained the total number of plots. If the expected count in any of the cells was less than 5, a Fisher’s exact test was used instead of the likelihood ratio chi-square test.
4.2.5 Ground Cover and Canopy Cover
The BACIP design was also used to compare changes in the differences in moss and litter cover between 1997 and 2009, as well as changes in the differences in average canopy cover between the exclosures and control plots at each site.
All statistical analyses were performed using Statistical Analysis Software (Version 9) (SAS Institute Inc. 2000) and CANOCO (version 4.5) (ter Braak and Smilauer 2002) with a significance test of P=0.05.
5
Results
5.1
Species richness
The total species richness in the exclosures and control plots, as well as the number of species unique and common to the exclosures and control plots are shown in table 1. The total number of species has almost doubled between 1997 and 2009 both in the exclosures and control plots. However, there is no significant difference between the number of species in the exclosures and the control plots in 2009. Therefore, the exclosure treatment did not have an effect on species richness.
CemOA
: archive
ouverte
d'Irstea
In 2009, there were six species of plants that were unique to the exclosures. All of these species were dicots with perennial growth habits. Of these species, five were herbs including deer-cabbage (Nephrophyllidium crista-galli), pearly everlasting (Anaphalis
margaritacea), western rattlesnake-root (Prenanthes alata), small bedstraw (Galium trifidum) and round-leaved sundew (Drosera rotundifolia). The sixth species, one-sided
wintergreen (Orthilia secunda), was a sub-shrub.
None of the species found within the exclosures or control plots in 2009 were listed as species at risk on Haida Gwaii. Both Sitka spruce and pacific crabapple (Malus
fusca) were recorded in the exclosures and control plots at site 18 (Mayer Lake), and this
is characterized as a rare plant community on Haida Gwaii (HG SLUA 2007).
Table 1. Species richness in four sampling years
Year Unique species in exclosure Unique species in control plots exclosure and Species in
control plots Total Species
1997 7 2 17 26
2000 2 3 24 29
2005 7 2 33 42
2009 6 4 35 45
5.2
Understory plant abundance
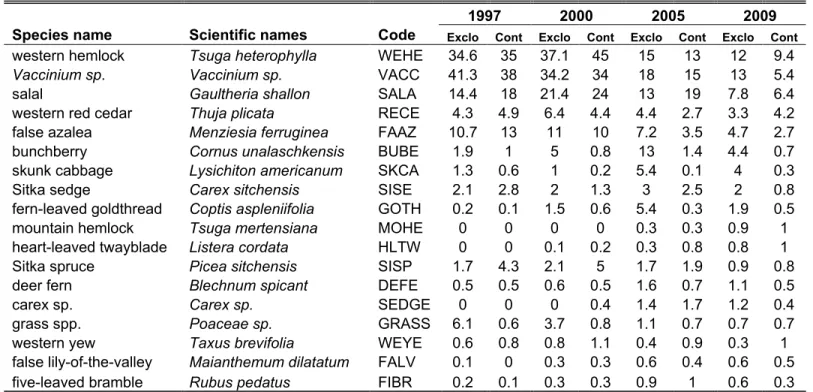
The average abundances of all species with a percent cover greater than 0.5% in the exclosures and the control plots are shown in table 2 in decreasing order of total average abundances in 2009. The three most abundant tree species were western hemlock, western red cedar and Sitka spruce. The most abundant shrub species were
Vaccinium sp., salal (Gaultheria shallon) and false azalea (Menziesia ferruginea). The
three most abundant herb species were bunchberry (Cornus unalaschkensis), skunk cabbage (Lysichiton americanum) and fern-leaved goldthread (Coptis aspleniifolia).
CemOA
: archive
ouverte
d'Irstea
These results are consistent with the understory vegetation that is characteristic of the Coastal Western Hemlock biogeoclimatic zone (Pojar et al. n.d.). A complete list of average total abundances for all plant species in the four sampling years is found in Appendix I.
Table 2. Mean percent cover of plant species in four sampling years
1997 2000 2005 2009
Species name Scientific names Code Exclo Cont Exclo Cont Exclo Cont Exclo Cont
western hemlock Tsuga heterophylla WEHE 34.6 35 37.1 45 15 13 12 9.4
Vaccinium sp. Vaccinium sp. VACC 41.3 38 34.2 34 18 15 13 5.4
salal Gaultheria shallon SALA 14.4 18 21.4 24 13 19 7.8 6.4
western red cedar Thuja plicata RECE 4.3 4.9 6.4 4.4 4.4 2.7 3.3 4.2 false azalea Menziesia ferruginea FAAZ 10.7 13 11 10 7.2 3.5 4.7 2.7
bunchberry Cornus unalaschkensis BUBE 1.9 1 5 0.8 13 1.4 4.4 0.7
skunk cabbage Lysichiton americanum SKCA 1.3 0.6 1 0.2 5.4 0.1 4 0.3
Sitka sedge Carex sitchensis SISE 2.1 2.8 2 1.3 3 2.5 2 0.8
fern-leaved goldthread Coptis aspleniifolia GOTH 0.2 0.1 1.5 0.6 5.4 0.3 1.9 0.5
mountain hemlock Tsuga mertensiana MOHE 0 0 0 0 0.3 0.3 0.9 1
heart-leaved twayblade Listera cordata HLTW 0 0 0.1 0.2 0.3 0.8 0.8 1
Sitka spruce Picea sitchensis SISP 1.7 4.3 2.1 5 1.7 1.9 0.9 0.8
deer fern Blechnum spicant DEFE 0.5 0.5 0.6 0.5 1.6 0.7 1.1 0.5
carex sp. Carex sp. SEDGE 0 0 0 0.4 1.4 1.7 1.2 0.4
grass spp. Poaceae sp. GRASS 6.1 0.6 3.7 0.8 1.1 0.7 0.7 0.7
western yew Taxus brevifolia WEYE 0.6 0.8 0.8 1.1 0.4 0.9 0.3 1
false lily-of-the-valley Maianthemum dilatatum FALV 0.1 0 0.3 0.3 0.6 0.4 0.6 0.5 five-leaved bramble Rubus pedatus FIBR 0.2 0.1 0.3 0.3 0.9 1 0.6 0.3
Note: Only species with an average percent cover of 0.5% or more in exclosures and control plots are shown. Species in decreasing order of mean percent cover in 2009.
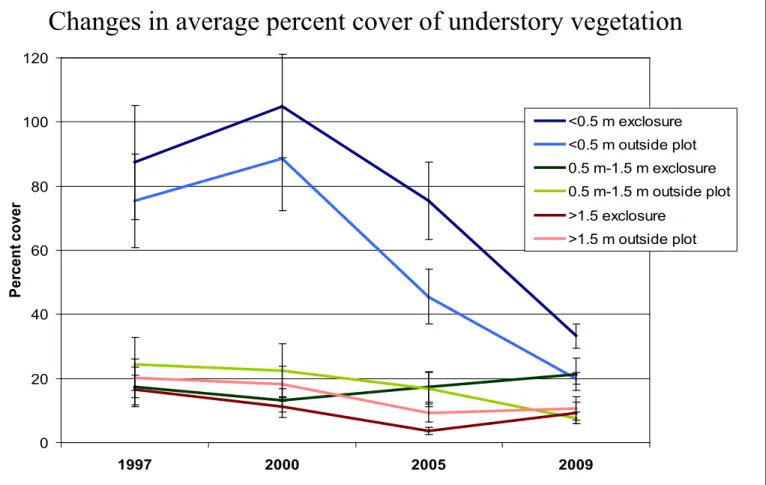
The changes in average understory vegetation percent cover in the exclosures and control plots over 12 years in the three height classes is shown in Figure 4. The BACIP tests revealed that the change (exclosure - control plot) in average percent cover of all understory vegetation between 1997 and 2009 was not statistically significant for the lowest height strata (0 m – 0.5 m) and the highest height stratum (1.5 m – 4 m). However, the change in percent cover in the middle height stratum (0.5 m to 1.5 m) between 1997 and 2009 was statistically significant (P=0.0027). The average percent cover of
CemOA
: archive
ouverte
d'Irstea
understory vegetation increased in the exclosures from 1997 to 2009, while it decreased in the control plots. The protection from deer therefore had a positive effect on the vegetation in the medium height class, which is below the browse line.
Figure 4. Changes in average percent cover of understory vegetation
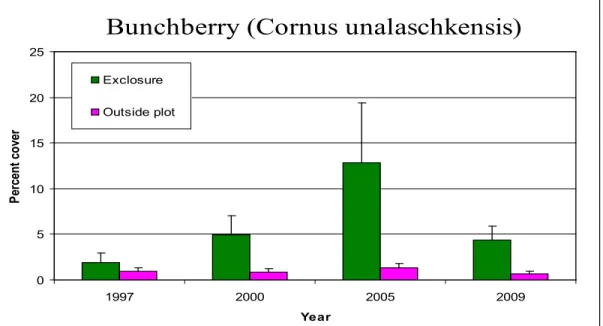
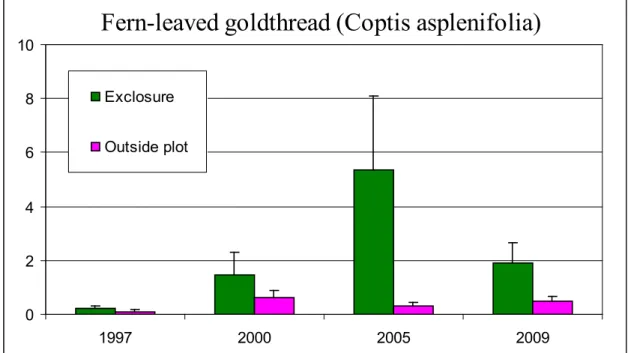
When the BACIP tests were used to compare changes in average total cover for all of the species groups (trees, shrubs, herbs, ferns and graminoids), none of the results were statistically significant. Therefore, the protection from deer had no effect on the average vegetation cover grouped by species type. When BACIP tests were performed on each individual species, the change in average percent cover from 1997 to 2009 was statistically significant for bunchberry (P=0.0149) and marginally significant for fern-leaved goldthread (P=0.0549). Both of these species increased in abundance inside the
0 20 40 60 80 100 120 1997 2000 2005 2009 Per cen t co ver <0.5 m exclosure <0.5 m outside plot 0.5 m-1.5 m exclosure 0.5 m-1.5 m outside plot >1.5 exclosure >1.5 m outside plot
Changes in average percent cover of understory vegetation
CemOA
: archive
ouverte
d'Irstea
exclosures. These results are consistent with those found by Kaknevicius (2008), however there was no significant increase in skunk cabbage between 1997 and 2009, while there was in 2005 (Kaknevicius 2008). This could be a result of seasonal differences in sampling times. Figures 5 and 7 illustrate the changes in percent cover of bunchberry and fern-leaved goldthread over the four sampling years. The error bars represent standard error.
Bunchberry (Cornus unalaschkensis)
0 5 10 15 20 25 1997 2000 2005 2009 Year Per cen t co ver Exclosure Outside plot
Figure 5. Changes in average percent cover of bunchberry over time
Figure 6. Photographs of bunchberry plants in exclosures
Photos by Annie McKenzie
CemOA
: archive
ouverte
d'Irstea
Fern-leaved goldthread (Coptis asplenifolia)
0 2 4 6 8 10 1997 2000 2005 2009 Exclosure Outside plotFigure 7. Changes in average percent cover of fern-leaved goldthread over time
Figure 8. Photographs of fern-leaved goldthread (E-flora BC 2009)
5.3
Vegetation Community Composition
The results of the PRDA with plot effects removed as covariates showed that the exclosure treatment was significant (P=0.0002) when the data was log-transformed, however it was not significant (P= 0.3534) when the data was not log-transformed. The
Photos by E-flora BC CemOA : archive ouverte d'Irstea / Cemagref
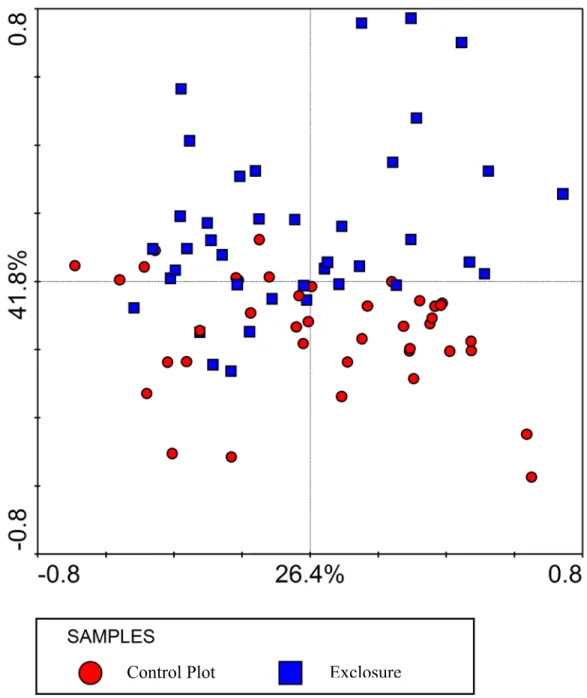
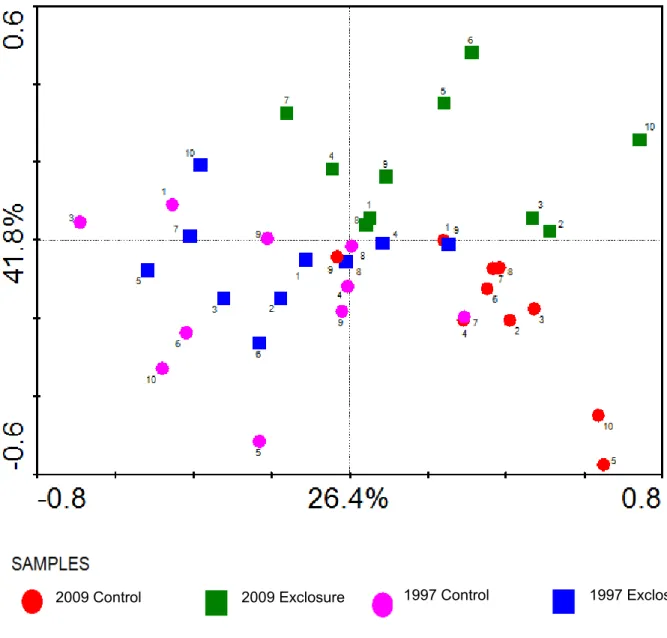
differences between excluded and non-excluded plots are therefore not to be found within the most abundant species. The results of the PPCA analysis, where plot effects were removed as covariates, are shown in the ordination diagrams in Figure 9 and Figure 10. Figure 9 illustrates that axis 2 (vertical axis) represents the treatment effect, which accounts for 15.4% of the within-plot variation in species composition. Figure 10 illustrates that Axis 1 (horizontal axis) represents the year effect, which accounts for 26.4% of the within-plot variation in community composition. This ordination diagram clearly shows the divergence in species composition between the exclosures and the control plots over time.
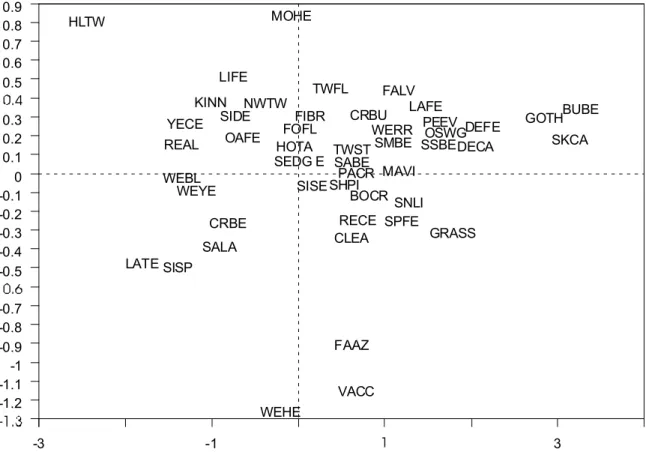
The results of the PRDA with treatment used as constraining environmental variables emphasized the species that contributed most to the treatment differences (the differences between the exclosures and the control plots). The species ordination diagram in Figure 11 illustrates these differences. The four letter codes represent species (see Appendix I for a list of corresponding species names). The species to the right of the diagram were more closely associated with exclosures, while species falling to the left of the diagram were more closely associated with control plots. The species that were the most closely associated with the exclosures, in order of importance were bunchberry, skunk cabbage, fern-leaved goldthread, deer fern (Blechnum spicant) and deer-cabbage. These results suggest that these species are sensitive to deer browsing. The species that were most associated with control plots, in order of importance were heart-leaved twayblade (Listera cordata), Labrador tea (Ledum groenlandicum), Sitka spruce, red alder (Alnus rubra) and western bog-laurel (Kalmia microphylla).
CemOA
: archive
ouverte
d'Irstea
Figure 9. Samples ordination diagram showing the results of the partial principal components analysis (PPCA) from which the plot effects were removed as covariates. The samples are classified according to treatment.
Control Plot Exclosure
CemOA
: archive
ouverte
d'Irstea
Figure 10. Samples ordination diagram showing the results of the partial principal components analysis (PPCA) from which the plot effects were removed as covariates.
Note: The samples are classified according to treatment and years. The results from 2000 and 2005 were excluded from this diagram in order to highlight the divergence in species composition over time. The numbers in the diagram correspond to the site numbers shown in Figure 1. 2009 1997 Control 1997 Exclosure 2009 Control 2009 Exclosure CemOA : archive ouverte d'Irstea / Cemagref
Figure 11. Species ordination diagram for partial redundancy analysis (PRDA) with treatment used as constraining environmental variables.
Note: The four letter codes represent species (see Appendix I), and the species to the right of the diagram were more associated with exclosures, while species falling to the left of the diagram were more closely associated with control plots.
5.4
Plant Reproduction
The proportion of exclosures and control plots with plants with flowers or fruit are shown in Figure 12 for each species. The null hypothesis that stated that the proportion of fruits and flowers is the same in the exclosures and control plots was rejected when Chi-square tests were performed for bunchberry, and Vaccinium sp. The proportion of plots with flowering plants was significantly higher in the exclosures than the control plots (χ2=7.9142, d.f. = 1, P=0.0049) and the same was true for Vaccinium sp.
(χ2=5.8122, d.f. = 1, P=0.0159). The fisher’s exact test also revealed that the proportion
-3 -1 3 0.9 0.8 0.7 0.6 0.5 0.3 0.2 0.1 0 -0.1 -0.2 -0.3 -0.4 -0.5 -0.7 -0.8 -0.9 -1 -1.1 -1.2 BOCR BUBE CLEA CRBE CRBU DECA DEFE FAAZ FALV FIBR FOFL GOTH GRASS HLTW HOTA KINN LAFE LATE LIFE MAVI MOHE NWTW OAFE OSWG PACR PEEV REAL RECE SABE SALA SEDG E SHPI SIDE SISE SISP SKCA SMBE SNLI SPFE SSBE TWFL TWST VACC WEBL WEHE WERR WEYE YECE CemOA : archive ouverte d'Irstea / Cemagref
of plots with flowering plants of fern-leaved goldthread was significantly higher in the exclosures than in the control plots (P=0.0152). There was no statistically significant difference in the proportion of flowers or fruit between the exclosures and control plots for all other species. However, the species that were found to be more closely associated with the exclosures in the ordination diagram in Figure 11 generally had a higher proportion of flowers or fruits within the exclosures than the control plots. Deer cabbage was only observed at one site in 2009, therefore the results were not included in the chi-square analysis. However, at this site many of the Deer cabbage plants inside the exclosure were in flower, while the plants in the control plot did not have any flowers.
Proportion of plots with flowers or fruit in 2009
0 10 20 30 40 50 60 70 80 bunc hber ry fern-l eaved gol dthread vaccini um sp. false azalea skun k cab bage salmo nber ry five-l eaved br amble heart -leav ed tway blade salal Species Per cen t ( % ) Exclosure Control
Figure 12. The proportion of plots containing plants with reproductive structures (flowers or fruit) in 2009. CemOA : archive ouverte d'Irstea / Cemagref
5.5
Overstory Canopy Cover and Ground Cover
Most of the ground cover did not change significantly between 1997 and 2009. However, the results of the BACIP test showed that the differences in changes in moss cover in the exclosures and the control plots was significant between 1997 and 2009 (P=0.0441). The change in average percent cover of moss is shown in Figure 13 (the error bars represent standard error). The average percent cover of moss increased in the control plots, and decreased in the exclosures. There were no statistically significant differences between the change in litter cover or canopy cover between 1997 and 2009.
Change in average moss cover
0 20 40 60 80 100 1997 2009 Year Aver ag e p er cen t co ver Exclosure Control
Figure 13. Change in average percent cover of moss in exclosures and control plots
6
Discussion
6.1
Impact of deer on plant species richness
Decreased plant diversity has been recorded for many forest ecosystems affected by moderate to high deer densities (Anderson and Katz 1993, Woodward et al. 1994, deCalesta 1997, Gill and Beardall 2001). However, Stockton et al. (2005) points out that
CemOA
: archive
ouverte
d'Irstea
these studies generally occurred in contexts where other factors, such as logging, may have played a role in emerging species richness patterns. The results of this study showed that deer do not have a significant impact on understory plant species richness, which confirms the results that Kaknevicius (2008) and Stroh (2008) found for the data in 2005. These results are consistent with other deer exclosure experiments which have shown that overall species richness shows little response to protection from deer browsing (Kraft et al. 2004, Nomiya et al. 2002).
Several authors have put forth hypotheses to explain these results. Nomiya et al. (2002) found that environmental heterogeneity, soil variables and natural disturbances have a stronger effect on overall species richness than deer browsing. Stroh (2008) points out that the impact of deer on species richness will be largely dependent on deer densities. At intermediate densities, deer can increase species richness by consuming competitively dominant plant species (Hester et al. 2000, Suzuki et al. 2008). However, at very high densities, only browse-tolerant species will be able to persist, and some species will be eliminated (Stroh 2008). It may be that high deer densities on Graham Island eliminated certain species from the study sites before the exclosures were established, or it could also be that intermediate deer densities have maximized species richness on Graham Island by consuming competitively dominant plant species. Additional studies on deer density gradients and population dynamics would need to be carried out on Graham Island to understand how deer densities affect the total number of plant species in these old-growth forests.
CemOA
: archive
ouverte
d'Irstea
Although deer did not have a significant impact on the total number of understory plant species, a considerably large proportion (over 20%) of the species were unique to either the exclosures or control plots. However, because this 20% is almost equally distributed between the exclosures and control plots, it does not seem to indicate a change in species composition. The small size of the sample plots (25m2) meant that the
appearance of a species in an exclosure, but not in a paired control plot could simply be due to chance. Many of these species, such as pearly everlasting, were only present in trace amounts and were only found in one exclosure or control plot. Species richness in both the exclosures and the control plots increased over the 12 year study period, but this is likely because of an increase in observer’s expertise.
6.2
Impact of deer on plant abundance
In general, the understory plants in the study sites were mostly long-lived, slow-growing species that are common in the old-growth forests of Haida Gwaii. The average percent cover of all species was fairly low in both the exclosures and the control plots. Previous studies on Haida Gwaii have noted that deer feed on understory vegetation mainly between 0 m and 1.5 m above the ground, and this creates a visible browse line in the vegetation (as shown in Figure 3). Kaknevicius (2008) did not find any significant differences in overall average percent cover in any of the three height strata for the data in 2005. However, after four more years of deer exclusion, the medium height stratum (0.5 m to 1.5 m) is finally significantly higher in the exclosures. This confirms the hypothesis that deer have a direct negative impact on the vegetation below the 1.5 m browse limit. The upper height stratum could be indirectly affected by deer browsing, as browsing in the medium stratum could limit the recruitment into the highest height
CemOA
: archive
ouverte
d'Irstea
stratum (Stroh 2008), however this was not evident in our results. It is likely that a much longer time-frame is needed to be able to detect the indirect changes in the highest height stratum as a result of deer browsing.
A decreased abundance of vegetation in the medium height class of old-growth forest understories has important negative ecological, social, cultural and economic impacts. These impacts are discussed in detail in the report by Kaknevicius (2008). It is important to note that the impact of deer on the abundance of understory vegetation below the browse line is likely higher in areas that are further from roads and hunters. As all of the study sites were located near roads and were accessible to hunters, browsing stress was likely lower than in more remote areas. For example, Martin and Baltzinger (2002) showed that red cedar regeneration was much higher in areas where deer were exposed to hunting. They attributed this to the fact that hunting changes deer behaviour (deer spend less time browsing and more time looking around for hunters), rather than the actual reduction in deer numbers.
6.3
Impact of deer on plant community composition
The results of the multivariate analyses in this study clearly showed that there was a divergence in species composition in the exclosures and the control plots. Differences in species composition between exclosures and control plots have also been noted by several other authors (Casabon and Pothier 2008, Anderson and Katz 1993, Gill and Beardall 2001, Morecroft et al. 2001.) These authors point out that at high deer densities, palatable species that are preferred by deer grow scarce or disappear and are replaced by less sought after species (deCalesta 1997, Reyes and Vasseur 2003, Rooney and Waller
CemOA
: archive
ouverte
d'Irstea
2003, Kraft et al. 2004, Casabon and Pothier 2008, Rooney 2009). Similar results were found in this study.
The species that were the most closely associated with the exclosures, such as bunchberry, skunk cabbage, fern-leaved goldthread, deer fern and deer-cabbage, are all important forage species for Sitka black-tailed deer and have high nutritional value (Hanley and McKendrick 1983). The species that were most associated with the control plots such as heart-leaved twayblade and Labrador tea are known to be low in digestibility for deer (Hanley and McKendrick 1983). The results of the PPCA therefore seem to show a divergence in community composition based on the palatability of the understory plant species.
A study on the diet composition of Sitka black-tailed deer in Southeast Alaska revealed that bunchberry was the most important forage species, representing approximately 29% of their diet (Kirchhoff and Larsen 1998). This is reflected in our results, as bunchberry was the species most affected by the protection from deer and showed a significant positive increase in abundance from 1997 to 2009 within the exclosures. Kirchhoff and Larsen (1998) found that red huckleberry (Vaccinium
parviflorum) composed 13% of deer diets in Southeastern Alaska, followed by western
red cedar at 9% and skunk cabbage at 5%. Although the PPCA analysis showed that
Vaccinium sp., western red cedar and skunk cabbage were associated with the exclosures
in our study, these species did not show significant increases in abundances from 1997 to 2009. The fact that our experiment did not reveal any significant impact on the abundance of Red huckleberry could be due to the fact that Vaccinium sp. was only identified to the genus level. Kirchhoff and Larsen (1998) showed that although red
CemOA
: archive
ouverte
d'Irstea
huckleberry was a preferred forage species of Sitka black-tailed deer, other species of
Vaccinium (such as early blueberry (Vaccinium ovalifolium) and Alaska blueberry (Vaccinium alaskaense)) only contributed minor components to deer diets, despite being
the most abundant and widely available browse species in the area. In order to quantify the impact of Sitka black-tailed deer on Red huckleberry on Graham Island, Vaccinium would need to be identified to the species level.
Although western red cedar did not show a significant increase in total average abundance inside the exclosures in this study, previous results of this long-term monitoring experiment have shown that deer browsing had a drastic and negative effect on both red cedar survival and the number of leafed shoots per individual (Stroh et al. 2008). It appears that the measurements of plant morphology used by Stroh et al. (2008) such as measurements of individual height, number of leafed shoots, number of stems and seedling survival are more sensitive indicators of deer browsing than community measurements such as richness and cover.
6.4
Impact of deer on plant reproduction
Plant reproduction is another sensitive indicator of the impacts of deer browsing. The results of this study showed that bunchberry, fern-leaved goldthread and Vaccinium
sp. all had significantly higher proportions of plants with fruits or flowers inside the
exclosures than in the control plots. Although the other plants did not show statistically significant differences, all species had higher proportions of flowers inside the exclosures than in the control plots. In fact, skunk cabbage, salmonberry (Rubus spectabilis), five-leaved bramble (Rubus pedatus) and deer cabbage were never found flowering in any of the control plots. heart-leaved twayblade and salal had almost equal proportions of
CemOA
: archive
ouverte
d'Irstea
flowers in the exclosures and the control plots, and this is consistent with the fact that they are not easily digestible by deer, and are likely resistant to deer browsing (Kirchhoff and Larsen 1998). Stockton et al. (2005) found that salal was one of the only shrubs that remained on small islands in the south of Haida Gwaii that were heavily impacted by deer browsing (Stockton et al. 2005). Although these results give some indication of the effects of deer on understory plant reproduction, individual plant measurements (such as the number of plants in flower, and the number of flowers per plant) would likely reveal more pronounced differences between the exclosures and the control plots.
6.5
Changes in ground cover and canopy cover
The results of this study showed that the average percent cover of moss increased significantly in the control plots, while it decreased in the exclosures from 1997 to 2009. Mosses are known to have little nutritional value to deer, and therefore mosses can out-compete plants that are sensitive to deer browsing (Hanley and McKendrick 1983). As the successful establishment of understory plants and tree seedlings is dependent on the quality and type of ground cover (Kumar and Shibata 2007), an increase in moss cover could inhibit the establishment of some species. Kaknevicius (2008) hypothesized that changes in overstory conditions could play an important role in determining the composition and abundance of understory vegetation communities, however our results did not support this hypothesis, as there was no significant change in canopy cover between 1997 and 2009. CemOA : archive ouverte d'Irstea / Cemagref
7
Recommendations
7.1
Practical recommendations
Although we are beginning to see differences in plant communities following 12 years of deer exclusion, the richness and cover of flora in the understory will continue to change, and long term monitoring for more than 20 years could reveal different patterns for species richness and percent cover, therefore this experiment should be continued. The results of this study showed that plant morphology and reproductive structures appear to be sensitive indicators of deer browsing, and these measurements could be included in this long-term monitoring experiment. This is especially important for species that are sensitive to deer browsing such as bunchberry and Fern-leaved gold thread. As some of the variation in the long-term data could be a result of differences in observer expertise, it would be beneficial to maintain observer continuity in this experiment over the long-term.
As mentioned earlier, several groups of plants in this long-term monitoring experiment were not identified to the species level, including grasses, sedges and
Vaccinium species. In order to gain a complete picture of the plant community
composition in these study sites, it is important to identify all the plants to the species level. The Haida Gwaii Forest District could facilitate this by creating a plant herbarium for Haida Gwaii in cooperation with the Haida Gwaii Museum. This would be an extremely useful tool not only for this long-term monitoring experiment, but also for assisting other researchers and local community members in identifying the plants of Haida Gwaii. I would also recommend that the exclosures continue to be used as an
CemOA
: archive
ouverte
d'Irstea
educational tool for local students and communities. Finally, several of the exclosures were damaged by fallen trees, and these exclosures need to be repaired if this experiment is to continue over the long-term.
7.2
Recommendations for future research
Although this research illustrates the impact of deer on common understory plant species, it does not show how deer are affecting threatened or endangered species, as these species were not present in any of the study sites. Furthermore, many species which are culturally significant to the Haida, such as Devil’s club (Oplopanax horridus) and known to be susceptible to deer browsing were not present in the study sites. This could be an indication that these species have already disappeared from many of the old-growth forests on Haida Gwaii. Additional research could focus specifically on the impacts of deer on culturally significant, endemic or endangered and threatened plant species.
Deer browsing has important impacts on the understory vegetation in the temperate rainforests of Haida Gwaii, however industrial logging, as defined by large scale clear-cut harvesting and extensive road development, has also had profound effects on forest ecosystems. Deer research could be greatly enriched by accounting for the dramatically altered landscape that exists around the remaining old-growth forests. Although several studies have looked at the impact of deer browsing on the regeneration of tree seedlings in second-growth and clear-cut stands (eg. Martin and Baltzinger 2002), less is known about the combined impacts of deer browsing and logging on forest understory plants. As the province of British Columbia moves towards ecosystem based forest management, I would argue that a better understanding of the interaction between forest harvest and deer is critical to maintaining and managing biodiversity in managed
CemOA
: archive
ouverte
d'Irstea
forests, not only for tree species but for all understory plants. I therefore recommend that deer herbivory should be studied and managed in the context of current and past forest management practices in Haida Gwaii.
8
Conclusion
In conclusion, deer on Graham Island are having a significant impact on the abundance of understory vegetation in the medium height class (0.5 m – 1.5 m) and they are shifting the community composition of understory vegetation towards less palatable species. The plant species that were most affected by deer browse on Graham Island were important forage species for Sitka black-tailed deer in their natural habitat in Alaska (Kirchhoff and Larsen 1998). Deer seem to be preferentially browsing nutrient rich forbs rather than less palatable species, and this is an indication that deer populations on Graham Island have likely not reached their ecological carrying capacity. This is in contrast to the impacts of deer on smaller islands in Laskeek bay, where the entire shrub and herb layers of the understory vegetation have been eliminated and less palatable species such as Sitka spruce are heavily browsed. More research is needed to better understand the impacts of deer on understory vegetation in the old-growth forests of Haida Gwaii. CemOA : archive ouverte d'Irstea / Cemagref
9
Literature cited
Allombert, S., Gaston, A.J., and J.L. Martin. 2005a. A natural experiment on the impact of overabundant deer on songbird populations. Biological Conservation 126: 1-13. Allombert, S., Stockton, S.A., & Martin, J.-L. 2005b A natural experiment on the impact of
overabundant deer on forest invertebrates. Conservation Biology, 1917-1929.
Alverson, W.S., Waller, D.M., Solheim, S.L., 1988. Forests too deer: edge effects in Northern Wisconsin. Conservation Biology 2, 348–358.
Anderson, R.C., and A.J. Katz. 1993. Recovery of browse-sensitive tree species following release from white-tailed deer Odocoileus virginianus zimmerman browsing pressure. Biological Conservation 63: 203-208.
Baines, D., Sage, R.B., Baines, M.M., 1994. The implications of red deer grazing to ground vegetation and invertebrate communities of Scottish native pinewoods. Journal of Applied Ecology 31, 776–783.
Banner, A., Pojar, J., Schwab, J.W., Trowbridge, R., 1989. Vegetation and soils of the Queen Charlotte Islands: recent impacts of development. In: Scudder, G.G.E., Gessler, N. (Eds.), The Outer Shores. Queen Charlotte Islands Museum Press, Skidegate, Haida Gwaii, BC, Canada, pp. 261–279.
B.C. Ministry of Environment. n.d. Environmental Stewardship Division: Government of British Columbia. Online: http://www.env.gov.bc.ca/atrisk/toolintro.html. Accessed December 4th, 2009.
Casabon, C., Pothier, D. 2008. Impact of deer browsing on plant communities in cutover sites on Anticosti Island. Ecoscience, 15 (3), pp. 389-397.
Coomes, D.A., Allen, R.B., Forsyth, D.M., and W.G. Lee. 2003. Factors preventing the recovery of New Zealand forests following control of invasive deer. Conservation Biology 17: 450-459.
Daufresne T., Martin J.L., 1997. Changes in vegetation structure and diversity as a result of browsing by a large herbivore: the impact of introduced black-tailed deer in the primary forest of Haïda Gwaii, British Columbia. In Gaston A.J. (Ed.), Laskeek Bay Research, vol. 7, Laskeek Bay Conservation Society, Queen Charlotte City, B.C, pp. 2 – 26
deCalesta, D.S., 1997. Ecosystem management for deer. In: McShea, W.J., Rappole, J.H., Underwood, H.B. (Eds.), The Science of Overabundance: Deer Ecology and Population Management. Smithsonian Institute, Washington, DC, pp. 267–279.
Douglas, G.W., Straley, G.B., Meidinger, D., 1998. Rare Native Vascular Plants of British Columbia. Ministry of Environment, Lands and Parks, Victoria, BC.
CemOA
: archive
ouverte
d'Irstea
Douglas, G.W., D.V. Meidinger, and J. Pojar (Editors). 2001. Illustrated Flora of British Columbia, Volume 6: Monocotyledons (Acoraceae through Najadaceae). B.C. Min. Environ., Lands and Parks, and B.C. Min. For., Victoria, B.C. 361 pp.
E-flora of British Columbia. Plant photographs. Online: http://www.eflora.bc.ca/. Accessed on December 12th, 2009.
Engelstoft, C., 2001. Effects of Sitka Black-tailed Deer (Odocoileus hemionus sitkensis) on understory in old-growth forest on Haida Gwaii (Queen Charlotte Islands). Master of Science, University of Victoria, British Columbia, Canada.
Flowerdew, J.R., Ellwood, S.A., 2001. Impacts of woodland deer on small mammal ecology. Forestry 74, 277-287.
Gaston, A.J., 2002. Vegetation changes on Reef Island following a reduction in deer numbers. In: Conference Summary Lessons from the Islands: Introduced Species and What They Tell us About How EcosystemsWork, Queen Charlotte City and Skidegate, October. Research Group on Introduced Species (RGIS), pp. 20–21.
Gaston, A.J., Stockton, S.A., and J.L. Smith. 2006. Species-area relationships and the impact of deer-browse in the complex phytogeography of the Haida Gwaii archipelago (Queen Charlotte Islands), British Columbia. Ecoscience 13: 511-522.
Gill, R.M.A. 1999. Deer management to protect forest vegetation, a British perspective. In: Wiggins, G.G. (Ed.), Proceedings of the Cedar Symposium, Queen Charlotte Islands, BC, May 28–30, 1996. Ministry of Forests MRO94, Victoria, BC, pp. 59–68.
Gill, R.M.A. and Beardall, V. 2001. The impact of deer on woodlands: The effects of browsing and seed dispersal on vegetation structure and composition. Forestry, 74: 209-218.
Gill, R.M.A., Fuller, R.J., 2007. The effect of deer browsing on woodland structure and songbirds in lowland Britain. Ibis 149, 119-127.
Golumbia, T.E. 1999. Introduced Species Management in Haida Gwaii (Queen Charlotte Islands). Proceedings of a Conference on the Biology and Management of Species and Habitats at Risk, Kamloops, BC, 15-19, Feb.
Hanley, T.A., and J.D. McKendrick. 1983. Seasonal changes in chemical composition and nutritive value of native forages in a spruce-hemlock forest, south-eastern Alaska. United States Department of Agriculture, Forest Service, Pacific Northwest Forest and Range Experiment Station. 41 pp.
Hester, A.J, Edenius, L., Buttenschon, R.M., Kuiters, A.T., 2000. Interactions between forests and herbivores: the role of controlled grazing experiments. Forestry 73, 381-391. HG SLUA: Haida Gwaii Strategic Land Use Agreement 2007. Online:
http://ilmbwww.gov.bc.ca/slrp/docs/Haida_SLUPA_Dec_07.pdf. Accessed November 8th 2009.
Hobbs, N.T., 1996. Modifcation of ecosystems by ungulates. Journal of Wildlife Management 60, 695–713. CemOA : archive ouverte d'Irstea / Cemagref
Horsley, S.B., Stout, S.L., Decalesta, D.S., 2003. White-Tailed deer impact on the vegetation dynamics of a northern hardwood forest. Ecological Applications 13, 98–118.
Kaknevicius, J. 2008. Analyzing the recovery of understory vegetation following the removal of deer on Graham Island, British Columbia. Masters of Forest Conservation final project. University of Toronto.
Kirby, K.J., 2001. The impact of deer on the ground flora of British broadleaved woodland. Forestry 94, 219-229.
Kirchhoff, M.D., Larsen, D.N. 1998. Dietary overlap between native Sitka black-tailed deer and introduced elk in southeast Alaska. Journal of Wildlife Management, 62 (1), pp. 236-242 Kraft, L.S., Crow, T.R., Buckley, D.S., Nauertz, E.A., and J.C. Zasada. 2004. Effects of
harvesting and deer browsing on attributes of understory plants in northern hardwood forests, Upper Michigan, USA. Forest Ecology and Management 199: 219-230.
Kumar, S., and E. Shibata. 2007. Establishment and growth of coniferous seedlings in an altered forest floor after long-term exclusion of deer. Journal of Forest Research 12: 306-311. Leps, J. and Smilauer, P. 2003. Multivariate Analysis of Ecological Data using Conoco. Faculty
of Biological Sciences, University of South Bohemia, Ceske Budejovice.
Martin J.L & Daufresne T., 1999. Introduced species and their impacts on the forest ecosystem of Haïda Gwaii. In Proceedings of the Canada – British Columbia South Moresby Forest Replacement Account, Victoria, B.C. Edited by G. Wiggins. Canada – British Columbia South Moresby Forest Replacement Account, B.C. Ministry of Forests, Victoria, B.C, pp. 69–89.
Martin, J.L., Baltzinger, C., 2002. Interaction among deer browsing, hunting and tree regeneration. Canadian Journal of Forest Research 32, 1254–1264.
McShea, W.J., Underwood, H.B., Rappole, J.H. (Eds.), 1997. The Science of Overabundance: Deer Ecology and Population Management. Smithsonian Institute, Washington, DC. Morecroft, M. Taylor, E. Ellwood, S. and Quinn, A. 2001. Impacts of deer herbivory on ground
vegetation at Wytham Woods, central England. Forestry, 74 : 251-257.
Nomiya, H., Suzuki, W., Kanazashi, T., Shibata, M., Tanaka, H., Nakashizuka, T., 2002. The response of forest floor vegetation and tree regeneration to deer exclusion and disturbance in a riparian deciduous forest, central Japan. Plant Ecology 164, 263-276.Nugent et al. 2001 Pojar, J., Lewis, T., Roemer, H., Wilford, D.J., 1980. Relationship between introduced black-taile
deer and the plant life of the Queen Charlotte islands, British Columbia. Unpublished report, B.C Ministry of Forests, Smithers, B.C
Pojar, J. and Mackinnon, A. 1994. Plants of the Pacific Northwest Coast. Lone Pine, Vancouver, British Columbia. CemOA : archive ouverte d'Irstea / Cemagref
Pojar, J. 2002. An introduction to the plant ecology of Haida Gwaii. Lessons from the Islands: introduced species and what they tell us about how ecosystems work. Proceedings from the Research Group on Introduced Species 2002 Symposium, Queen Charlotte City, Queen Charlotte Islands, British Columbia. Canadian Wildlife Service, Environment Canada, Ottawa. October 1-5 2002.
Pojar, J., Klinka, K., and D.A. Demarchi. n.d. Chapter 6: Coastal Western Hemlock Zone. Online: http://www.for.gov.bc.ca/hfd/pubs/docs/Srs/Srs06/chap6.pdf. Accessed December 2nd 2009.
Reyes, G. and Vasseur, L. 2003. Factors influencing deer browsing damage to red spruce (Picea rubens) seedlings in coastal red spruce-balsam fir stands of southwestern Nova Scotia. Forest Ecology and Management, 186: 349-357.
RGIS 2009. Research Group on Introduced Species website. Online: http://www.rgisbc.com/Home.html. Accessed October 15th 2009.
Rooney, T.P., Dress, W.J., 1997. Patterns of plant diversity in overbrowsed old growth and mature second growth hemlock-northern hardwood forest stands. Journal of the Torrey Botanical Society 124, 43–51.
Rooney, T.P., Waller D.M., 2003. Direct and indirect effects of white-tailed deer in forest ecosystems. Forest Ecology and Management 181, 165-176.
Rooney, T.P. 2009. High white-tailed deer densities benefit graminoids and contribute to biotic homogenization of forest ground-layer vegetation. Plant Ecology 202:103–111.
Russell, F.L., Zippin, D.B., and N.L. Fowler. 2001. Effects of White-tailed Deer (Odocoileus virginianus) on plants, plant populations and communities: A Review. American Midland Naturalist 146: 1-26.
SAS Institute Inc. 2000. Statistical Analysis Software, Version 9. Cary, NC SAS Institute Inc. Smith, E.P. 2002. BACI design. Encyclopedia of Environmetrics. pp. 141-148. Online:
http://www.stat.org.vt.edu/vining/smith/B001-_o.pdf. Accessed October 2 2009.
Stockton, S.A., Allombert, S., Gaston, A.J., & Martin, J.-L. 2005. A natural experiment on the effects of high deer densities on the native flora of coastal temperate rain forests. Biological Conservation, 126:118-128.
Stroh 2008. Grands herbivores et diversite de la vegetation en forest temperee: Une approche experimentale. Masters of Science thesis. University Pierre Marie Curie.
Stroh, N., Baltzinger, C., and J.L. Martin. 2008. Deer prevent western redcedar (Thuja plicata) regeneration in old-growth forests of Haida Gwaii: Is there a potential for recovery? Forest Ecology and Management 255: 3973-3979.
Sullivan, T.P., Harestad, A.S., Wilkeem, B.M., 1990. Control of mammal damage. In: Lavender, D.P., Parish, R., Johnson, C.M., Montgomery, G., Vyse, A., Willis, R.A., Winston, D. (Eds.), Regenerating British Columbia Forests. University of British Columbia Press, Vancouver, pp. 8–34. CemOA : archive ouverte d'Irstea / Cemagref
Suzuki, M., Miyashita, T., Kabaya, H., Ochiai, K., Asada, M., Tange, T., 2008. Deer density affects ground-layer vegetation differently in conifer plantations and hardwood forests on the Boso Peninsula, Japan. Ecological Research.
Tilghman, N.G., 1989. Impacts of white-tailed deer on forest regeneration in northwestern Pennsylvania. Journal of Wildlife Management 53, 524–532.
Ter Braak, C.J.F. and Smilauer, P. 2002. CANOCO and CanoDraw for Windows: Software for Canonical Community Ordination (Version 4.5). Ithaca, New York.
Vila, B., Guibal, F., Torre, F., & Martin, J.-L. 2004. Assessing spatial variation in browsing history by means of fraying scars. Journal of Biogeography, 31, 987-995
Waller, D.M., Alverson, W.S., 1997. The white-tailed deer: a keystone herbivore. Wildlife Society Bulletin 25, 217–226.
Wardle, D.A. Barker, G.M., Yeates, G.W., Bonner, K.I., and A. Ghani. 2001. Introduced browsing mammals in New Zealand natural forests: aboveground and belowground consequences. Ecological Monograph’s 71: 587-614.
Whitney, G.G., 1984. Fifty years of change in the arboreal vegetation of Heart’s Content, an old growth hemlock-white pine-northern hardwood stand. Ecology 65, 403–408.
Woodward, A., Schreiner, E.G., Houston, D.B., Moorhead, B.B., 1994. Ungulate-forest
relationships in Olympic national park: retrospective exclosure studies. Northwest Science 68, 97–110. CemOA : archive ouverte d'Irstea / Cemagref