RESEARCH OUTPUTS / RÉSULTATS DE RECHERCHE
Author(s) - Auteur(s) :
Publication date - Date de publication :
Permanent link - Permalien :
Rights / License - Licence de droit d’auteur :
Bibliothèque Universitaire Moretus Plantin
Institutional Repository - Research Portal
Dépôt Institutionnel - Portail de la Recherche
researchportal.unamur.be
University of Namur
Colour control of titanium nitride coatings produced by reactive magnetron sputtering
at temperature less than 100°C
Roquiny, Philippe; Bodart, Franz; Terwagne, Guy
Published in:
Surface and Coatings Technology
Publication date: 1999
Document Version
Publisher's PDF, also known as Version of record
Link to publication
Citation for pulished version (HARVARD):
Roquiny, P, Bodart, F & Terwagne, G 1999, 'Colour control of titanium nitride coatings produced by reactive magnetron sputtering at temperature less than 100°C', Surface and Coatings Technology, no. 116-119, pp. 278-283.
General rights
Copyright and moral rights for the publications made accessible in the public portal are retained by the authors and/or other copyright owners and it is a condition of accessing publications that users recognise and abide by the legal requirements associated with these rights. • Users may download and print one copy of any publication from the public portal for the purpose of private study or research. • You may not further distribute the material or use it for any profit-making activity or commercial gain
• You may freely distribute the URL identifying the publication in the public portal ?
Take down policy
If you believe that this document breaches copyright please contact us providing details, and we will remove access to the work immediately and investigate your claim.
www.elsevier.nl/locate/surfcoat
Colour control of titanium nitride coatings produced by reactive
magnetron sputtering at temperature less than 100
°C
Ph. Roquiny *, F. Bodart, G. Terwagne
Laboratoire d’Analyses par Reactions Nucleaires, Faculte´s Universitaires Notre-Dame de la Paix, rue de Bruxelles 61, B-5000 Namur, Belgium
Abstract
Decorative dry coatings are extensively used nowadays to replace the current pollutant wet coating processes, but the links between the coating appearance and the physical properties are usually not fully understood. This paper presents the results obtained by optical measurements in order to investigate the import of titanium nitride physical properties such as stoichiometry and structure on the coating visual appearance for TiN
xthin films deposited by DC reactive magnetron sputtering at temperature lower than 100°C onto grounded substrate. It was shown that colours going from metallic grey to gold and finally brownish red have been obtained when the N2 flow is raised. These TiNx layer colour variations can be resolved in terms of the Drude model. As titanium metallic bonds decrease in the film, the absorbed part of the spectra moves towards lower energies, and when the minimum titanium content in the deposited films is reached (N2mass flow>4 sccm), defects also reduce the amortised spectra towards slightly more reddish energies, but are difficult to control. In conclusion, as the N2 content in the gas discharge guides the nitrogen composition, it is the key parameter in colour control for TiN
xsputtered films, especially when N2mass flow is less than 4 sccm. © 1999 Elsevier Science S.A. All rights reserved.
Keywords: Colour; Magnetron sputtering; PVD; Thin film; TiN
x
1. Introduction ition metal nitrides combine attractive colours with superior wear resistance, good adhesion and chemical stability [9–11]. In this study, TiN
x is deposited by Wet coating processes now require more and more
post-treating for the pollutant by-products as the envi- titanium DC magnetron sputtering in an argon and nitrogen gas mixture. A lot of work has already been ronmental statutes and regulations become more
restrictive. Then, the cost of wet coating technologies done in this field, but the industrial goal determines two original constraints: firstly, the substrate could not be increases as the released by-product norms decrease.
Both US and ECC environmental protection laws [1,2] heated too much to avoid structural change and secondly, to achieve a final ‘in-line’ steel coil-coating condemn the material surface finishers to study new and
clean deposition alternatives. Vapour deposition turns unit, the substrate must be connected to the earth potential.
out to be competitive as a result of water and
liquid-metal bath recycling cost and hazardous solvent banish- It is well known that the most important parameters governing the physical properties of these films are the ment from the wet coating processes. Furthermore,
physical and chemical vapour depositions (PVD and nitrogen partial pressure, the deposition temperature and the substrate bias voltage [12,13]. This study sug-CVD) offer a large variety of material coatings, high
experimental flexibility as well as the minimisation of gests modifying the deposition conditions of TiN x in order to create a range of different coloured films waste disposal [3,4].
Among these waste-free surface processes, reactive dedicated to replacing current decorative coatings pro-duced by wet technologies. In this paper, we investigate magnetron sputtering of nitrides and carbides seems to
offer a great deal of interest in decorative application the influence of nitrogen mass flow w
N2on the titanium nitride physical properties in order to obtain precise for large area substrates [4–8]. For example, the
trans-colour control without heating and biasing tools. Results obtained by optical measurements are discussed in order * Corresponding author. Fax:+32-81725474.
E-mail address: [email protected] (P. Roquiny) to correlate the import of titanium nitride physical 0257-8972/99/$ – see front matter © 1999 Elsevier Science S.A. All rights reserved.
279
P. Roquiny et al. / Surface and Coatings Technology 116–119 (1999) 278–283
properties such as stoichiometry and structure with the 2.3. Composition and structure coating visual appearance.
The nitrogen content in the films was determined using the well-known15N(p,ac)12C nuclear reaction. At a proton energy of 429 keV, a sharp and very intense resonance of this nuclear reaction occurs. An automatic energy scan system mounted on a Van De Graaff
2. Experimental procedure
accelerator is used to obtain an excitation curve, and gives the nitrogen depth profile concentration compared 2.1. Sample preparation
to a standard sample [17–20].
To complete the composition analysis by resonant TiN
xcoatings were produced by DC reactive
magnet-ron sputtering. The vacuum chamber ($0.25 m3) was nuclear reaction (RNRA), Rutherford backscattering spectroscopy ( RBS ) at 140° with a 2.4 MeV 4He beam equipped with a 63.5 cm2 (90 mm diameter) magnetron
cathode and a 1000 l/min turbo molecular pump. The was also performed on the sample. Conventional RBS simulation was computed with the RUMP program to base pressure was less than 5×10⁻⁴ Pa and the
depos-ition working pressure and plasma current density were extract the sample composition from the spectra [20,21]. The structure and crystalline parameters of some maintained respectively at 0.30 Pa and 8 mA/cm2. In
these conditions, the sample temperature measured with remarkable layers were also analysed by glancing angle X-ray diffraction of the Co Ka wavelength (1.7902 A˚) a thermocouple placed at the rear did not exceed 100°C
onto grounded substrates placed at 55 mm from the selected on a Philips h–2h equipment [22]. sputtering target. The study of the deposition rate versus
nitrogen partial pressure of the incoming gas mass flow
is presented elsewhere [14]. So, thicknesses are easily 3. Results
calculated with these calibrated deposition rates
multiplied by time. 3.1. Transmission spectra
Two types of substrate have been chosen to analyse
the physical properties of the coating. For optical trans- Fig. 1 shows the light transmission spectra T(l) through different film thicknesses from 50 nm to 600 nm mission spectra analysis, conventional microscope glass
slides have been used, whereas for other characterisa- for TiN
x coatings produced under a 4 sccm nitrogen mass flow. As can be seen from the figure, T(l) has tions, polished monocrystalline silicon wafers (100) have
been coated. Both substrates were rinsed in acetone and already fallen under 3.8% with the 50 nm thick layer deposited onto glass substrate. This result shows that plasma etched for approximately 10 min at 0.5 Pa in
pure argon atmosphere prior to each nitride deposition. this thickness, which corresponds to a 100 nm light outward/return path, is already sufficient to avoid inter-ference phenomena between light reflected from the film and light reflected from the substrate surface. To use 2.2. Optical properties and colour
the same thicknesses for samples in nuclear analysis, the In order to avoid interface reflection interference and
to study only the optical response of the film, transmis-sion spectra have been scanned with wavelengths from 400 nm to 600 nm through various layer thicknesses deposited onto glass substrates. For further analysis, one nitride thickness has been chosen, therefore the coating appearance is only governed by the TiN
xlayer and not by the substrate.
Colour and gloss, which are the most important properties of decorative coatings, were studied by spectral reflectance spectroscopy with a Micro Color tristimulus colorimeter equipped with an Ulbricht globe coupled to a xenon flash lamp for diffuse illumination of the sample. The light diffuse reflection from the sample was measured at an angle of 8°, in accordance with the German industrial standard DIN5033
[6,7,15,16 ]. Results are presented in both physiologically Fig. 1. Light transmission spectra T(l) from 400 to 600 nm through relevant CIE L1a1b1 and physically linked x, y, Y colori- six different TiN
x film thicknesses deposited onto glass substrates (4 sccm N2, 0.30 Pa, 8 mA/cm2).
colorimetry determination has been carried out with 200 nm thick TiN
xcoatings. It should also be noted for further discussion that maximum transmission occurs near l=444 nm through the 50 nm thick TiNxlayer. 3.2. Colorimetry
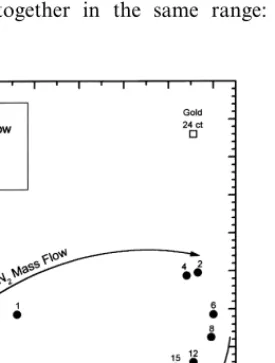
12 200 nm thick nitride films have been deposited on silicon substrate under wN2 ranging from 0 to 67 sccm for a 100 sccm total (N
2+Ar) mass flow. Fig. 2 presents the chromatic diagram in the physiologically relevant a1 (green–red axis), b1 (blue–yellow) system for all these TiN
xcoatings. Some interesting reference samples have also been picked out. On the figure, the data describe a loop curve in the a1, b1 space as the nitrogen mass flow increases. Starting from the grey metallic appearance, the colour jumps to a gold-like yellow with very small wN2increase: 0 to 2 sccm. Then, for further w
N2growth Fig. 3. Gloss L1 (CIE L1a1b1) versus nitrogen mass flow used during from 4 to 67 sccm, b1 decreases very slowly, i.e. the TiN
x film deposition onto polished silicon substrates (0.30 Pa, coating appearance is less yellow and finally becomes 8 mA/cm2).
slowly more brown. The same conclusions are presented in the literature [6,7], where a loop curve with a1<30 and b1<12 is also observed as w
N2 increases. decreases less rapidly to reach 57 and becomes stablearound this value. The coating appearance becomes Fig. 3 shows the dependence of gloss (L1) with w
N2.
It can be seen that L1 falls from 75 to less than 65 with brown and dark as the nitrogen content in the sputtering gas discharge increases.
a 2 sccm N2 increase. The further measurements are
once more grouped together in the same range: L1 The colour changes are difficult to interpret in this colorimetric system and, in order to discuss more physi-cally these variations, the same measurements are also illustrated in the x, y colour space: a geometrical con-struction gives two meaningful physical parameters [16 ]. If a straight line is plotted between the data and the white coordinates (1/3,1/3), the intersections with the spectrum locus representing the pure colours give the main (lm) and the complementary (lc) wavelengths as shown in Fig. 4.
A loop curve evolution can be seen once again. As wN2 increases, l
m growths and lc decreases (Fig. 4). Since l
m represents the maximum value in the reflected light spectrum, it is not surprising that the main wave-lengths of the more gold-like deposits produced under wN2=1, 2 and 4 sccm surround the gold value (576 nm). 3.3. Composition and crystal structure
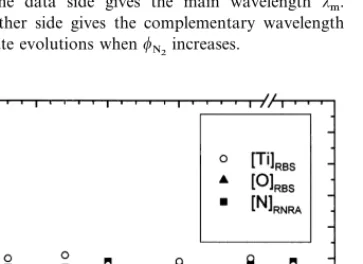
Fig. 5 shows Ti, N and O contents measured in the films by non-destructive nuclear reaction analysis (RNRA and RBS ) versus w
N2in the sputtering discharge gas. It can be seen that the oxygen contamination is fairly constant around 2 at.% in almost all the layers Fig. 2. Chromatic diagram in the physiologically relevant a1 (green– while the Ti content decreases from 92 to 56 at.% and red axis), b1 (blue–yellow) system (CIE L1a1b1) for TiN
xfilms deposited the N concentration increases from 2 to 41 at.% when onto polished silicon substrates under wN2between 0 and 67 sccm N
2 wN2 goes from 0 to 2 sccm. Both contents also become (0.30 Pa, 8 mA/cm2). Each data is labelled with nitrogen mass flow
fairly stable just below 50 at.%
for further wN2increase. used during the deposition. The arrows illustrate the loop curve
evolu-The samples produced under w
N2=0, 0.5, 2, 12 and tion as wN2 increases. 24 carat gold, silicon and iron colour
281
P. Roquiny et al. / Surface and Coatings Technology 116–119 (1999) 278–283
Table 1
Lattice parameter (a
0) and macroscopic stress (s) computed with FCO (fixed crystal orientation) method [24] on GXRD spectra from TiN
x layers deposited under various wN2(0.30 Pa, 8 mA/cm2)
wN2(sccm) a0(nm) s (GPa)
0.5 0.42157 0.83
2 0.42419 −0.73
12 0.42521 −0.24
25 0.42507 −2.01
Fig. 4. Chromatic diagram in the physically relevant x, y system for TiN
xfilms deposited onto polished silicon substrates under different wN2between 0 and 67 sccm N2(0.30 Pa, 8 mA/cm2). The pure colours are labelled with their wavelengths expressed in nanometres on the spectrum locus while the white coordinates (1/3,1/3) are illustrated by an open circle. The straight line joining the data and the white centre gives two meaningful physical parameters. Intersection with the
Fig. 6. TiN lattice parameter (a
0) computed with FCO (fixed crystal spectrum locus on the data side gives the main wavelength lm.
orientation) method [24] versus wN2 for layers deposited onto Intersection on the other side gives the complementary wavelength
monocrystalline (100)-oriented silicon (0.30 Pa, 8 mA/cm2). lc. The arrows illustrate evolutions when wN2increases.
titanium nitride phase [23]. Lattice parameter (a0) and stress (s) have been computed with the diffracted TiN peaks based on the FCO (fixed crystal orientation) method suggested by Quaeyhaegens et al. [24]. These results are listed in Table 1 and Fig. 6 shows the cubic lattice parameter a
0 evolution as wN2 increases for the four nitride layers mentioned above. It was subsequently found that a0 is very beneath the stoichiometric value for w
N2=0.5 sccm where the coating colour is grey, but a
0fairly matches this value for the gold-like film depos-ited under w
N2=2 sccm. The lattice parameters found for the other two brown layers built under important wN2 are very similar but just above the standard value. Macroscopic stresses are very reasonable, facing some-times five some-times greater data measured by others authors for sputtered TiN
x. Unfortunately, further comparisons are difficult to perform because experiments from the Fig. 5. Titanium, oxygen and nitrogen atomic concentration versus
literature are mainly carried out with a bias voltage nitrogen mass flow used during TiN
xfilm deposition onto polished applied on the substrate either/or at deposition temper-silicon substrates (0.30 Pa, 8 mA/cm2). Nitrogen content was measured
by15N(p,ac)12C RNRA at 429 keV while titanium and oxygen were ature greater than 100°C [13,25,26]. revealed by 2.4 MeV4He RBS at 175°.
diffraction. The layer deposited without N2 in the gas 4. Discussion
sputtering discharge is the only one that exhibits the
hexagonal compact structure of metallic titanium. All In view of the diffraction analysis, it seems likely that all the nitride layers deposited at low temperature with the other samples reveal the current face centred cubic
Table 2 N
2in the gas discharge have grown with cubic crystal Complementary wavelengths (lc) and associated photon energies (Ec) lattice, although the poor nitrogen content was measured
deduced from x, y chromaticity diagram for TiN
xlayers deposited for low w
N2. The TiN phase can be assumed to consist under various wN2(0.30 Pa, 8 mA/cm2) of a simple metal sublattice with nitrogen atoms
occupy-wN2(sccm) lc (nm) Ec(eV )
ing interstitial positions, thus forming a separate non-metal sublattice. The absence of nitrogen covalent
0 $700 1.77
bonding implies that titanium nitride possesses metallic 0.5 undefined –
properties [27]. 1 470 2.64
2 480 2.58
Moreover, in their solar energy control material
4 480 2.58
overview, Ribbing and Roos [10] explain that the
trans-6 483 2.56
ition metal nitrides are optically free electron-like due 8 483 2.56
to their low intensity of interband transition at low 12 485 2.55
15 485 2.55
photon energies. As for the noble metals, the optical
20 485 2.55
properties can be mainly resolved in terms of the simple
25 485 2.55
Drude theory in the IR and visible energy region. Then,
41 493 2.51
on the basis of the Drude model, the unscreened plasma 67 525 2.36
energy where the real part of the dielectric function e1(v) passes through zero can be used as a key value to relate the stoichiometry and crystal structure to the
to this standard Ep value. Moreover, Table 2 shows that optical properties [28].
E
c starts from 2.64 eV, decreases to around 2.56 eV The unscreened plasma energy Bvp depends on the between w
N2=1 and 6 sccm, becomes stable until density of free electrons n and on an effective electron
wN2=25 sccm and draws down again for wN2=41 and mass m1 since the unscreened plasma frequency v
p is 67 sccm. In view of Fig. 5, it is obvious that the first given by the expression 앀ne2/e
0m1. The plasma fre- diminution of E
ccan be correlated with the electron free quency divides the visible spectrum into two parts: if
density decrease due to the metallic nature reduction in v>v
p and e1(v)>0 then the electromagnetic wave is the TiN lattice, i.e. the nitrogen content increases, while propagated in the layer, on the contrary, if v<v
pand titanium concentration falls. For further w
N2supply, the e
1(v)<0 then the light is reflected. This free electron- Ti and N concentrations become constant just below like behaviour must be completed with interband (bound
50 at.%. The consequence of the trend mentioned above carrier) absorption in the reflected electromagnetic wave
is the Ec stabilisation around 2.55 eV. Unfortunately, energy range. For stoichiometric TiN, the interband
the next lessening of this value cannot be explained in transition occurs at the same energy as in gold, and the
regard to the concentration analysis. However, that compound consequently exhibits a gold-like
appear-diminution could be attributed to an increase of crystal ance [29].
defects due, for example, to the non-negligible compres-On basis of Figs. 2 and 5, it can be seen that L1 sive stress measured in TiN
x layers deposited under shows the same evolution as the Ti content when w
N2 high wN2(see Table 1). These defects can affect strongly increases. The number of free electrons n decreases with the electron density and then the amortised spectrum Ti concentration and the plasma energy moves towards [10]. That is probably the reason why E
c is again lower energies. The reflected part of the light spectrum reduced in these TiN
xlayers but impossible to control (v<vp) is thus reduced, and that is why the gloss with w
N2.
decreases. Unfortunately, the colorimetric data do not Furthermore, in TiN
x, the transmitted light maximum give direct measurement ofe
1(v) and then the plasma intensity occurs very near the reflected minimum [10]. frequency is still unknown for the analysed samples. That is why the photon energy (2.79 eV ) revealed by Nevertheless, we can suppose on the basis of the simple the maximum transmitted intensity in Fig. 1 is likewise Drude theory that the complementary wavelength lc close to the standard Bvp value.
and thus the complementary photon energy Ec are characteristic of the spectral region where the nitride absorbs the light in the bulk. So, E
ccould be assumed 5. Conclusion as a rough approximation of the plasma energy
(Ep=Bvp) where the electron gas is excited. Table 2 Colours from metallic grey to gold and finally brown-shows measured l
c and computed Ec as a function of ish red have been obtained as the nitrogen mass flow is the N
2mass flow used during the TiNxdeposition. raised in the gas discharge. It was shown that these In the literature, the current estimation for Ep in TiN
x layer colour variations can also be resolved in TiN
x, where x=1, was found to be 2.6 eV [28]. The terms of the Drude model. As the titanium metallic nature of the compound decreases, the absorbed part of mean value for our calculated E
283
P. Roquiny et al. / Surface and Coatings Technology 116–119 (1999) 278–283
[5] H.A. Jehn, J.H. Kim, S. Hofmann, Surf. Coat. Technol. 36 the spectra moves towards lower energies. When the
(1988) 715. minimum titanium concentration in the deposited films
[6 ] G. Reiners, H. Hantsche, H.A. Jehn, U. Kopacz, A. Rack, Surf. is reached (N2 mass flow>4 sccm), crystalline defects Coat. Technol. 54/55 (1992) 273.
affect also the amortised spectra but are difficult to [7] H.A. Jehn, Surface engineering in the Industrial practice: decora-tive coatings, in: Y. Pauleau (Ed.), Materials and Processes for control. In conclusion, as the N
2 content in the gas Surface and Interface Engineering, Kluwer Academic, Dordrecht, discharge guides the nitrogen composition, it is the key
1995, pp. 359–370. parameter in colour control for TiN
x sputtered films, [8] Y. Miyamoto, Y. Kubo, N. Ono, M. Hashimoto, T. Takashi, I. especially when N
2mass flow is less than 4 sccm. Further Ito, F. Arezzo, P. Gimondo, Thin Solid Films 270 (1995) 253. research is in progress on nitrides deposited under low [9] H. Randhawa, Surf. Coat. Technol. 36 (1988) 829.
[10] C.G. Ribbing, A. Roos, SPIE Int. Symp. on Optical Thin Films reactive gas mass flow.
V, San Diego, CA, 30 July–1 August, R.L. Hall ( Ed.), Proc. SPIEE Vol. 3133, SPIE, Bellingham, WA, 1997, pp. 148–162. [11] J.-E. Sundgren, Metastable hard coatings, in: Y. Pauleau, P.B.
Barna ( Eds.), Protective Coatings and Thin Films, Kluwer Academic, Dordrecht, 1997, pp. 335–344.
Acknowledgements
[12] W.D. Sproul, P.J. Rudnik, M.E. Graham, Surf. Coat. Technol. 39/40 (1989) 355–363.
This work is supported by the Ministe`re de la Re´gion
[13] V. Valvoda, J. Alloys Comp. 219 (1995) 83.
Wallonne (Belgium) within the FISRT Program [14] Ph. Roquiny, F. Bodart, S. Lucas, G. Terwagne, 11th Int. Colloq. (Programme de Formation et d’Impulsion a` la on Plasma Processes, Le Mans, France, 25–29 May, A. Ricard
(Ed.), CIP’97 Proceedings, CIP, Paris, 1997, pp. 28–32. Recherche Scientifique et Technologique) and by the
[15] ISO 7724/1,2,3, 1984. Cockerill Sambre Research and Development Centre.
[16 ] Y. Dordet, La colorimetrie, principes et applications, Eyrolles, The authors wish to thank Professor L. Stals and
Paris, 1990.
Professor C. Quaeyhaegens from the Institute for [17] B. Maurel, G. Amsel, Nucl. Instrum. Meth. 218 (1983) 159. Materials Research of the Limburg’s Universitair [18] G. Terwagne, M. Piette, F. Bodart, Nucl. Instrum. Meth. B 19/
20 (1987) 145. Centrum for the GXRD analyses and Ms. F. Frising
[19] G. Terwagne, S. Lucas, F. Bodart, Nucl. Instrum. Meth. B 66 from the Laboratoire de Didactique en Physique
(1992) 262. (Faculte´s Universitaires Notre-Dame de la Paix, Namur)
[20] G. Deconninck, Introduction to Radioanalytical Physics, for her help during the optical spectra measurement. Elsevier–Akademia Kiado, Budapest, 1978, pp. 100–125.
[21] L.R. Doolittle, Nucl. Instrum. Meth. B 9 (1985) 344.
[22] C. Quaeyhaegens, M. Van Stappen, L.M. Stals, F. Bodart, G. Terwagne, R. Vlaeminck, Surf. Coat. Technol. 54/55 (1992) 279. [23] JCPDS Powder Diffraction File, number 38-1420, International
References Centre for Diffraction Data, Swarthmore, 1995.
[24] C. Quaeyhaegens, G. Knuyt, L.M. Stals, J. Vac. Sci. Technol. A, submitted.
[1] D.J. Smukowski, Environmental regulation of surface
engineer-ing, in: C.M. Cotell, J.A. Sprague, F.A. Smith Jr. ( Eds.), Surface [25] A.J. Perry, A.F. Tian, J.R. Treglio, C. Loomis, Surf. Coat. Tech-nol. 68/69 (1994) 528.
Engineering, ASM Handbook Vol. 5, ASM International,
Materials Park, OH, 1994, pp. 911–917. [26 ] B. Navinsek, P. Panjan, A. Cvelbar, Surf. Coat. Technol. 74/75 (1995 ) 155.
[2] Commission of the European Communities, Proposal for a
coun-cil directive establishing the framework for Community action in [27] N. Savvides, B. Widow, J. Appl. Phys. 64 (1988) 234.
[28] S. Logothedis, I. Alexendrou, J. Stoemenos, Appl. Surf. Sci. 86 the field of water policy, Official Journal of the European
Commu-nities C series 184/97, Strasbourg, 1997, pp. 20–90. (1995) 185.
[29] S. Logothedis, I. Alexendrou, A. Papadopoulos, J. Appl. Phys. [3] W.D. Sproul, J. Vac. Sci. Technol. A 12 (4) (1994) 1595.