HAL Id: tel-01298416
https://hal.archives-ouvertes.fr/tel-01298416
Submitted on 5 Apr 2016HAL is a multi-disciplinary open access archive for the deposit and dissemination of sci-entific research documents, whether they are pub-lished or not. The documents may come from teaching and research institutions in France or abroad, or from public or private research centers.
L’archive ouverte pluridisciplinaire HAL, est destinée au dépôt et à la diffusion de documents scientifiques de niveau recherche, publiés ou non, émanant des établissements d’enseignement et de recherche français ou étrangers, des laboratoires publics ou privés.
Battery Electrical Vehicles-Analysis of Thermal
Modelling and Thermal Management
Ahmadou Samba
To cite this version:
Ahmadou Samba. Battery Electrical Vehicles-Analysis of Thermal Modelling and Thermal Manage-ment . Electric power. LUSAC (Laboratoire Universitaire des Sciences Appliquées de Cherbourg), Université de caen Basse Normandie; MOBI (the Mobility, Logistics and Automotive Technology Research Centre), Vrije Universiteit Brussel, 2015. English. �NNT : 2015CAEN2003�. �tel-01298416�
UNIVERSITÉ DE CAEN BASSE NORMANDIE
U.F.R. de Sciences
Ecole doctorale SIMEM
THÈSE
présentée et soutenue le : 26/03/2015 par
Ahmadou SAMBA
En vue de l’obtention du
DOCTORAT de l’UNIVERSITÉ de CAEN
Spécialité : Génie Electrique
préparée dans le cadre d’une cotutelle internationale de thèse
entre l’Université de Caen Basse-Normandie et Vrije Universiteit Brussel/Belgique
Battery Electrical Vehicles- Analysis of Thermal Modelling and
Thermal Management
Contribution à la Modélisation et à la Gestion Thermique des
Batteries Lithium-Ion pour des Applications de Véhicules
Electriques
Jury
Daniel Hissel, Professeur, Université de Franche-Comté (Rapporteur) Brayima Dakyo, Professeur, Université du Havre (Rapporteur)
Stéphane Raël, Professeur, ENSEM Nancy
Hasna Louahlia-Gualous, MCF-HDR, Université de Caen Basse-Normandie Noshin Omar, Professeur, Vrije Universiteit Brussel/Belgique
Joeri Van Mierlo, Professeur, Vrije Universiteit Brussel/Belgique
I
Composition of the Jury
Chairman of the jury:
- Professor Annick Hubin: Vrije Universiteit Brussel – Research Group
Electrochemical and Surface Engineering (SURF), Belgium Vice-Chairman of the jury:
- Professor Rik Pintelon: Vrije Universiteit Brussel – Department of Fundamental
Electricity and Instrumentation (Vakgroep Elektriciteit – ELEC), Belgium Promoters:
- Professor Joeri Van Mierlo: Vrije Universiteit Brussel – Research Group Mobility
and Automotive Technology (Vakgroep Electrotechniek en Energietechnologie – ETEC), Belgium
- Professor Hamid Gualous: Université de Caen Basse Normandie, Laboratoire
Universitaire des Sciences Appliquées de Cherbourg (LUSAC), France
- Professor Noshin Omar: Vrije Universiteit Brussel – Research Group Mobility and
Automotive Technology (Vakgroep Electrotechniek en Energietechnologie – ETEC), Belgium
Secretary of the jury:
- Professor Peter Van den Bossche: Vrije Universiteit Brussel – Research Group
Mobility and Automotive Technology (Vakgroep Electrotechniek en Energietechnologie – ETEC & Vakgroep Industriële Wetenschappen - INDI), Belgium
Members of the jury:
- Professor Daniel Hissel: Université de Franche-Comté, Franche-Comté
Electronique, Mécanique, Thermique et Optique - Sciences et Technologies (FEMTO-ST), France
- Professor Brayima Dakyo: Université du Havre, Groupe de Recherche en
Electrotechnique et Automatique du Havre (GREAH), France
- Professor Hans Jürgen Seifert: Karlsruhe Institute of Technology, Institute for
II
- Professor Hasna Louahlia-Gualous: Université de Caen Basse Normandie,
Laboratoire Universitaire des Sciences Appliquées de Cherbourg (LUSAC), France
- Professor Stéphane RAEL : Ecole Nationale Supérieure d’Electricité et de
Mécanique Nancy, Groupe de Recherche en Électrotechnique et Électronique de Nancy (GREEN), France
- Assistant Professor Tala-Ighil Boubekeur : Université de Caen Basse Normandie,
III
Acknowledgments
First and foremost, I offer my sincere gratitude to my supervisors Prof. Hamid Gualous, Prof. Joeri Van Mierlo and Prof. Noshin Omar for offering me the opportunity to perform a joint PhD between the Vrije Universiteit Brussel and the University of Caen and for their continuous support and motivation during my year of research. Without their enthusiasm, inspiration and expertise, this thesis would not have been possible. Special thanks go to Prof. Noshin Omar, for his help, encouragement and the fruitful discussion during the hardest time of my year research. Furthermore, I would like to thank Prof. Peter Van den Bossche, Prof. Noshin Omar and Prof. Joeri Van Mierlo for all the time that they spent in reviewing and correcting the manuscript.
I would also like to extend my appreciation to the Jury members for their comments and suggestions during the private defense.
Special thanks goes to Tala-Ighil Boubekeur for his guidanceduring the first part of my PhD and his support for designing the battery tester in LUSAC laboratory and Jelle Smekens for translating the summary of my PhD into Dutch.
I also wish to express my warm thanks to my colleagues at ETEC department: Omar Hegazy, Mohamed Monem, Yousef Firouz, Odile Capron, Thierry Coosemans, Alexandros Nikolian, Joris De Hoog, Shovon Goutam, Elisabeth Leloup, Sylvia Heyvaert, Rahul Gopalakrishnan, Jean-Marc Timmermans, Karel Fleurbaey, Mohamed El Baghdadi, Maarten Messagie, Luis Hernandez, Maria Oliveira, Maitane Berecibar, Nils Hooftman, Surendraprabu Rangaraju, Yang, Cedric De Cauwer for their friendship and the nice working atmosphere they created in the team.
I also would like to thank my colleagues at LUSAC laboratory: Amrane Oukaour, Youssef Slamani, Moataz Elsied, for their friendship and the nice working atmosphere.
Last but not the least; I would like to express my appreciation to my beloved wife, for her love, sacrifice, patience, tolerance and encouragement.
I would like to express my deepest gratitude and sincere appreciation towards my parents, brothers, sisters, and relatives for their love, support and encouragement. Finally, I would like to dedicate my dissertation to my godfather Ahmadou Kane.
V
Table of Contents
Composition of the Jury ... I Acknowledgments ... III Table of Contents ... V List of Figures ... IX List of Tables ... XV List of Acronyms ... XVII List of Symbols ... XIX
0. General Introduction ... 1
0.1 Goal ... 1
0.2 Outline of performed research work ... 1
1. Background Information ... 7
1.1 Introduction ... 7
1.2 Alternative powertrains ... 9
1.2.1 Hybrid Electrical Vehicles (HEVs) ... 9
1.2.2 Plug-in Hybrid Electric Vehicles (PHEVs) ... 11
1.2.3 Battery Electric Vehicles (BEVs) ... 12
1.3 Lithium-ion battery ... 15
1.3.1 Cathode material ... 17
1.3.2 Anode material ... 18
1.3.3 Electrolyte ... 19
1.3.4 Summary of commercial lithium ion batteries ... 20
1.3.5 Choice of the battery chemistry in this PhD ... 20
2. State-of-the-Art of Battery Thermal Management ... 25
2.1 Goal ... 25
2.2 Introduction ... 25
2.3 Battery thermal behavior, modeling and characterization ... 28
2.3.1 Battery geometry, external and internal structures ... 28
2.3.2 Impact of temperature on the battery behaviors ... 29
2.3.3 Effect of cell design on the cell behaviors ... 29
VI
2.4.1 Electrical-thermal modeling ... 30
2.4.2 Electrochemical-thermal modelling ... 36
2.5 Battery Thermal management ... 38
2.5.1 Global principles of a battery thermal management system ... 38
2.5.2 Commercial applications of BTMS ... 43
2.6 Conclusions ... 43
3. Electrical –Thermal Model for Large Size Lithium-ion Cells ... 47
3.1 Goal ... 47
3.2 Introduction ... 47
3.3 Thermal modelling ... 48
3.3.1 Model assumptions and geometry features ... 48
3.3.2 Governing equations and boundary conditions ... 49
3.3.2.1 Governing equations ... 49
3.3.2.2 Boundary conditions ... 50
3.3.3 Heat generation measurement ... 51
3.3.3.1 Internal resistance measurement ... 52
3.3.3.2 Entropy coefficient measurement ... 55
3.3.4 Battery thermal model parameters ... 58
3.4 Experimental ... 62
3.5 Results and discussion ... 66
3.5.1 Numerical aspect ... 66
3.5.2 Model validation ... 67
3.6 Conclusions ... 72
4. Pouch Cell Design: Impact of Tab Location ... 75
4.1 Goal ... 75
4.2 Introduction ... 75
4.3 Model Description ... 76
4.3.1 Model assumptions and geometry features ... 76
4.3.2 Electrochemical modeling... 78
4.3.3 Thermal modeling ... 81
4.3.4 Model Input ... 82
VII
4.3.5.1 Numerical aspects ... 82
4.3.5.2 Model validation ... 84
4.4 Results and discussion ... 89
4.5 Conclusion ... 101
5. Numerical Analysis of Different Battery Thermal Management Systems ... 105
5.1 Goal ... 105
5.2 Introduction ... 105
5.3 Liquid cooling method ... 107
5.3.1 Investigation of the cooling plate’s designs ... 107
5.3.1.1 Model assumptions and geometry features ... 107
5.3.1.2 Model development ... 109
5.3.1.2.1 Battery domain ... 109
5.3.1.2.2 Cooling plate domain ... 112
5.3.1.2.3 Numerical procedure ... 117
5.3.1.3 Results of the different cooling plate designs ... 118
5.3.1.3.1 Effect of the channel design ... 118
5.3.1.3.2 Influence of inlet temperature ... 121
5.3.2 Impact of cooling plate location on the Battery module thermal management system ... 124
5.3.2.1 Model assumptions and geometry features ... 124
5.3.2.2 Results ... 126
5.3.2.2.1 Comparison of the different cooling plate location... 126
5.3.2.2.2 Influence of current rate ... 131
5.3.2.2.3 Influence of the inlet and initial temperatures ... 132
5.3.2.2.4 Influence of the flow rate ... 134
5.4 Solid-liquid phase change material cooling method ... 136
5.4.1 Model Description ... 136
5.4.1.1 Geometry features and Model assumptions ... 136
5.4.1.2 Model development ... 137
5.4.1.2.1 Battery domain ... 137
5.4.1.2.2 PCM domain ... 137
VIII
5.4.1.2.4 Input parameters ... 141
5.4.2 Results ... 142
5.4.2.1 Influence of current rate ... 142
5.4.2.2 Influence of PCM thickness ... 145
5.4.2.3 Influence of initial temperature ... 146
5.4.2.4 Combination of PCM with liquid cooling ... 146
5.5 Comparison between liquid and PCM cooling methods ... 148
5.5.1 Performance comparison based on driving cycle ... 148
5.5.2 Cost comparison of the different cooling strategies ... 151
5.6 Conclusion ... 152
6. Conclusions, Contributions and Future Work ... 157
6.1 Conclusions and overview of work performed ... 157
6.2 Contributions ... 159
6.3 Future work ... 159
7. Appendix I ... 163
7.1 Internal resistance as a function of SoC and temperature at different current rate ... 163
7.2 Comparison of the Thermal distributions based on experimental thermal imager and modeling at different current rates. ... 166
7.3 Entropy coefficient as a function of temperature at different SoC levels ... 169
8. Appendix II ... 173
8.1 Voltage distribution at the negative and positive current collectors ... 173
8.2 Temperature distribution at different time steps and 4It discharge rate ... 175
8.3 Input parameters for a 45 Ah LiFePO4 battery ... 176
List of Publications ... 181
Publications in ISI Journals ... 181
Publications in non-ISI Journals ... 182
Contribution in Books ... 183
Publications in Scientific Conferences ... 184
IX
List of Figures
Figure 1.1: final energy consumption (a) total and (b) petroleum products by sector in the
EU-28, 1990-2010 [2] ... 7
Figure 1.2: change of Greenhouse gas (GHG) emissions from 1990 to 2012 in CO2 equivalents (Tg) by sector in the EU-28 [4]. ... 8
Figure 1.3: Annual global EV and PHEV sales [11] ... 9
Figure 1.4: Series hybrid topology [12] ... 10
Figure 1.5: Parallel hybrid topology [12] ... 10
Figure 1.6: Combined hybrid topology [12] ... 11
Figure 1.7: Battery electric vehicle topology [12] ... 12
Figure 1.8: Specific energy and specific power of different battery types [16] ... 15
Figure 1.9: Different lithium-ion battery design concepts: (a) cylindrical, (b) pouch and (c) prismatic cells [17]... 16
Figure 1.10: working principle of LiB [18] ... 16
Figure 1.11: crystal structure of: (a) layered, (b) spinel and (c) olivine [19] ... 17
Figure 1.12: Pouch cell, European Battery (EB) 45 Ah ... 20
Figure 2.1: Thermal runaway process [37] ... 26
Figure 2.2: An example of a safe operating area of a typical LiFePO4/graphite cell [35]26 Figure 2.3: Internal structure of the different shape of LIB: (a) cylindrical, (b) prismatic and (c) pouch [38]... 28
Figure 2.4: Electro-thermal model [48] ... 31
Figure 2.5: Voltage response of a lithium-ion cell after a current pulse[55] ... 32
Figure 2.6: first order Thévenin Battery model [54] ... 32
Figure 2.7: operating principle of the electrical model [48] ... 33
Figure 2.8: Simplified thermal ECM for small cell [74] ... 34
Figure 2.9: Governing equation at different length scale [85] ... 36
Figure 2.10: Different types coupling between electrochemical and thermal models ... 37
Figure 2.11: Flow chart of the BTMS for BEV [88] ... 38
Figure 2.12: Temperature ranges of the surveyed material categories [104] ... 42
Figure 3.1: Pouch cell: (a) image and (b) schematic diagram and dimension (mm) of pouch Li-ion battery ... 49
Figure 3.2: Methodology of the Electrical parameter estimation ... 53
Figure 3.3: Internal resistance of charge as a function of SoC and Temperature at 1It current rate ... 54
Figure 3.4: Internal resistance of discharge as a function of SoC and Temperature at 1It current rate ... 54
Figure 3.5: evolution of OCV as a function of battery temperature at 0% of SoC during charge process ... 56
Figure 3.6: Entropy coefficient of 0% of SoC during charge process ... 57
Figure 3.7: Entropy coefficient as a function of SoC during charge and discharge processes ... 57
X
Figure 3.8: Cauer thermal model ... 60
Figure 3.9: Battery surface temperature at 2 It current rate micro-pulse and 27°C of environment temperature ... 61
Figure 3.10: Estimation flowchart thermal battery model parameters ... 61
Figure 3.11: Battery tester... 63
Figure 3.12: Charging and discharging circuits [113] ... 63
Figure 3.13: Constant current –constant voltage (CCCV) charging process [49] ... 64
Figure 3.14: Thermocouples position on the battery ... 64
Figure 3.15: The pouch cell battery in the climatic chamber ... 65
Figure 3.16: Meshing of battery (a), and zoom vision (b) ... 66
Figure 3.17: Procedure of the numerical solution at each time step ... 67
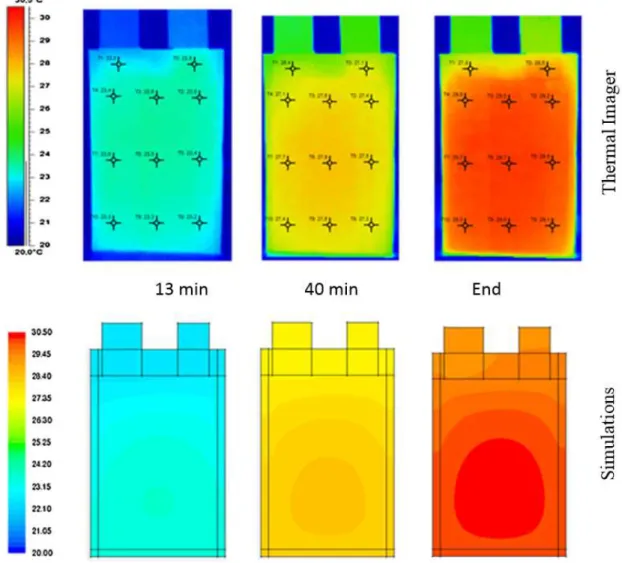
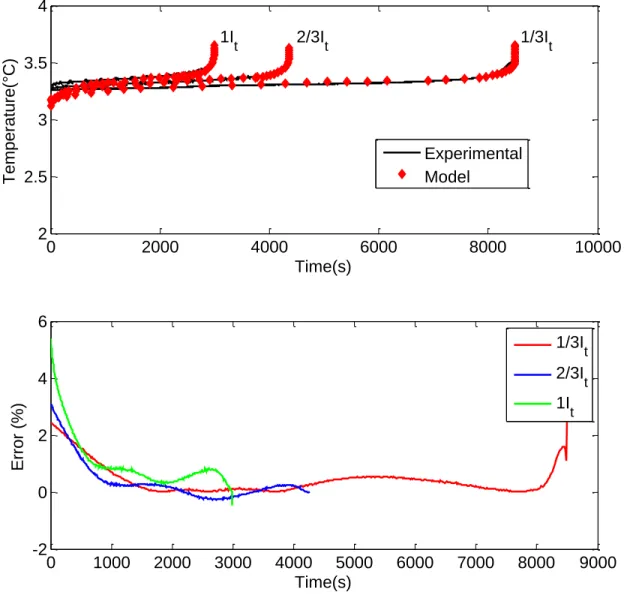
Figure 3.18: Thermal distributions based on thermal imager and modeling at 1 It charge current rate and 20°C of environment temperature ... 68
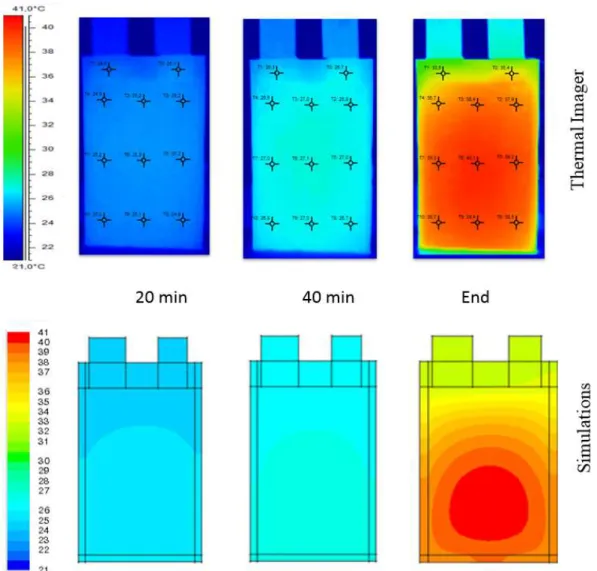
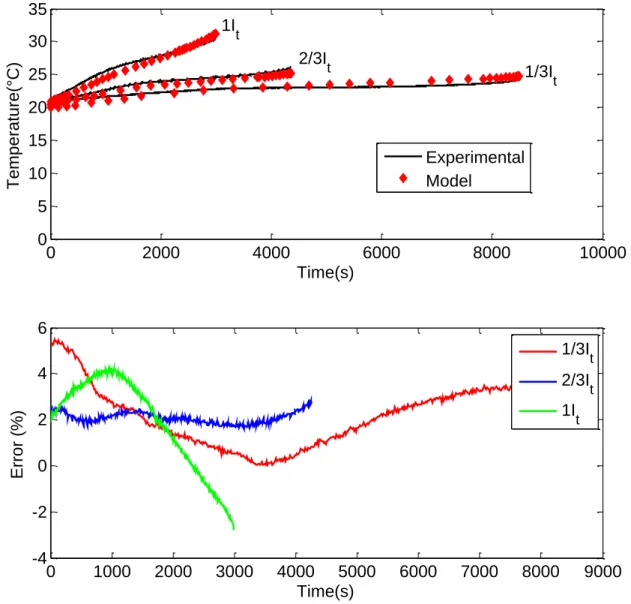
Figure 3.19: Thermal distributions based on thermal imager and modeling at 1 It discharge current rate and 20°C of environment temperature ... 69
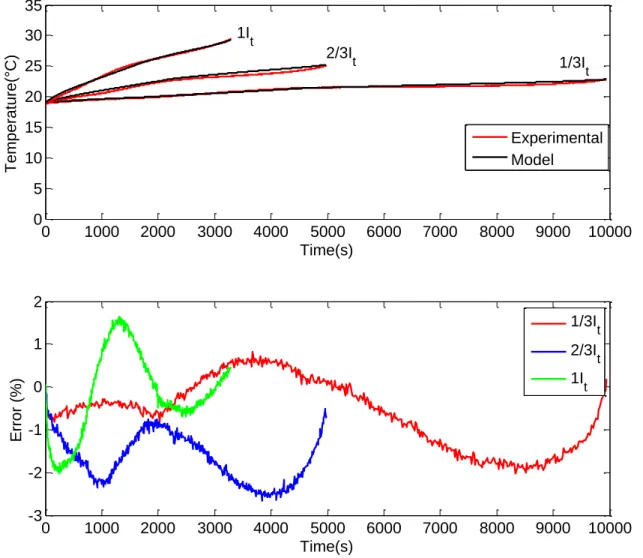
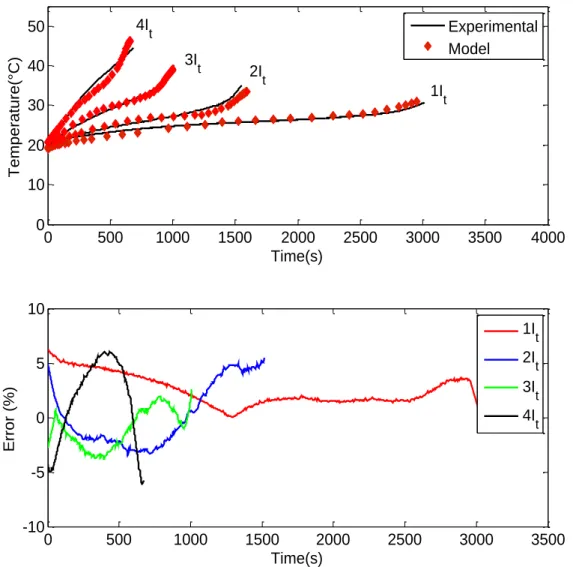
Figure 3.20: Maximum temperature and relative error variations from model and experiment during different charge current rates and 20°C of environment temperature ... 70
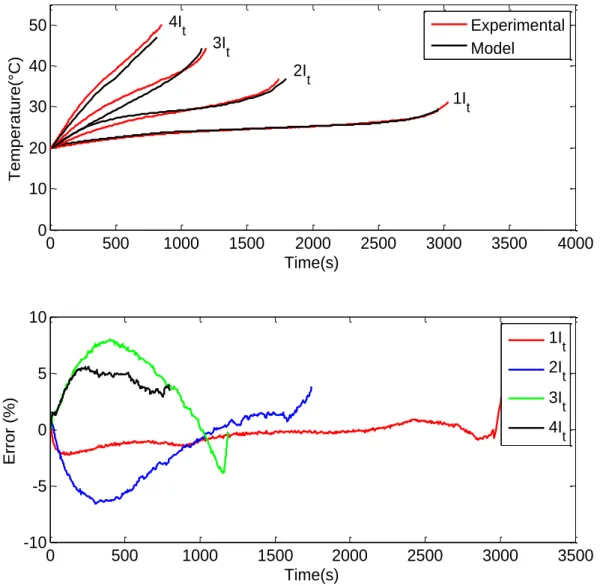
Figure 3.21: Maximum temperature and relative error variations from model and experiment during different discharge current rates and 20°C of environment temperature ... 71
Figure 3.22: Thermal distributions based on modeling at 4It discharge current rate at 20°C of environment temperature ... 72
Figure 4.1: single electrode plate pair configuration and component thicknesses ... 77
Figure 4.2: different designs and dimensions (mm) of pouch cell ... 77
Figure 4.3: Meshing of different cell designs ... 83
Figure 4.4: Procedure of the numerical solution at each time step ... 83
Figure 4.5: Comparison between experimental and modeling of cell potential at different charge current rates and the relative error ... 85
Figure 4.6: Comparison between experimental and modeling of cell potential at different discharge current rates and the relative error... 86
Figure 4.7: Comparison between experimental and modeling of the cell maximum temperature at different charge current rates ... 87
Figure 4.8: Comparison between experimental and modeling of the cell maximum temperature at different discharge current rates... 88
Figure 4.9: average cell potential for different cell designs versus time under 4 It discharge current rate ... 89
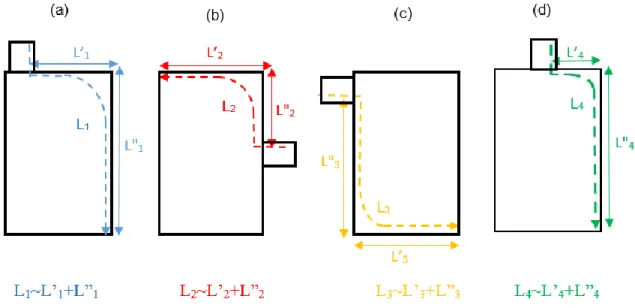
Figure 4.10: Potential gradient over the negative current collectors and tab under 4 It discharge current rate at 640s for different cell designs: (a) case 1, (b) case 2, (c) case 3 and (d) case 4 ... 90
Figure 4.11: Potential gradient over the positive current collectors and tabs under 4 It . 91 Figure 4.12: maximum current pathway on the negative current collector of different cell designs: (a) case 1, (b) case 2, (c) case 3 and (d) case 4 ... 92
XI
Figure 4.13: DoD distribution over the middle of the cathode under 4 It discharge current
rate at 640s for different cell designs: (a) case 1, (b) case 2, (c) case 3 and (d) case 4, with
𝑐1, 𝑝, 𝑚𝑎𝑥 the maximum stoichiometric lithium content in the cathode ... 93
Figure 4.14: DoD distribution over the middle of the anode under 4 It discharge current rate at 640s for different cell designs: (a) case 1, (b) case 2, (c) case 3 and (d) case 4, with 𝑐1, 𝑛, 𝑚𝑎𝑥 the maximum stoichiometric lithium content in the anode ... 94
Figure 4.15: Comparison of the average temperature under 4 It discharge current rate for the different cell designs ... 95
Figure 4.16: Comparison of the temperature deviation profiles under 4 It discharge current rate for the different cell designs ... 95
Figure 4.17: average ohmic heat sources profiles at (a) the positive current collector and (b) the negative electrode under 4 It discharge current rate ... 97
Figure 4.18: Comparison of the average heat source profiles under 4 It discharge current rate for the different cell design ... 98
Figure 4.19: total, reversible and irreversible heat sources under 4 It discharge current rate for case 2 cell design ... 98
Figure 4.20: Temperature distribution over the cell under 4 It discharge current rate at 640s for different cell designs: (a) case 1, (b) case 2, (c) case 3 and (d) case 4... 99
Figure 4.21: Summary of Comparison between cell designs under 4 It discharge current rate ... 100
Figure 4.22: Influence of the tab width on the distribution under 4 It discharge current rate ... 101
Figure 5.1: Battery cell cooled with two cold plates... 108
Figure 5.2: Different cold plate designs: (a) design 1, (b) design 2, (c) design 3 and (d) design 4 ... 109
Figure 5.3: Battery model ... 110
Figure 5.4: different battery domain ... 110
Figure 5.5: Procedure of the numerical solution at each time step ... 118
Figure 5.6 : Maximum battery cell temperature given by different cooling designs at 6It discharge current rate, Tinlet=20°C and Tamb=20°C with h=100 W/m².K. ... 119
Figure 5.7: Cell temperature gradients with different cooling designs at 6It discharge current rate, Tinlet=20°C and Tamb=20°C with h=100 W/m².K. ... 120
Figure 5.8: Temperature distribution over the cell at the end of 6 It discharge current rate for different cold plate designs, Tinlet=20°C and Tamb=20°C with h=100 W/m².K. ... 120
Figure 5.9: Temperature distribution over the cell with different cold plate designs at the end of 6 It discharge current rate, Tinlet=20°C and Tamb=20°C with h=100 W/m².K. 121 Figure 5.10: Maximum battery cell temperature given by different cooling designs at 6It discharge current rate, Tinlet=0°C and Tamb=20°C with h=100 W/m².K. ... 122
Figure 5.11: Cell temperature gradients with different cooling designs at 6It discharge current rate, Tinlet=0°C and Tamb=20°C with h=100 W/m².K. ... 122
Figure 5.12 : Maximum battery cell temperature given by different cooling designs at 6It discharge current rate, Tinlet=40°C and Tamb=20°C with h=100 W/m².K. ... 123
XII
Figure 5.13: Cell temperature gradients with different cooling designs at 6It discharge
current rate, Tinlet=40°C and Tamb=20°C with h=100 W/m².K. ... 123 Figure 5.14: Different Battery module designs: Design (A, (B), (C), (D), (E), (F). ... 125 Figure 5.15: Comparison of the maximum temperature (a) and temperature gradient (b) profiles under 4 It discharge current rate for different battery module designs ... 127
Figure 5.16: Temperature distribution over the different module designs at the end of 4 It
discharge current rate and 20°C of initial temperature ... 129 Figure 5.17: Temperature distribution over the different module designs in the zy plane at the end of 4 It discharge current rate and 20°C of initial temperature ... 130
Figure 5.18: Evolution of the maximum temperature at different discharge current rates, 20°C of initial temperature and 30L/min of flow rate ... 131 Figure 5.19: Evolution of the temperature gradient at different discharge current rates, 20°C of initial temperature and 30L/min of flow rate ... 132 Figure 5.20: Comparison of the average temperature at 4 It discharge current rate and
20°C of initial temperature at different coolant inlet temperatures ... 133 Figure 5.21: Comparison of the average temperature at 4 It discharge current rate and
20°C of inlet temperature at different initial temperatures ... 133 Figure 5.22: Comparison of the average temperature at 4 It discharge current rate at
different flow rates ... 134 Figure 5.23: Comparison of the temperature gradient at 4It discharge current rate at
different flow rates ... 135 Figure 5.24: Evolution of pressure drop and required pump power at 4 It discharge
current rate at different flow rates ... 136 Figure 5.25: Battery pack cooled by PCM embed on aluminum-foam ... 137 Figure 5.26: Maximum cell temperature profiles at different discharge current rates and 20°C of initial temperature ... 143 Figure 5.27: Temperature gradient profiles at different discharge current rates and 20°C of initial temperature ... 143 Figure 5.28: Temperature distribution over the battery pack at different discharge current rates at the end of the process ... 144 Figure 5.29: fraction of liquid over the PCM at different discharge current rates at the end of the process ... 144 Figure 5.30: Maximum cell temperature profiles at 4 It discharge current rate and 20°C of
initial temperature ... 145 Figure 5.31: Temperature gradient profiles at 4 It discharge current rate and 20°C of initial
temperature ... 145 Figure 5.32: Maximum cell temperature profiles at 4 It discharge current rate at different
initial temperatures ... 146 Figure 5.33: Design of PCM combining with liquid cooling ... 147 Figure 5.34: Maximum cell temperature profiles at 4 It discharge current rate at 20°C of
initial temperatures ... 147 Figure 5.35: Temperature gradient profiles at 4 It discharge current rate at 20°C of initial
XIII
Figure 5.36: Peugeot driving cycle ... 149
Figure 5.37: Evolution of the voltage during Peugeot driving cycle ... 149
Figure 5.38: Evolution of the maximum temperature during Peugeot driving cycle .... 150
Figure 5.39: Evolution of the average temperature during Peugeot driving cycle ... 150
Figure 5.40: Evolution of the gradient temperature during Peugeot driving cycle ... 151
Figure 7.1: Internal resistance as a function of SoC and temperature at 1/3It charge current rate ... 163
Figure 7.2: Internal resistance as a function of SoC and temperature at 1/3It discharge current rate ... 163
Figure 7.3: Internal resistance as a function of SoC and temperature at 2It charge current rate ... 164
Figure 7.4: Internal resistance as a function of SoC and temperature at 2It discharge current rate ... 164
Figure 7.5: Internal resistance as a function of SoC and temperature at 3It charge current rate ... 165
Figure 7.6: Internal resistance as a function of SoC and temperature at 3It discharge current rate ... 165
Figure 7.7: Thermal distributions based on experimental thermal imager and modeling at 2/3It charge current rate ... 166
Figure 7.8: Thermal distributions based on experimental thermal imager and modeling at 1/3It charge current rate ... 167
Figure 7.9: Thermal distributions based on experimental thermal imager and modeling at 1/3It discharge current rate ... 168
Figure 7.10: OCV at different temperature and 10% of SoC during charge process ... 169
Figure 7.11: OCV at different temperature and 20% of SoC during charge process ... 169
Figure 7.12: OCV at different temperature and 30% of SoC during charge process ... 170
Figure 7.13: OCV at different temperature and 40% of SoC during charge process ... 170
Figure 7.14: OCV at different temperature and 50% of SoC during charge process ... 171
Figure 8.1: Voltage distributions based on simulation at 4It discharge current rate at different time steps ... 174
Figure 8.2: Temperature distributions based on simulation at 4It discharge current rate at different time steps ... 175
XV
List of Tables
Table 1.1: Different HEVs types and their main functions/Characteristics [13] ... 11
Table 1.2: Prototypes/commercial HEVs [13], [15] ... 13
Table 1.3: Prototypes/commercial PHEVs [13], [15] ... 13
Table 1.4: Prototypes/commercial BEVs [13], [15] ... 14
Table 1.5: Characteristics of some commercial lithium Ion batteries [18], [27], [28] ... 20
Table 1.6: Characteristics of EB 45Ah lithium Iron Phosphate battery ... 21
Table 2.1: Influence of temperature on working principle of batteries: global trends [39] ... 29
Table 2.2: Notable PCMs for battery pack buffer/protection [104] ... 42
Table 2.3: Comparison (dis)advantages BTMS using air or liquid [88] ... 43
Table 3.1: HPPC procedure at a specific temperature ... 52
Table 3.2: Battery thermal parameters at different current rates and 27°C of environment temperature ... 62
Table 4.1: variables of the model ... 79
Table 4.2: Governing equation and boundaries conditions [84] ... 80
Table 4.3 : Value of investigated tab widths of the case 2 design ... 101
Table 5.1: Thermophysical properties for model materials [160] ... 142
Table 5.2: cost comparison of the different studied BTMSs ... 151
Table 8.1: Input parameters for a 45 Ah LiFePO4 battery [87], [121] ... 176
XVII
List of Acronyms
ARC Accelerating Rate Calorimeter BEV Battery Electric Vehicle
BMS Battery Management System
BTMS Battery Thermal Management System CFD Computational Fluid Dynamics
CH4 Methane
CO Carbon monoxide
CO2 Carbon Dioxide
COP Conformity of Production
Ch Charge
Disch Discharge
DoD Depth of Discharge DMC Dimethylene Carbonate
DSC Differential Scanning Calorimeter EDLC Electric Double–Layer Capacitor ECM Electrical Circuit Model
EEC European Economic Community EMC Ethyl Methyl Carbonate
EV Electric Vehicle
EIS Electrochemical Impedance Spectroscopy
EU European Union
FDM Finite Differential Method FEM Finite Element Method FVM Finite Volume Method
GHG Greenhouse Gas
HC hydrocarbons
HEV Hybrid Electric Vehicle
HPPC Hybrid Pulse Power Characterization ICE Internal Combustion Engine
LFP Lithium Iron Phosphate LiBF4 Lithium tetrafluoroborat LiCoO2 Lithium Cobalt Oxide
LiFePO4 Lithium iron phosphate
LiMn2O2 Lithium Manganese Spinel Oxide
LiNiCoAlO2 Lithium nickel cobalt aluminum oxide
LiNiMnCoO2 Lithium Nickel Manganese Cobalt Oxide
LiNiO2 Lithium Nickel Oxide
LiPF6 Lithium hexafluorophosphat
LiTiO2 Lithium titanate oxide
XVIII LTO Lithium Titante Oxide LCO Lithium cobalt oxide
NCA Nickel Cobalt Aluminum Oxide NiMH Nickel–Metal Hydride
NMC Nickel Manganese Cobalt Oxide NOx Mono-Nitrogen Oxide
N2O Nitrous Oxide
OCV Open Circuit Voltage PC Propylene Carbonate PCM Phase Change Material
PHEV Plug–In Hybrid Electric Vehicle PM Particulate Matter
RESS Rechargeable Energy Storage System RoH Rate of Hybridization
SEI Solid Electrolyte Interface
SIMPLE Semi-Implicit Method for Pressure-Linked Equations SoC State of Charge
TECM Thermal Equivalent Circuit Models TIS Thermal Impedance Spectroscopy VRLA Valve Regulated Lead–Acid
XIX
List of Symbols
𝐴𝑡𝑎𝑏 Cross section of the tab (m2)
A cross section of the cooling channel (m2)
𝑐1 Concentration of lithium in the active material particles (mol/m3)
𝑐2 Concentration of lithium in the electrolyte (mol/m3)
𝐶𝑑𝑙 Electrical double layer capacitance, (F/m2)
𝐶𝑝 Thermal capacitance (J/kg.K)
𝑐𝐹 inertial coefficient of liquid state of the PCM
𝑑ℎ hydraulic diameter
𝑑𝐻 the latent heat (kJ.kg-1)
𝐷1 Diffusion coefficient of lithium in the solid phase (m2/s)
𝐷2 Diffusion coefficient of lithium in the electrolyte (m2/s)
∆S Entropy (J.K-1)
𝐸𝑎𝐷𝑠,𝑗 Activation energy for particle diffusion (J/mol) 𝐸𝑎𝑅,𝑗 Activation energy for reaction (J/mol)
𝑑𝐸
𝑑𝑇 entropy coefficient (V.K-1)
𝑓± Average molar activity coefficient
𝐹 Faraday’s constant (C.mol-1)
𝐹𝑔𝑟𝑎𝑣𝑖𝑡𝑦 body force due to the gravity (N)
𝑓𝐷 Darcy friction factor
ℎ Convective heat transfer coefficient (W/m2K)
𝑖1 Electronic current density in the solid phase (A/m2)
𝑖2 Ionic current density in the liquid phase (A/m2)
𝑖𝑁 Normal inward current density trough the electrode/CC
interfaces (A/m2)
𝑖𝑎𝑝𝑝 Total applied current density (A/m2)
I applied current
𝐽0 Exchanged current density (A/m2)
𝐽𝑛 Local charge transfer current density (A/m2)
𝑘0 Reaction rate constant (m2.5/mol0.5 s)
K Permeability of the aluminum-foam (m2)
𝐿𝑃𝐶𝐶
Positive current collector thickness (m) 𝐿𝑃 Positive electrode thickness (m)
𝐿𝑆
Separator thickness (m)
𝐿𝑁𝐸 Negative electrode thickness (m)
XX n Number of electrons transferred N Total number of single cell N𝑢 Nusselt number
p Pressure of the fluid (Pa)
𝑝𝑎 atmospheric pressure (Pa)
Pg total heat generation (W.m-3)
P𝑟 Prandtl number
q Heat source per volume (W.m-3)
𝑞𝑣,0 Volumetric flow rate (m3.s-1)
r Radius distance variable of the solid particles (m) R𝑒 Reynolds number
R Gas constant, 8.314 (J/mol.K)
𝑅𝑠 Radius of electrode particle (m) R’ Internal Resistance of the battery (Ω)
𝑅′′ Electrical resistance (Ω)
Rth conductive thermal resistance (K W−1)
Rcon convective thermal resistance (K W−1)
𝑆𝑎 Specific surface area (m-1)
S Cross section
t Time (s)
𝑡+ Transferring number of Li+
T Absolute temperature (K)
𝑢 velocity vector of liquid state in PCM (m/s)
v Averaged fluid velocity (m/s)
V Volume (m3)
Z wetted perimeter of the cooling channel (m) 𝜀2 Electrolyte volume fraction
𝜀1 Active material volume fraction ϵ emissivity
𝛷1 Solid phase potential (V)
𝛷2 liquid phase potential (V)
𝛷𝑐𝑐 Current collector potential (V)
α Charge transfer coefficient γ Bruggeman tortuosity exponent
η Local surface overpotential (V) 𝜎1 Electronic conductivity of solid matrix (S/m) 𝜎2 Ionic conductivity of electrolyte (S/m)
𝛽 thermal expansion coefficient of the liquid state of the PCM (K-1)
𝜑 volume fraction of liquid state in PCM
XXI
λ Thermal conductivity (W/m.K)
𝜌′′ Resistivity (Ω.m)
σ the Stefan–Boltzmann constant (Wm−2K−4)
Chapter 0. General Introduction
1
0. General Introduction
0.1 Goal
Global climate change and air pollution are key challenges for today’s human society, affecting our thinking to new technological innovations. Major eco-friendly changes have to be made at each level and in each sector. For the automotive industry, this means that our main way of transport, now mainly based on the ICE (Internal Combustion Engine) has to innovate even more relating to a clean environment. One of the possibilities is the electrification of our fleet of cars, vans, motorcycles, buses, trucks... Hybrid Electric Vehicles (HEVs) and Plug in Hybrid Electric Vehicles (PHEVs) are the first steps to make the transition possible to the fullest electrification (Battery Electric Vehicles (BEVs)) of the automotive sector in the future. BEVs, HEVs and PHEVs today still are facing some technical and economic challenges related to the range, charging time, lifetime and battery cost. The batteries must operate in a certain envelope of voltage, current and temperature for optimal performance and for safety considerations. Regarding temperature, the BTMS (Battery Thermal Management System) is needed to maintain the operating temperature of the batteries within the operational range. The BTMS should be optimized in order to increase its effectiveness and the battery performance and to reduce its complexity, size, weight and cost.
0.2 Outline of performed research work
This PhD is divided in six chapters:
- Chapter 1: Background information
This chapter presents a brief description of the environmental impact of the transportation sector regarding energy consumption and gas emissions. In addition, the state-of-the-art of EVs, HEVs and PHEVs is presented as potential solution of the environmental issues. Furthermore, the characteristics and specifications of the different batteries used in these vehicles are compared and analyzed. Finally, the specifications of some recent commercial vehicles are also reported.
- Chapter 2: State-of-the-Art of Battery thermal management
This chapter is mainly focused on the review of the different battery thermal models that have been developed, their characteristics and their applications. The shortcomings of
Chapter 0. General Introduction
2
these models are also described. Furthermore, the different battery thermal management used in the literature is also discussed in depth. Some basic numerical methods and software tools are also analyzed and documented.
- Chapter 3: Electrical-Thermal Model for Large Size Lithium-Ion Cells
In this chapter, a two dimensional electrical-thermal model has been developed in order to investigate and to analyze the temperature distribution over the battery surface. The ANSYS FLUENT software has been used to solve the model development. The model is validated by experimental results. In addition, a new estimation tool has been developed for the estimation of the proposed thermal model parameters. Furthermore, the thermal behavior of the battery has been investigated at different environmental conditions as well as during abuse conditions.
- Chapter 4: Pouch Cell Design: Impact of Tab Location
Following chapter 3, the developed model has been extended to three-dimensional (3D) level and in particular for large lithium iron phosphate oxide (LiFePO4) pouch cells. 3D simulations of the Li-ion battery behavior are highly nonlinear and computationally demanding. Integration of the electrochemical model to the thermal models represents an important step towards accurate simulation of the thermal behavior of Li-ion batteries. Non-uniform temperature, potential and current density through the battery induce non-uniform use of the active material and can have a negative impact on cell performance and lifetime. Different pouch cell designs, with different tab locations, have been investigated in terms of performance, current density, potential and heat distributions. The developed model has been validated against experimental data at different current discharge rates. Afterwards, the electrochemical, thermal and electrical behaviors over each cell design at high discharge current rate (4 It) are compared between different
design configurations.
- Chapter 5: Numerical Analysis of Different Battery Thermal Management Systems In this chapter different thermal management strategies such as water cooling and passive cooling using phase change material embedded in an aluminum foam (liquid-solid phase change) have been investigated by using the developed electrochemical-thermal model in chapter 4 coupled with fluid dynamics. The model has been developed in COMSOL Multiphysics. At first, different liquid cooling plate’s configurations have been investigated in order to obtain the suitable and efficient cooling architecture, which allows to decrease the temperature and to obtain a more uniform temperature
Chapter 0. General Introduction
3
distribution over the surface of the battery cell. Secondly, the performances of the battery thermal management system (BTMS) of a battery module with 10 cells, cooled by the efficient cooling plate architecture have been investigated by varying the cold plate locations. The select BTMS design with the efficient cold plate arrangement is analyzed at different load conditions, liquid inlet (temperature and flow rate), and initial temperature. Finally, the passive cooling using phase change material embedded in an aluminum-foam have been investigated and compared to the liquid cooling method. The impact on the cost of the different solutions are also discussed.
- Chapter 6: Conclusions, Contributions and Future Work
The different results obtained in this PhD are summarized. The added value of this thesis as well as the future work have been discussed.
Chapter 0. General Introduction
5
Chapter 1. Background Information
7
1. Background Information
1.1 Introduction
Since the urban areas and populations are expanding worldwide [1], the world energy consumption is constantly increasing. The transportation sector in particular is one of the major global consumers of energy. It remains the main driver of economic growth and social opportunities. Between 1990 and 2010, final energy consumption from overall transport in EU-28 have increased by more than 30% as shown in Figure 1.1a. This trend can be explained by the growth in number of vehicles particularly in new member countries of the EU. In addition, transportation in EU-28 remains highly oil dependent, more than 75% are derived from crude oil as illustrated in Figure 1.1b. Because the technology of the transportation sector is still dominated by the conventional internal combustion engine (ICE), which uses mainly gasoline or diesel.
(a) (b)
Figure 1.1: final energy consumption (a) total and (b) petroleum products by sector in the EU-28, 1990-2010 [2]
Chapter 1. Background Information
8
Furthermore, the transport sector is one of the main contributors of greenhouse gas (GHG) emissions (CO2, CH4 and N2O), representing 25% above level, which has been defined in 1990 [3]. As illustrated in Figure 1.2, from 1990 to 2012, only the GHG emissions from overall transport in the EU-28 are increasing while emissions from others sector are generally decreasing. The GHG emissions are also directly related to the fuel consumption. The greenhouse gas emissions are responsible for the air pollution, which harms human health and environment, and contributed to the global warming.
Figure 1.2: change of Greenhouse gas (GHG) emissions from 1990 to 2012 in CO2 equivalents (Tg) by sector in the EU-28 [4].
In the last decade, some efforts are being made to reduce the fuel consumption and GHG emissions in the transportation sector. From the vehicle manufacturers' point of view, this reduction of fuel consumption GHG emissions involved the lightening of the vehicle body structure, the reduction of the aerodynamic drag coefficient and the improvement of engine efficiency. Beside, from a political point of view, several European policies and regulations have been established aiming at the reduction of GHG emissions from transport. Among the well-known, one can mention:
- The council directive 70/220/EEC [5], introduced in 1970, is related to reduce the air pollution from the engine of motor vehicles,
- The Euro regulations: Different Euro emissions regulations [5]–[9] for light–duty vehicles are introduced. They define the mandatory limit in g/km for a list of
Chapter 1. Background Information
9
pollutants (carbon monoxide (CO), nitrogen oxides (NOx), hydrocarbons (HC) and particulate matter (PM10)).
To achieve these targets, the transport has to innovate even more related to a clean environment. The vehicles with electric propulsion are considered as an attractive option on the pathway to reduce GHG emissions.
Due to major progress in rechargeable energy storage system (RESS), the sales of vehicles with electric operation mode are expected to increase. The overall target of a 50% reduction in global energy-related CO2 emissions by 2050 [10] compared to 2005 levels can be achieved by performing annual sale of about 50 million of electrical vehicles by 2050 as shown in Figure 1.3.
Figure 1.3: Annual global EV and PHEV sales [11]
1.2 Alternative powertrains
1.2.1 Hybrid Electrical Vehicles (HEVs)
Hybrid Electric Vehicles (HEVs) are the first steps to make the transition possible to the fully electrification of the automotive sector in the future. In principle, there are two energy sources in HEVs: the conventional internal combustion engine (ICE), which uses mainly gasoline or diesel operates in combination with an electric motor generally powered by battery or a combination of battery and electrical double-layer capacitors (EDLCs). The HEVs have the advantage of reducing the fuel consumption and emissions. The electric motor allows energy recovery to the battery system during braking, provides additional power to assist the ICE during pick power demand, and then allows reducing the size and power of the ICE.
Chapter 1. Background Information
10
The main hybrid topologies are the series hybrid (Figure 1.4), the parallel hybrid (Figure 1.5) and the series-parallel combined hybrid (Figure 1.6). In the series topology, the traction is obtained by only the electric motor and an ICE works as a generator to power the electric motor or recharge the battery. As the different energy sources are decoupled, the series hybrid has the advantage of operating the ICE only when needed. Thus, it can run at optimum speed and efficiency [12]. However, the disadvantage of the series hybrid topology is that it implies higher losses due to the double energy conversion. This topology is usually used in heavy vehicles (buses, locomotives, military vehicles, etc…).
Figure 1.4: Series hybrid topology [12]
In parallel hybrid technology, the traction is obtained through a mechanical coupling of the ICE and the electric motor. They can supply the vehicle traction individually or together. The major advantage of this topology is that the energy loss due to the conversion is small. In addition, it required small traction motor and due to the missing of the generator, the system is compact. Passenger cars usually use the parallel configuration. The main disadvantage is the ICE operation still depending on vehicle speed.
Figure 1.5: Parallel hybrid topology [12]
In the combined hybrid topology, the advantages of previous two topologies are combined. It often makes use of a planetary gear to connect the ICE and the two electric machines with the wheels of the vehicles.
Chapter 1. Background Information
11
Figure 1.6: Combined hybrid topology [12]
Several hybrid concepts are created based on the rate of hybridization (RoH) [12] such as the Micro-HEVs, the Mild-HEVs, the Full-Hybrid and the PHEVs. According to the RoH, the functions performed by the electric motor are different. The RoH is equal to 1 if the both energy sources (ICE and electric motor) have an equal contribution to the vehicle traction effort. If only one of both energy sources is used, the RoH is equal to zero. Table 1.1 summarized the functions of the different HEVs according to the RoH. In Table 1.2, the performances and characteristics of different commercial HEVs, from the manufacturer values, are compared.
Function System Stop & Start Electric traction Regenerative Braking Electric driving only External Battery Charge Conventional
vehicle (ICE) Possible No No No No Micro-HEV Yes No Minimum No No
Mild-HEV/medium HEV
Yes Limited Yes Minimum No
Full HEV Yes Yes Yes Yes No
PHEVs Yes Yes Yes Yes Yes
Table 1.1: Different HEVs types and their main functions/Characteristics [13]
1.2.2 Plug-in Hybrid Electric Vehicles (PHEVs)
The PHEVs are based on the three basic hybrid topologies described above. They are generally using with high capacity batteries, with a typically energy content up to 15 kWh, for passenger cars that can be charged externally from the power grid. They can store enough electricity to decrease significantly the petroleum consumption. This allows having an all electricity range from 15 to above 100 km [14]. In Table 1.3, the performances
Chapter 1. Background Information
12
and characteristics of different commercial PHEVs, from the manufacturer values, using Lithium ion battery, are compared. The charging can be standard charge (220V, 10 or 16 A) or Fast charge (400V, 32 or 63 A) [13].
1.2.3 Battery Electric Vehicles (BEVs)
Battery Electric Vehicles (BEVs) are using an electric motor powered by the battery packs for traction. With the advancement of new battery technology, such as Lithium ion battery, BEVs become more attractive. They are expected to perform more acceleration with a speed up to 200 km/h and ranges up several hundred kilometers with top-range commercial BEV such as the Tesla [13]. In Table 1.4, the performances and characteristics of different commercial BEVs, from the manufacturer values, using Lithium ion battery, are compared. The BEVs can be recharged at home through a standard 230V connection, or at charging station, or wireless charging with inductive technology.
Chapter 1. Background Information
13 Model Battery type content Energy
(kWh) Electric motor power [kW] Electric range [km] Max vehicle speed in pure electric [km/h] Battery thermal management Audi Q5 Hybrid (Full HEV) Li-ion (266V/5Ah) 1.3 40 3 100 Air-cooling BMW ActiveHybrid 3
(Full HEV) (317V/2Ah) Li-ion 0.675 41 4 70 Air-cooling BMW ActiveHybrid 5
(Full HEV)
Li-ion
(317V/2Ah) 0.675 40.5 4 60 Air-cooling BMW ActiveHybrid 7
(Mild HEV) (120V/6.6Ah) Li-ion 0.8 15 4 60 Liquid-cooling Nissan Infiniti M35h (Full HEV) Li-ion (346V/3.7Ah) 1.4 50 No data available 80 Air-cooling Mercedes S400 Class
Hybrid (Mild HEV) Li-ion 0.8 20 available No data available No data Air-cooling Table 1.2: Prototypes/commercial HEVs [13], [15]
Model Battery type
Energy content (kWh) Electric motor power [kW] Electric range [km] Max vehicle speed in pure electric [km/h] Battery thermal management Mercedes Vision S500 Plug-in HYBRID (PHEV) Li-ion 10 85 33 140 Water-cooling
Toyota Prius Plug-in
(PHEV) NiMH 4.4 60 22 100 Air-cooling
Volvo V60 Plug-in Hybrid (PHEV)
Li-ion 11.2 51 49 112 Water-cooling
Chapter 1. Background Information 14 Model Battery type Energy content (kWh) Electric motor power [kW] Electric range [km] Max vehicle speed [km/h] Battery thermal management
BMW i3 (EREV) Li-ion 23 126 225 150 Air-cooling
Chevrolet Spark EV
2014 (BEV) Li-ion 21 110 130 193 Liquid-cooling
Chevrolet Volt (EREV)
Li-ion 16.5 110 60 160 Liquid-cooling
Citroën C-Zero
(BEV) Li-ion 16 47 150 130 Air-cooling
Fiat 500e (BEV) Li-ion 24 83 140 115 Liquid-cooling
Ford Focus EV (BEV) Li-ion 23 108 160 136 Liquid-cooling
Honda FIT EV (BEV) Li-ion 20 92 130 70 Air-cooling
Mini E (BEV) Li-ion 35 150 200 152 Air-cooling
Nissan Leaf (BEV) Li-ion 24 80 175 93 Air-cooling
Peugeot iOn (BEV) Li-ion 16 47 150 130 Air-cooling
Renault Fluence Z.E. (BEV)
Li-ion 22 70 160 135 Air-cooling
Renault Kangoo Z.E.
(BEV) Li-ion 22 44 160 130 Air-cooling
Renault Zoe Z.E. (BEV)
Li-ion 22 65 160 140 Air-cooling
Toyota eQ (BEV) Li-ion 12 46 100 125 Liquid-cooling
Volvo C30 (BEV) Li-ion 21.5 40 150 130 Liquid-cooling
Chapter 1. Background Information
15
1.3 Lithium-ion battery
Lithium-ion battery (LIB) has received considerable attention for traction uses due to the higher energy density (70-170 Wh/kg), power capabilities, lowest standard reduction voltage (Eo=-3.04V) and low atomic mass compared to previous battery technologies. Figure 1.8 shows the relationship between various types of secondary batteries in a Ragone plot. The required amount of energy stored in PHEVs and EVs is much higher than for HEVs in order to be able to travel long distances in all electric range. In the 2000s, the LIB are considered as one of the most promising solutions for environment-friendly transportation such as HEVs, PHEVs and EVs.
Figure 1.8: Specific energy and specific power of different battery types [16] Basically, LIB includes different components (cathode, anode, separator and electrolyte) and work according to the so-called “extraction/insertion” process. The LIB cells are configured in various shapes such as coin, cylindrical, pouch and prismatic as shown in Figure 1.9. The basic working principle of the LIB is described in Figure 1.10. During charging lithium-ions are extracted from the cathode and migrate via the electrolyte into the anode. The reverse mechanism occurs during discharging
Chapter 1. Background Information
16
(a) (b) (c)
Figure 1.9: Different lithium-ion battery design concepts: (a) cylindrical, (b) pouch and (c) prismatic cells [17]
Chapter 1. Background Information
17
Based on the used cathode and anode materials, different types of LIB have been adopted and show different performance, cost and safety characteristics.
1.3.1 Cathode material
According to the cathode material, different LIB can be categorized by material crystal structure, including the layered compounds LiMO2, the spinel compounds LiM2O4 and
the olivine compounds LiMPO4 as illustrated in Figure 1.11. In recent years, new
structure intercalation such as silicates Li2MSiO4, borates LiMBO3 and tavorites LiMPO4F
compounds are also gaining attention.
(a) (b) (c)
Figure 1.11: crystal structure of: (a) layered, (b) spinel and (c) olivine [19]
For the Layered compounds LiMO2: the transition metal intercalation oxides MO2 and
the Li layers are stacked alternatively. The most common lithium ion candidate taking part to this group are listed below [18], [19]:
- Lithium cobalt oxide (LiCoO2 or LCO): The LCO batteries are widely used in
portable applications. The presence of toxic, the high cost and the structural instability of the material that raised some safety issues, are the main disadvantages of this material. The LCO batteries can deliver only 140 mAh/g capacity (compared to 160 mAh/g of theoretical capacity) and are not suitable for HEV and EV applications[19].
- Lithium nickel cobalt aluminium oxide (LiNi0.8Co0.15Al0.05O2 or NCA): in order to
improve the stability of the LCO, the nickel has replaced some cobalt atoms because nickel is cheaper than cobalt and then it can reduce the battery cost. Aluminium doping is beneficial to stabilize the charge transfer impedance on the cathode side and improving the electrolyte stability. The NCA has a specific capacity of 200 mAh/g, however the cycle life remains short [19].
Chapter 1. Background Information
18
- Lithium nickel manganese cobalt oxide (LiNi1/3Mn1/3Co1/3O2 or NMC), which
have a specific capacity of 180 mAh/g. The NMC batteries are less costly than the others layers compounds battery due to the presence of the Manganese (Mn).This technology becomes a good candidate for BEVs.
For the spinel compounds LiM2O4, in this crystal structure, the Li-ions occupy the
tetrahedral sites in the transition metal layers. The spinel Lithium manganese oxide (LiMn2O4 or LMO) is a promising cathode electrode due to its high operating voltage
(3.5-4.5V), lower cost and lower toxicity. They are now powering the Nissan Leaf and the Chevrolet Volt.
For the olivine compound LiMPO4, these crystal structures are receiving more attention
because of these stabilities compared to the layered and spinel compounds. Among them, the Lithium iron phosphate (LiFePO4 or LFP) has been proposed as a promising
candidate to overcome the weakness of the earlier cathode material. The LFP have an excellent thermal stability, show high cycle life, and are low cost and less toxic. However, the operating voltage (3.3 V) and energy density are rather low.
1.3.2 Anode material
As mentioned above, during discharge the Li ions are intercalated into the anode. The most common anode material are listed below:
- Graphite: due to its high specific capacity of 372mA [20], graphite seems to be the most appropriate anode material. However, graphite-based anodes have some limitation due to the poor performance at low temperature and the formation of a passive solid electrolyte interface (SEI) layer[21]. An SEI layer is formed because lithium intercalation reaction proceeds on graphite at such a low potential that the organic electrolyte, consisting of LiPF6 dissolved in organic solvents, becomes
unstable and reacts with the electrode[22]. This layer makes the graphite electrode less reactive towards further decomposition of the electrolyte and the reactions continue to some extent consuming the electrolyte during charging of the battery. Another drawback of a graphite anode, resulting from the low lithium insertion potential, is the deposition of metallic lithium on the electrode surface. This irreversible reaction occurs especially when charging at sub-zero temperatures or using too high a charging rate. Very reactive metallic lithium consumes the
Chapter 1. Background Information
19
electrolyte and may result in dendrite formation and even in internal short-circuiting of the battery.
- LTO [23], [24] is a more ideal insertion material because of its high lithium insertion potential of about 1.55 V versus Li/Li+ where the electrolyte is more
stable and metallic lithium formation thermodynamically less favorable making the battery safer and more durable. LTO has also very small dimensional changes during lithium intercalation/de-intercalation and consequently, mechanical stress during battery cycling is low. As no electrolyte consuming SEI layer is formed and dimensional changes are low, batteries with an LTO anode show long cycle life. However, the specific capacity is only 175 mAh/g and thus the batteries have a low energy density. Because of the high anode potential, batteries with an LTO anode have low operating voltages, comparable to lead acid batteries. LTO has a spinel structure, whereby the surface area is typically much larger than that of carbon-based electrodes [25]. The larger surface area allows moving the electrical charges more quickly. Thus, the LTO does not suffer from high current rates. In the last few years, several companies such as Toshiba, EIG Batteries and Altairnano have begun commercializing this technology.
1.3.3 Electrolyte
In LIB, the lithium-ion migrate from electrode to electrode through the electrolyte. Several requirements must be satisfied by the electrolyte, such as larger ionic conductivity (higher than 10-3 S/cm[21]), a stabilized evolution of the solid electrolyte
interface (SEI) (interface between electrolyte and electrode) and a higher thermal and electrical stability [22]. Several liquid electrolytes are used in LIB, such as Lithium hexafluorophosphate (LiPF6), Lithium tetrafluoroborate (LiBF4), lithium triflate
(LiSO3CF3) and lithium tris (trifluoromethanesulfonyl) methide (LiC(SO2CF3)3) [26]. Due
to its higher ionic conductivity, the LiPF6 is mostly used and they are often dissolved on
carbonate-based aprotic solvents such as: propylene carbonate (PC), ethylene carbonate (EC), diethyl carbonate (DEC), ethyl methyl carbonate (EMC) or dimethylene carbonate (DMC).
Chapter 1. Background Information
20
1.3.4 Summary of commercial lithium ion batteries
As shown below, several materials have been adopted for use in commercial lithium ion batteries. The choice depends on the targeted application and the operation conditions. Table 1.5 shows the characteristic list of the most common lithium ion candidates for EV and HEV.
Nominal Cell Specific Capacity Positive/Negative Electrode
Material Voltage/V Positive/Negative/(mA.h.g
-1) LiCoO2 (LCO)/graphite 3.7 120/370 LiMn2O4(LMO)/graphite 3.7 100/370 LiNiO2/graphite 3.7 170-180/370 LiNi1/3Mn1/3Co1/3O2 (NMC)/graphite 3.7 130-160/370 LiCo0.2Ni0.8O2/graphite 3.7 200/370 LiNi0.8Co0.15Al0.05O2 (NCA)/graphite 3.7 180/370 LiFePO4(LFP)/graphite 3.7 150-160/370 Li4Ti7O12 (LTO)/LFP 3.7 150-160/150-160
Table 1.5: Characteristics of some commercial lithium Ion batteries [18], [27], [28]
1.3.5 Choice of the battery chemistry in this PhD
Due to the availability of the cells in the framework of research project, as well as to the properties of this technology, the lithium iron phosphate battery of 45Ah pouch type cell, as shown in Figure 1.12, was selected as high energy storage component. This cell is manufactured by the European Batteries. The performance parameter characteristics of cell is included in Table 1.6.
Chapter 1. Background Information
21
Nominal capacity BoL/Ah 45
Nominal Voltage/V 3.2
Max. voltage/V 3.65
Min. voltage/V 2
Weight/kg 0.99
Nominal Energy EoL/Wh 144
Spec. Energy BoL Wh/kg 145
Max. discharge current cont/A 135 Peak Current discharge 10s/A 180 Peak regen. Current 10s / A 90 Peak spec. discharge power 10s W/kg 580 Peak discharge power 10s /W 576
Chapter 1. Background Information
23
Chapter 2: General State-of-the-Art of
Battery Thermal Management
Chapter 2. State-of-the-Art of Battery Thermal Management
25
2. State-of-the-Art of Battery Thermal
Management
2.1 Goal
This chapter is mainly focused on the review of the different battery thermal models that have been developed, their characteristics and their applications. The shortcomings of these models are also described. Furthermore, the different battery thermal management used in the literature is also discussed in depth. Some basic numerical methods and software tools are also analyzed and documented.
2.2 Introduction
As mentioned in chapter 1, lithium-ion batteries have emerged as a key energy storage technology and are now the main technology for portable devices. Due to their high potential and their high energy and power densities, and also their good lifetime, they are now the preferred battery technology, which has been able to provide longer driving range and suitable acceleration for electrically propelled vehicles such as Hybrid Electric Vehicles (HEVs), Battery Electric Vehicles (BEVs) and Plug-In Hybrid Electric Vehicles (PHEVs) [16], [29]–[31]. However, cost, safety and temperature performance issues remain obstacles to its widespread application. As known, during the discharge or charge process, various exothermic chemical and electrochemical reactions occur. These phenomena generate heat that accumulates inside the battery and therefore accelerates the reaction between cell components. With higher discharge/charge current rates, the heat generation in a battery increases significantly. If heat transfer from the battery to the surroundings is not sufficient, the battery temperature can rise very fast and exceed the safe temperature range. In the worst-case scenario (Figure 2.1) thermal runaway can occur [32]–[34]. For optimal performance, safety and durability considerations, the battery must operate within the safe operating range of voltage, current and temperature as indicated by the battery manufacturer. Figure 2.1 shows the safe operating window for a typical LiFePO4/graphite cell [35]. The voltage range is between the maximum voltage (3.65V) and the minimum voltage (2V), the temperature range is depending on the operating mode (charge and discharge) and varies between [-20°C; 60°C] and [0°C; 40°C] during discharge and charge, respectively. These ranges can change according to the cell chemistry and battery manufacturer [36].
Chapter 2. State-of-the-Art of Battery Thermal Management
26
Figure 2.1: Thermal runaway process [37]
Chapter 2. State-of-the-Art of Battery Thermal Management
27
Regarding the temperature issue, a Battery Thermal Management System (BTMS) as a part of the whole battery system is needed for implementation to maintain the operation temperature of the batteries between those boundaries. The BTMS must be optimized to suit the operational conditions specific for each application. A better understanding, evaluation and comparison of the different BTMS in an objective way is needed to have the optimum battery performances. This would also give the opportunity to make the BTMS smaller, cheaper, compact, efficient, and light, dedicated to its operation area… If less attention is spent on the BTMS, problems could arise around safety, durability and life cycle, range…
In this way the design, evaluation and comparison of BTMSs are crucial for better battery performance and setting future goals on the expectations of BEVs.
This chapter is firstly focused on giving a brief description of the temperature impact on the lithium ion battery cell. Then a review of the different battery thermal models that have been developed and their characteristics are analyzed. Furthermore, the different existing battery thermal management systems used in the literature are also discussed in depth. Some basic numerical methods and software tools are also analyzed and documented.
Chapter 2. State-of-the-Art of Battery Thermal Management
28
2.3 Battery thermal behavior, modeling and characterization
2.3.1 Battery geometry, external and internal structures
As shown in chapter 1, commercial lithium-ion batteries can be classified according to cell shape and component materials. The various forms of batteries include cylindrical, prismatic and pouch cells, as illustrated in Figure 2.3. This figure describes the key components in a LIB, such as the cathode active material, the anode active material the current collector (aluminium and copper), the separator the electrolyte and the tab outer casing. Cylindrical cells have spiral wound structure and are easier to manufacture with a good mechanical stability. However, they have relatively a low packing energy density. Prismatic cells have jelly roll or stacked layer structures with high packing efficiency and are more expensive to manufacture. Pouch cells, which could be considered as thin prismatic cells within a flexible enclosure. They have stacked layer structure with higher energy density than the prismatic and cylindrical cell, and provide more flexibility of the design aspect and are relatively less expensive. However, they remain mechanically vulnerable, and require a strong case for the module packaging. As mentioned in chapter 1, section1. 3, all these three types of LIB include several single battery layer with a dimension of 100 microns. Each single battery layer contains different components (cathode, anode, separator and electrolyte) and work according to the so-called “extraction/insertion” process.
Figure 2.3: Internal structure of the different shape of LIB: (a) cylindrical, (b) prismatic and (c) pouch [38]
Chapter 2. State-of-the-Art of Battery Thermal Management
29
2.3.2 Impact of temperature on the battery behaviors
A thermal management system for batteries is needed because of the best optimal temperatures of the batteries do not comply completely with the possible operating temperatures of the vehicle. The best temperature range of ambient temperature for Li-ion batteries is situated between 25°C and 40°C [39], while the operatLi-ion range of a vehicle is possible between -30°C and 60°C depending on the geographic regions and climatic zones.
Phenomena that occur when the temperature exceeds the prescribed limits are briefly summarized in Table 2.1 [39]. Global trends of battery behaviors are related to the chemistry, design and manufacturer of the battery package. Low temperature induces to the capacity drop and internal resistance increase due to the lower chemical activity. The increase in resistance will result in a higher heat generation. However, high temperature leads to an increase of the internal resistance, to self-discharge and in worst case to thermal runaway. These phenomena may reduce battery performance and lifetime [40]– [42].
Low temperature (<0°C) - Capacity drop
- Internal resistance increase High temperature (>40°C) - Internal resistance decrease
- Accelerated aging phenomena - Higher self-discharge
- Decomposition of electrolyte
- Thermal runaway, safety considerations - Reduced life cycle
Table 2.1: Influence of temperature on working principle of batteries: global trends [39]
2.3.3 Effect of cell design on the cell behaviors
Advanced research in the field of rechargeable energy storage (RESS) enables to a wide use of large-format, high-capacity Li-ion cells in PHEVs and EVs. This format has the advantage of reducing the number of cells in the module, increasing the capacity and reducing the size and weight at the pack level. Increasing the current amplitude during the charge/discharge process subjects the large format battery to abuse situations and leads to non-uniform distributions of temperature, potential, current density and heat generation through the cell. Bad design and extreme operation conditions of large format cells may reduce battery performance and lifetime. Therefore, good cell design is
![Figure 2.5: Voltage response of a lithium-ion cell after a current pulse[55]](https://thumb-eu.123doks.com/thumbv2/123doknet/14699774.746783/61.918.209.706.114.406/figure-voltage-response-lithium-ion-cell-current-pulse.webp)