Publisher’s version / Version de l'éditeur:
Plastics, Rubber and Composites - Macromolecular Engineering, 34, 9, pp.
387-392, 2005-11-01
READ THESE TERMS AND CONDITIONS CAREFULLY BEFORE USING THIS WEBSITE.
https://nrc-publications.canada.ca/eng/copyright
Vous avez des questions? Nous pouvons vous aider. Pour communiquer directement avec un auteur, consultez la
première page de la revue dans laquelle son article a été publié afin de trouver ses coordonnées. Si vous n’arrivez pas à les repérer, communiquez avec nous à PublicationsArchive-ArchivesPublications@nrc-cnrc.gc.ca.
Questions? Contact the NRC Publications Archive team at
PublicationsArchive-ArchivesPublications@nrc-cnrc.gc.ca. If you wish to email the authors directly, please see the first page of the publication for their contact information.
NRC Publications Archive
Archives des publications du CNRC
This publication could be one of several versions: author’s original, accepted manuscript or the publisher’s version. / La version de cette publication peut être l’une des suivantes : la version prépublication de l’auteur, la version acceptée du manuscrit ou la version de l’éditeur.
For the publisher’s version, please access the DOI link below./ Pour consulter la version de l’éditeur, utilisez le lien DOI ci-dessous.
https://doi.org/10.1179/174328905X71977
Access and use of this website and the material on it are subject to the Terms and Conditions set forth at
Real-time ultrasonic diagnosis of polymer degradation and filling
incompleteness for micromoulding
Whiteside, B. R.; Brown, E. C.; Ono, Y.; Jen, C.-K.; Coates, P. D.
https://publications-cnrc.canada.ca/fra/droits
L’accès à ce site Web et l’utilisation de son contenu sont assujettis aux conditions présentées dans le site LISEZ CES CONDITIONS ATTENTIVEMENT AVANT D’UTILISER CE SITE WEB.
NRC Publications Record / Notice d'Archives des publications de CNRC:
https://nrc-publications.canada.ca/eng/view/object/?id=2c918cbb-6ea9-4476-ba5d-4c5c0d9ad565 https://publications-cnrc.canada.ca/fra/voir/objet/?id=2c918cbb-6ea9-4476-ba5d-4c5c0d9ad565Published by Maney Publishing (c) IOM Communications Ltd
Real-time ultrasonic diagnosis of polymer
degradation and filling incompleteness in
micromoulding
B. R. Whiteside
1, E. C. Brown
1, Y. Ono*
2, C.-K. Jen
2and P. D. Coates
1Injection moulding techniques have been miniaturised and refined to achieve micromoulding
which aims to satisfy the need for mass production of low-cost micro- and nanoscale
components. However, the microscale mould cavity features and extreme processing conditions
which are inherent in the process can result in larger process variations than conventional
injection moulding, with a corresponding increase in the probability of producing an
unsatisfactory product. Accurate process diagnosis is required to ensure process reliability but
integration of sensors onto the small and highly detailed mould units can be problematic and
alternatives may need to be sought. Piezoelectric film ultrasonic transducers were integrated onto
the extrusion barrel and mould insert of a micromoulding machine for real-time, non-destructive
and non-intrusive process diagnosis with an ultrasonic pulse-echo technique. Polymer
degradation owing to excessive heating at the extrusion barrel was successfully probed by
measuring the ultrasonic velocities in the polymer at the mould insert. Filling incompleteness of the
mould cavity was also sensitively detected by monitoring the ultrasonic energy variation
transmitted into the part at different points along the melt flow length. The developed ultrasonic
sensors and technique enable optimisation and in-process quality assurance of the moulded
parts which ensures that maximum process efficiency can be achieved.
Keywords: Integrated ultrasonic sensors, Process diagnosis, Micromoulding, Polymer degradation, Filling incompleteness, Melt flow speed
Introduction
Polymer injection moulding is a widely used manufactur-ing process for both prototypmanufactur-ing and mass production of net shape products with complex three-dimensional structures, with a huge variety of end uses including automotive components and housings for consumer electronics. Recently, injection moulding techniques have been miniaturised and refined to achieve micro-moulding which aims to satisfy the need for mass production of low-cost micro- and nanoscale compo-nents required for Micro Electro Mechanical Systems (MEMS), miniature optoelectronics and biomedical devices such as drug delivery systems, implants and lab on a chip technologies.1–3 The micromoulding process has the ability to mould microscale components and surface features with a precision that is not possible to achieve using conventional injection moulding technol-ogy, but is also much more sensitive to process fluctuations and material consistency where a small
change in the environment or a slight material impurity can produce a substandard product.
As a result of the small shot masses associated with the micromoulding process, residence times of the polymer melt inside the small extrusion barrel can be relatively long, resulting in degradation of the polymeric materials. When the mould cavity scale becomes tiny (under 1 mm), the melt material may not be able to completely fill the fine and/or high aspect ratio cavity features because of premature selidification caused by inadequate mould temperature and/or injection pres-sure. The narrow process window involved with the melt flow, solidification and microstructure development in micromoulded products ensures that detailed process interrogation at each stage in the moulding cycle is a valuable tool for product quality optimisation and process diagnosis. However, the small cavity dimen-sions, complexity of the machines and complicated mould assemblies can prove problematic when consider-ing locations for conventional pressure and temperature sensors.
In order to circumvent these current limitations, an ultrasonic method is chosen in the present study because of its ability to probe the properties of polymers within both the extrusion barrel and mould cavity during polymer processing.4–15 Newly developed piezoelectric
1IRC in Polymer Science & Technology, University of Bradford, Bradford
BD7 1DP, UK
2Industrial Materials Institute, National Research Council Canada,
Boucherville, Quebec, Canada, J4B 6Y4
Published by Maney Publishing (c) IOM Communications Ltd
film ultrasonic transducers (UTs),16,17which have a size
and sensitivity well suited for micromoulding process diagnosis, have been integrated onto the barrel and mould insert of a micromoulding machine for real-time, non-destructive and non-intrusive process monitoring.15 In the present study, probing of process failures for micromoulding, such as polymer degradation and filling incompleteness of the mould cavity, will be demon-strated using the developed integrated ultrasonic sensors with an ultrasonic pulse-echo technique.
Experimental set-up
Piezoelectric film UTs were fabricated onto a barrel and mould insert of a micromoulding machine18,19 (Microsystem50, Battenfeld, Austria), as integrated sensors, by a sol–gel spray technique. Detailed fabrica-tion procedures of the UTs on this micromoulding machine are presented in Ref. 15. These integrated UTs can operate at temperatures up to 400uC, which is sufficiently high to process the full range of polymeric materials typically employed in micromoulding. The ultrasonic data acquisition system consisted of pulser– receivers, a 12-bit dual-channel digitising board with a sampling rate of 50 MHz for each channel, and a personal computer with data acquisition and analysis programs using LabVIEW. The ultrasonic signals were acquired every 1 ms at the mould insert and every 50 ms at the barrel during the entire moulding cycle for 8 s with the ultrasonic pulse-echo technique.
At barrel
Seven integrated UTs were fabricated on the external surface of the barrel along its length direction from feeding zone to the exit.15 The centre frequency and
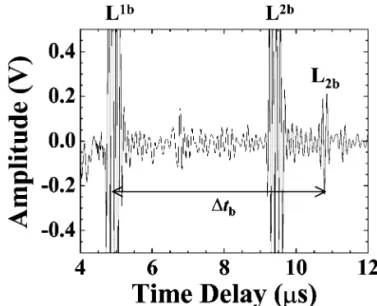
6 dB bandwidth of the UTs were 9 and 4 MHz, respectively, measured at a barrel temperature of 240uC. Figure 1 presents a schematic view of a cross-section of the barrel with the UT and the extrusion screw, explaining the paths of ultrasound propagating in the barrel and polymer melt. The width of the screw root
was 5 mm, which is comparable to the UT size of 5 mm in diameter. When electric pulses were applied on the UT, ultrasonic waves were generated and transmitted into the barrel. In Fig. 1, L1band L2b are the first and second round-trip ultrasonic longitudinal-wave echoes, respectively, reflected at the barrel/polymer melt inter-face, and L2bis the first round-trip echo propagating in
the polymer melt and reflected from the polymer/screw root interface.
Figure 2 shows a typical waveform acquired when the screw root was beneath the UT location. The echoes L1b, L2band L2b, presented in Fig. 1, were clearly observed.
Ultrasonic velocity in the polymer melt is strongly related to its material properties (viscosity, density, composition, etc.) and process parameters (temperature and pressure).20 Thus, the velocity could be useful information to diagnose the polymer state during extrusion. The ultrasonic velocity, Vb, in the polymer
melt at the barrel can be determined by Vb52hb/Dtb,
where hb(53.275 mm) is the gap distance between the
internal surface of the barrel and the screw root at the UT location, as shown in Fig. 1, and Dtb is the time
delay difference between the L1b and L
2b echoes in
Fig. 2.
At mould insert
Two integrated UTs were fabricated on the mould insert as shown in Fig. 3.15The diameter and thickness of the
mould insert were 75 and 7.5 mm, respectively. The UTs were located above both edges of the cavity for the moulded parts whose dimensions were 20 mm in length, 2 mm in width and 0.5 mm in depth. The size of the UTs was 4 mm in diameter, and the centre frequency and 6 dB bandwidth were 9 and 7 MHz, respectively. In Fig. 3, L1m and L2m represent the first and second round-trip longitudinal-wave echoes, respectively, pro-pagating in the mould insert and reflected at the mould insert/polymer interface. L2m, L4mand L6mare the first,
second and third echoes, respectively, propagating in the polymer and reflected at the polymer/immobile mould interface, which were observed when the mould cavity is filled with the polymer.
1 Schematic view of cross-section of barrel with UT and
extrusion screw; L1b and L2b are first and second
round-trip echoes propagating in barrel, respectively, and L2b is first round-trip echoes propagating in
poly-mer and reflected from screw root
2 Typical ultrasonic echoes measured with UT at barrel
and at barrel temperature of 200uC; L2b is echo
reflected at polymer/screw root interface, as illustrated in Fig. 1
Whiteside et al. Ultrasonic diagnosis in micromoulding
Published by Maney Publishing (c) IOM Communications Ltd
A typical signal acquired with UT1 at a mould temperature of 75uC is given in Fig. 4. One can see the L1mand L2mechoes reflected at the mould cavity surface of the mould insert. The L2m, L4m and L6m echoes
propagating in the polymer inside the mould cavity were observed while the polymer was in contact with the cavity surface. The ultrasonic velocity, Vm, in the
polymer inside the cavity can be determined by Vm52hm/Dtm, where hm(50.5 mm) is the depth of the
cavity at the UT location in Fig. 3, and Dtmis the time
delay difference between L2mand L4min Fig. 4.
Results and discussion
The material employed in the experiments was a polyacetal (polyoxymethylene: POM) copolymer (grade: POM109C) from Chem Polymer, UK. A typical moulding condition employed for this polymer with micromoulding machine used in the present study was as follows: melt and mould temperatures were 200uC and 75uC, respectively; injection piston speed was 500 mm s–1; and holding and cooling times were 0.3 and 5 s, respectively. A photograph of a typical moulded part is given in Fig. 5. The weight of the part was 26.6 mg. The white dotted circles indicate the positions corre-sponding to the areas of UT1 and UT2 above the part, as illustrated in Fig. 3.
Polymer degradation
For the POM employed in the present study, the recommended barrel (melt) temperature is 180–210uC and melt temperatures higher than 230uC may lead to material degradation such as thermal decomposition according to the technical data sheet from the manu-facturer. Figure 6 presents the 60 parts moulded successively for 15 min with a melt temperature of 240uC which is higher than the recommended tempera-ture. The melt temperature was measured by a thermo-couple attached onto the barrel. One can see the gradual colour change of the parts from white to dark colour with respect to the fabrication time, indicating degra-dation of the polymer. Excessive heating and long residence time of the POM at the barrel may have resulted in thermal decomposition with liberation of formaldehyde.21 It is also noted that the tendency for part flashing increased as the polymer degraded in Fig. 6. This suggests that the thermal degradation reduced the viscosity of the melt due to scission of the polymer chains.
4 Typical ultrasonic echoes measured with UT1 at mould
insert at 75uC when mould cavity was filled with polymer
3 Schematic view of cross-section of mould insert with
UTs; mould cavity for part is a thin rectangular shape,
20 mm long, 2 mm wide and 0.5 mm thick; L1m and
L2m are first and second round-trip echoes,
respec-tively, propagating in mould insert, and L2m L4m and
L6m are first, second and third round-trip echoes,
respectively, propagating in polymer in cavity
5 Photograph of moulded part; part thickness, 0.5 mm; white dashed circles indicate locations of UTs above cavity, as illustrated in Fig. 3
6 Image of 60 parts successively moulded at melt
(bar-rel) temperature of 240uC with respect to fabrication time; darker colour indicates degradation of polymer; black spot appearing at lower area of each part is part number
Published by Maney Publishing (c) IOM Communications Ltd
In order to assess the feasibility of monitoring such polymer degradation using ultrasound, ultrasonic velo-cities in the polymer were measured during extrusion and moulding of the parts in Fig. 6. Figure 7 presents the results at the barrel (filled circles) and at the mould insert (open circles). The velocities were measured when the polymer was in a molten state at the barrel and in a solid state at the mould insert. At the barrel, the velocities slightly increased with respect to time but they were almost a constant value of 1111¡18 m s–1. The velocity variation was ¡1.6% for all the parts. At the mould insert, the velocities were almost a constant value of 1450¡13 m s–1 from 0 to 6 min. However, they started to increase after 6 min, and reached 1575 m s–1 at 14 min. The maximum variation of the velocity obtained at the mould insert was 138 m s–1(9.5%). This
shows that polymer degradation can be probed sensi-tively at the mould insert by measuring the variation of the ultrasonic velocity of the parts.
It was found that the part thickness also gradually increased with increasing material degradation, up to 5% (25 mm) more than those of the non-degraded parts. This suggests that the cavity pressures were higher during production of these products than the non-degraded ones, resulting in higher ultrasonic velocities. The cause of this has not been verified but it is thought that formaldehyde produced during the decomposition of the degraded material could expand as the product cools, causing a sustained cavity pressure.
Filling incompleteness
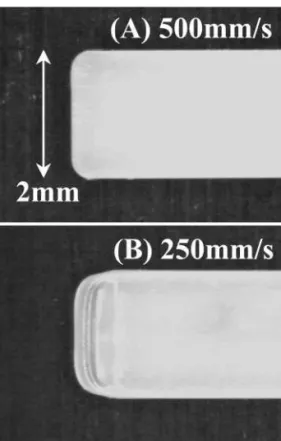
Complete filling of the mould cavity with the polymer is one of the most critical requirements for the moulding process since an incomplete part may not perform as expected and must be rejected. Fractionally short shots and imperfect micro- and nanosurface feature develop-ment of micromoulded parts may be extremely difficult to detect following moulding, compared to the larger scale parts moulded on a conventional injection moulding machine which are typically verified using the naked eye. Figure 8 shows images of the edge of two moulded parts A and B, corresponding to the UT2 area in Figs. 3 and 5, at the end of the mould cavity with injection piston speeds of 500 and 250 mm s–1, respectively. One can see the corners of the edge of part B were rounder than those of part A. In addition, steps are observed on the edge of B where the thickness decreased towards the
edge. The length and weight of B were 0.31 mm (1.6%) and 1.0 mg (3.8%) less than those of A, respectively. This means that the cavity was not completely filled with polymer as a result of lack of sufficient injection pressure for part B when the injection piston speed was 250 mm s–1, resulting in short shot of the part. No discernible difference in the shape and dimensions at another side of the edge (UT1 area) of the moulded parts was observed with both injection piston speeds.
The solid and dotted lines in Fig. 9, part A represent the amplitude variations of the L1m echoes measured with UT1 and UT2 at the mould insert, respectively, during moulding of part A in Fig. 8 with injection piston speed of 500 mm s–1. The arrows indicate the process
time when the polymer melt arrived at the area beneath each UT location. At this moment, the amplitude of the L1m echo steeply decreased because part of the ultra-sonic energy is transmitted into the polymer through the cavity/polymer interface and less energy is reflected back. At a process time of 0.88 s for part A in Fig. 9, the amplitudes recovered to almost their initial values owing to total reflection at the cavity/air interface, indicating that the moulded part was detached from the mould cavity surface because of shrinkage of the part during solidification. The profiles of the two curves for part A in Fig. 9 were similar except that the time of melt arrival at UT1 was 38 ms (Dtffor part A in Fig. 9) earlier than
that at UT2 because of the distance apart of the two UT locations. The maximum amplitude variation of the L1m
echo was 53 mV (17.8%) for UT1 and 62 mV (14.6%) for UT2 during moulding of part A.
For part B in Fig. 8, the amplitude variation of the L1m echo measured with UT1 was 50 mV (16.8%), presented by the solid line for part B in Fig. 9, and its profile was similar to those for part A in Fig. 9. However, the amplitude variation measured with UT2,
7 Variation of ultrasonic velocities of polymer measured at mould insert (open circles) and barrel (filled circles)
8 Images of edges of moulded parts A and B at UT2
end; injection piston speed was 500 mm s–1 for part A and 250 mm s–1for part B
Whiteside et al. Ultrasonic diagnosis in micromoulding
Published by Maney Publishing (c) IOM Communications Ltd
presented by the dotted line for part B in Fig. 9, was only 11 mV (2.6%) which was 5.6 times smaller than that for part A measured with UT2 (dotted line for part A in Fig. 9). This means that less ultrasonic energy was transmitted through the mould cavity/polymer interface for part B than for part A at UT2 owing to the filling incompleteness at the end of the cavity because of the lack of sufficient injection pressure (injection piston speed). Thus, the slight filling incompleteness (3.8% in weight) at the end area of the cavity was sensitively detected with UT2.
Melt flow speed
The melt arrival times for part B at each UT location was later than for part A as seen in Fig. 9 since the injection piston speed for part B (250 mm s–1) was lower than that for part A (500 mm s–1). This indicates that the melt flow speed in the cavity during moulding of part B was slower than for part A. A large injection speed is required to avoid filling incompleteness of the cavity since the solidification time is typically two orders of magnitude less than that found in conventional injection moulding due to the small amount of material and high surface area/volume ratio of the micromoulding products. Thus, fast melt flow speed in the cavity is crucial to prevent premature freezing of material in the moulding feeding channels or cavity during injection and can also favourably affect the viscosity of the pseudoplastic polymers. However, if the injection speed is too large, the resulting cavity pressure may overcome the mould clamping force and the polymer will escape along the split pane of the mould, resulting in a flashed product. Monitoring of melt flow speed in the cavity can assist with control and optimisation of the injection piston speed to control the flow front velocity and ensure production of high quality micromoulding products.
Average melt flow speed, Vf, in the cavity between the
areas beneath UT1 and UT2 can be calculated by Vf5D/ Dtf, where D (516 mm) is the distance between UT1 and
UT2 in Fig. 3 and Dtfis the time difference between the
melt arrivals at UT1 and UT2, indicated by the arrows in Fig. 9. The flow speeds obtained with different injection piston speeds of 250 and 500 mm s–1 were 0.27 and 0.42 m s–1, respectively, from the data in Fig. 9. It is verified that the melt flow speed with an injection piston speed of 250 mm s–1for part B in Fig. 8
was 36% slower than that with 500 mm s–1for part A and was not sufficiently fast to fill the mould cavity completely at the set mould tempereture.
Conclusion
Real-time monitoring of process failures for micro-moulding has been performed intrusively and non-destructively using novel ultrasonic sensors directly integrated onto the barrel and mould insert of a micromoulding machine with an ultrasonic pulse-echo technique. Polymer degradation was probed by measur-ing the ultrasonic velocity through the polymer at the barrel and mould insert. An apparent velocity increase (9.5%) was observed for the degraded parts at the mould insert. Filling incompleteness (3.8% in weight) of the mould cavity was also sensitively detected by monitoring the ultrasonic energy variation transmitted into the part at different points along the melt flow length. Average melt flow velocities in the cavity were obtained at different injection piston speeds. The small form factor and high sensitivity of the novel ultrasonic sensors and technique enable non-intrusive measurement, allowing optimisation of the micromoulding process and ensuring that process failure is detected for every product in a manufacturing run.
Acknowledgements
The authors thank M. Kobayashi for fabrication of the UTs used in the present study. Financial support from the Joint Science and Technology Fund of the National Research Council of Canada and the British Council for Researcher Exchange Awards is acknowledged. Based on a presentation at the Polymer Process Engineering conference held in Bradford, UK in July 2005.
References
1. T. Benzler, V. Piotter, T. Hanemann, K. Mueller, P. Norajitra, R. Ruprecht and J. Hausselt: Proc. SPIE, 1999, 3874, 53–60. 2. A. M. Tom and J. P. Coulter: Proc. ASME International
Mechanical Engineering Congress & Exposition, New Orleans, LA, November 2002, American Society of Mechanical Engineers, 1–9.
3. C. H. Ahn, J.-W. Choi, G. Beaucage, J. H. Nevein, J.-B. Lee, A. Puntambekar and J. Y. Lee: Proc. IEEE, 2004, 92, 154–173. 4. L. Piche´, A. Hamel, R. Gendron, M. Dumoulin and J. Tatiboue¨t:
US Patent 5,433,112, 1995.
5. H. Wang, B. Cao, C. K. Jen, K. T. Nguyen and M. Viens: Polym. Eng. Sci., 1997, 37, 363–376.
6. S.-S. L. Wen, C.-K. Jen and K. T. Nguyen: Int. Polym. Process., 1999, XIV, 175–182.
7. E. C. Brown, T. L. D. Collins, A. J. Dawson, P. Olley and P. D. Coates: J. Reinf. Plast. Compos., 1999, 18, 331–338.
8. D. R. Franc¸a, C.-K. Jen, K. T. Nguyen and R. Gendron: Polym. Eng. Sci., 2000, 40, 82–94.
9. C. Kiehl, L.-L. Chu, K. Letz and K. Min: Polym. Eng. Sci., 2001, 41, 1078–1086.
10. R. Edwards and C. Thomas: Polym. Eng. Sci., 2001, 41, 1644–1653.
9 Amplitude variations of L1m echoes measured during
moulding of parts A and B in Fig. 8 with UT1 (solid line) and UT2 (dotted line) at mould insert
Published by Maney Publishing (c) IOM Communications Ltd
11. Y. Ono, M. Kobayashi, C.-K. Jen, C.-C. Cheng, A. Derdouri and Y. Simard: Proc. SPE ANTEC, 2004, 556–560.
12. E. C. Brown, L. Mulvaney-Johnson and P. D. Coates: Proc. SPE ANTEC, 2004, 1310–1314.
13. W. Michaeli and C. Starke: Polym. Test., 2005, 24, 205–209. 14. Y. Ono, C.-C. Cheng, M. Kobayashi and C.-K. Jen: Polym. Eng.
Sci., 2005, 45, 606–612.
15. Y. Ono, B. R. Whiteside, E. C. Brown, M. Kobayashi, C.-C. Cheng, C.-K. Jen and P. D. Coates: submitted to Trans. Inst. Measure. Control.
16. M. Kobayashi, T. R. Olding, M. Sayer and C.-K. Jen: Ultrasonics, 2002, 39, 675–680.
17. M. Kobayashi and C.-K. Jen: Smart Mater. Struct., 2004, 13, 951– 956.
18. B. R. Whiteside, M. T. Martyn, P. D. Coates, P. S. Allan, P. R. Hornsby and G. Greenway: Plast. Rubber Compos., 2003, 32, 231– 239.
19. B. R. Whiteside, M. T. Martyn, P. D. Coates, G. Greenway, P. Allan and P. Hornsby: Plast. Rubber Compos., 2004, 33, 11– 17.
20. L. Piche, F. Massines, A. Hamel and C. Neron: U.S. Patent 4,754,645, 1988.
21. F. M. Berardinelli, T. J. Dolce and C. Walling: J. Appl. Polym. Sci., 1965, 9, 1419–1429.
Whiteside et al. Ultrasonic diagnosis in micromoulding