Publisher’s version / Version de l'éditeur:
Vous avez des questions? Nous pouvons vous aider. Pour communiquer directement avec un auteur, consultez la première page de la revue dans laquelle son article a été publié afin de trouver ses coordonnées. Si vous n’arrivez pas à les repérer, communiquez avec nous à PublicationsArchive-ArchivesPublications@nrc-cnrc.gc.ca.
Questions? Contact the NRC Publications Archive team at
PublicationsArchive-ArchivesPublications@nrc-cnrc.gc.ca. If you wish to email the authors directly, please see the first page of the publication for their contact information.
https://publications-cnrc.canada.ca/fra/droits
L’accès à ce site Web et l’utilisation de son contenu sont assujettis aux conditions présentées dans le site LISEZ CES CONDITIONS ATTENTIVEMENT AVANT D’UTILISER CE SITE WEB.
Journal of Applied Physics, 128, 19, 2020-11-18
READ THESE TERMS AND CONDITIONS CAREFULLY BEFORE USING THIS WEBSITE.
https://nrc-publications.canada.ca/eng/copyright
NRC Publications Archive Record / Notice des Archives des publications du CNRC :
https://nrc-publications.canada.ca/eng/view/object/?id=19852b44-a251-4d87-a02a-855410cfab75 https://publications-cnrc.canada.ca/fra/voir/objet/?id=19852b44-a251-4d87-a02a-855410cfab75
NRC Publications Archive
Archives des publications du CNRC
This publication could be one of several versions: author’s original, accepted manuscript or the publisher’s version. / La version de cette publication peut être l’une des suivantes : la version prépublication de l’auteur, la version acceptée du manuscrit ou la version de l’éditeur.
For the publisher’s version, please access the DOI link below./ Pour consulter la version de l’éditeur, utilisez le lien DOI ci-dessous.
https://doi.org/10.1063/5.0029235
Access and use of this website and the material on it are subject to the Terms and Conditions set forth at
Photothermal characterization of biodiesel and petroleum diesel fuels: a review and perspective
Shen, Jun; Michaelian, Kirk H.; Gieleciak, Rafal; Baesso, Mauro L.; Astrath, Nelson G. C.; Malacarne, Luis C.
1 Photothermal characterization of biodiesel and petroleum diesel fuels ─ A review and perspective
Jun Shen1*, Kirk H. Michaelian2, Rafal Gieleciak2, Mauro L. Baesso3, Nelson G. C. Astrath3, Luis
C. Malacarne3
1National Research Council Canada, Energy, Mining and Environment Research Centre, 4250
Wesbrook Mall, Vancouver, British Columbia V6T 1W5, Canada
2Natural Resources Canada, CanmetENERGY in Devon, One Oil Drive Patch, Devon, Alberta
T9G 1A8, Canada
3Departamento de Física, Universidade Estadual de Maringá, Maringá, PR 87020-900, Brazil
* Author to whom correspondence should be addressed: jun.shen@nrc-cnrc.gc.ca
ABSTRACT
Alternative fuels hold considerable promise as substitutes for petroleum diesel fuel. As such, biodiesel is a promising renewable fuel that has been developed and tested by a number of research groups. Quality control of this transportation fuel is of great significance to its commercialization. Conventional chromatographic and spectroscopic analytical methods are most commonly used for biodiesel characterization, in some cases yielding information detail beyond that needed for determination of biodiesel quality. By contrast less common methods, photothermal techniques, are well suited to characterize a wide range of transportation fuels. The complexities of photothermal and chemical analytical techniques are roughly similar, as are the costs. Photothermal methods are based on spectroscopic and thermophysical properties of the sample, an advantage with respect to ordinary chromatography and spectroscopy techniques. Furthermore, some photothermal techniques can be adapted for remote signal detection, which can be used for
This is the author’s peer reviewed, accepted manuscript. However, the online version of record will be different from this version once it has been copyedited and typeset.
2
in-situ analysis in fuel production for inline biodiesel quality inspection and control. Therefore, an overview and outlook of the photothermal characterization is of considerable interest. In this paper, the applications of photothermal techniques in characterization of biodiesel, petroleum diesel fuels, and their blends are reviewed. The review includes thermophysical properties and correlations for fuels, determination of blend levels, and biodiesel stability investigations. After the review, discussion and perspective are presented for future improvement of photothermal characterization and industrial applications.
This is the author’s peer reviewed, accepted manuscript. However, the online version of record will be different from this version once it has been copyedited and typeset.
3
I. INTRODUCTION
Biodiesel is technically defined, by the US National Biodiesel Board, as “a fuel comprised of mono-alkyl esters of long chain fatty acids derived from vegetable oils or animal fats, designated B100, and meeting the requirements of ASTM D 6751”.1 In fact, biodiesel fuel produced in a transesterification process contains, in addition to fatty acid methyl esters (FAME), the by-product glycerol, free fatty acids, alcohols, catalysts, and other contaminants.2 The contaminants can lead to serious operational problems, such as engine deposits, filter clogging, or fuel deterioration when using biodiesel or its blends with petroleum diesel.3
Biodiesel is a promising alternative fuel to replace petroleum diesel fuel (‘diesel’ is used in place of ‘petroleum diesel’ for the remainder of this paper). Biodiesel and its blends can be utilized in current compression ignition (CI) engines without modification since the physicochemical properties of biodiesel are close to that of diesel.4 Compared with diesel, biodiesel has several advantages.5 It is renewable and biodegradable, has better lubricity, and is safer in terms of
handling and storage, because of its higher flash point. Biodiesel, as a fuel for CI engines, also has its disadvantages, such as unfavorable lower cold-flow properties, increased NOx emissions, and
stability issues.4 Consequently, many countries have established their own standards for quality control of biodiesel and its blends.6
In these standards, two categories of parameters to define the quality of fuels should be characterized.4,7 One is the general properties of both diesel and biodiesel fuels, for example, ignition quality, volatility, viscosity, and density. The other quantifies the composition and purity of biodiesel, such as content of esters, methanol, glycerol, and water. Additionally, the improper handling and storage of biodiesel have the potential to affect composition and thus its quality.
This is the author’s peer reviewed, accepted manuscript. However, the online version of record will be different from this version once it has been copyedited and typeset.
4
The general properties are measured according to standards, such as that listed in American Society for Testing and Materials (ASTM) method ASTM D6751-07a. The measurements can be very time- and cost-intensive, requiring multiple equipment items and a large amount of fuel.8 The
compositions conventionally can be determined with chromatographic and spectroscopic analytical methods, for example, gas and liquid chromatography, nuclear magnetic resonance (NMR) spectroscopy, infrared (IR) spectroscopy, Raman spectroscopy, and combinations of these methods, as presented in comprehensive review papers.2,4,8
However, most of the review papers (e.g., References 5, 9, 10) did not mention less common methods, such as photothermal techniques, which have been successfully applied to characterization of biodiesel and diesel fuels. An exception is Vozka et al.8 who once cited the use
of thermal lens and optical interferometer techniques to measure thermal diffusivity and thermo-optical coefficient, respectively. Thermophysical properties, like the chemical analytical data, are governed by fuel composition (as shown in section III in this paper), and consequently it is possible to obtain information on fuel quality by determining fuel thermophysical properties such as thermal diffusivity, using photothermal techniques.11 Compared with the conventional analytical methods, such as chromatography and NMR spectroscopy, photothermal techniques are less complex, non-destructive, non-invasive and, in some cases, less expensive. In addition, photothermal techniques possess intrinsically high sensitivity in spectroscopy enabling the study of samples with very low optical absorption (<10-8 cm-1 in liquids). Using the near-infrared (NIR) thermal lens technique, the optical absorbances for the third overtone (4ν) of the C-H stretching vibration centered at 916 nm (10,917 cm−1) of diesel/biodiesel blends could be well measured for the determination of blend level. Such low absorbances would be difficult to measure accurately using NIR spectroscopy.12 Photothermal techniques, however, are not able to provide all
This is the author’s peer reviewed, accepted manuscript. However, the online version of record will be different from this version once it has been copyedited and typeset.
5
information required for quality control of biodiesel and its blends; a combination of photothermal techniques and other analytical methods, such as gas chromatography - mass spectrometry (GC-MS) or NMR spectroscopy, is sometimes desirable. Some photothermal techniques, e.g., thermal lens and photothermal deflection techniques, require no physical contact between the sample and detector and can be adapted for remote signal detection, which is suitable for in-situ measurement during the fuel production for inline biodiesel quality inspection and control. Therefore, photothermal techniques are promising for characterization of biodiesel, diesel, and their blends. This paper reviews the applications of photothermal techniques to characterize biodiesel and diesel fuels, including fuel thermophysical properties and correlations with other fuel properties (e.g., the foregoing general properties of both diesel and biodiesel fuels), determination of blend level (namely, the percentage of biodiesel in the blend), and biodiesel stability investigation. Based on these applications, discussion and perspective are presented for further improvement and industrial applications. For the convenience of readers who are not familiar with photothermal techniques, two methods (i.e., thermal lens spectroscopy and photopyroelectric techniques) frequently utilized to characterize biodiesel and diesel fuels are briefly described here.
II. BRIEF INTRODUCTION OF PHOTOTHERMAL TECHNIQUES
Photothermal techniques are measurement schemes that monitor the thermal effects of incident radiation on a substance. While processes such as photochemical transformation and reemission of radiation may compete for a share of the excitation energy, a portion of the incident energy will be absorbed and converted into heat in the illuminated substance by a nonradiative deexcitation process. The heating can cause various effects which make possible the detection mechanisms,
This is the author’s peer reviewed, accepted manuscript. However, the online version of record will be different from this version once it has been copyedited and typeset.
6
including temperature rise, surface deformation, infrared radiation, and refractive-index gradients, enabling measurement of the optical and thermophysical properties of a sample.13
A. Thermal lens spectroscopy
The term “thermal lens” comes from the fact that a lens-like optical element is created after a laser impinges on a semi-transparent sample. In the thermal lens measurement, a liquid or solid sample, placed in a TEM00 Gaussian profile laser beam (the excitation or pump beam), is heated
by the absorbed laser energy, and a temporal and radial temperature gradient is established. Since the refractive index of the sample changes with temperature, a refractive-index gradient is thermally created, i.e., a lens-like optical element forms — the so-called thermal lens (TL). When a TEM00 Gaussian laser beam (the probe beam) passes through the TL, an optical path length
change to the probe beam is introduced, which can be expressed as an additional phase shift on the probe beam wave front. Either a cw laser or a pulsed laser can be employed for the excitation beam to create a TL. A cw laser induced TL, where the probe beam is collinear to the excitation beam, is commonly used. In this circumstance, the spot size and the intensity distribution of the probe beam vary because of the phase shift. The information on the optical and thermophysical properties of the sample can then be obtained by measuring these variations.
The experiment arrangement and theory of thermal lens spectroscopy (TLS) have both evolved considerably since it was first developed. Early TL experimental devices used one laser beam to excite and probe the TL. Later, dual-beam experimental arrangements emerged, which used separate laser beams for exciting and probing the TL. There are two kinds of dual-beam thermal lens configuration: mode-matched, in which the spot sizes of the excitation and probe beams in the sample are the same; and mode-mismatched, where the spot sizes in the sample are different.
This is the author’s peer reviewed, accepted manuscript. However, the online version of record will be different from this version once it has been copyedited and typeset.
7
The mode-mismatched configuration was found to be more sensitive than the mode-matched arrangement.14
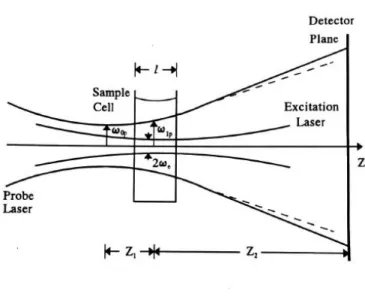
FIG. 1. Scheme of the geometric positions of laser beams in a mode-mismatched dual-beam TL
experimental arrangement.
In a mode-mismatched dual-beam thermal lens experiment, shown in Figure 1, the waist position of the probe beam of wavelength 𝜆𝑝 is taken as the origin along the axis of probe beam propagation.
A liquid sample cell of length l is located at Z1, and the detector plane is positioned at Z1+Z2. The
waist radius of the probe beam is 𝜔0𝑝, and the radii of the probe and excitation beams in the sample are 𝜔1𝑝 and 𝜔𝑒, respectively. The probe beam radiates continuously, and the illumination of the excitation beam is controlled by a shutter. After the shutter is opened at time 𝑡 = 0, the additional phase shift 𝛷(𝑟, 𝑡) on the probe beam is14
𝛷(𝑟, 𝑡) =2𝜋
𝜆𝑝∫ [𝑛(𝑟, 𝑧, 𝑡) − 𝑛(0, 𝑧, 𝑡)] 𝑙
0 𝑑𝑧. (1)
This is the author’s peer reviewed, accepted manuscript. However, the online version of record will be different from this version once it has been copyedited and typeset.
8
Here 𝑛(𝑟, 𝑧, 𝑡) is the refractive index of the sample at 𝜆𝑝. In the case of weakly absorbing samples
at the excitation wavelength, the power attenuation of the excitation beam along the z-direction can be neglected. The phase shift is given as14
𝛷(𝑟, 𝑡) =2𝜋
𝜆𝑝
𝑑𝑛
𝑑𝑇[𝑇(𝑟, 𝑡) − 𝑇(0, 𝑡)]. (2)
𝑑𝑛
𝑑𝑇 is the thermo-optic coefficient (specifically, the temperature coefficient of the refractive index) at 𝑝. 𝑇(𝑟, 𝑡) is the temperature rise induced by the axially symmetric excitation beam, described by the temperature diffusion equation.15 The time-resolved probe beam intensity (transient) 𝐼
𝑝(𝑡) at its beam centre at the detector plane can be expressed as14
𝐼𝑝(𝑡) = |∫ 𝐸𝑥𝑝[(1 + 𝑖𝑉)𝑔 − 𝑖𝛷(𝑔, 𝑡)]𝑑𝑔0∞ |2, (3)
in which 𝑔 = ( 𝑟
𝜔1𝑝), and 𝑉is a geometrical parameter from the experimental setup defined as
𝑉 =𝑍1 𝑍𝑐+ 𝑍𝑐 𝑍2[1 + ( 𝑍1 𝑍𝑐) 2 ]. (4)
𝑍𝑐 = 𝜋𝜔0𝑝2 /𝑝 is the confocal distance of the probe beam. In the circumstance 𝛷≪ 1 and the approximation 𝑒𝑥𝑝(−𝑖𝛷) ≈ 1 −𝛷 is valid, the intensity 𝐼𝑝(𝑡) can be written in a simple analytical form14 𝐼𝑝(𝑡) = 𝐼𝑝(0) (1 − 𝜃 2𝑡𝑎𝑛 −1{ 2𝑚𝑉 [(1+2𝑚)2+𝑣2][𝑡𝑐/(2𝑡)]+1+2𝑚+𝑣2}) 2 . (5) Where 𝜃 = −𝑃𝑒𝐴𝑙 𝑘𝑝 𝑑𝑛 𝑑𝑇, (6) 𝑡𝑐 = 𝜔𝑒2/(4𝐷), (7)
This is the author’s peer reviewed, accepted manuscript. However, the online version of record will be different from this version once it has been copyedited and typeset.
9
𝑚 = (𝜔1𝑝/𝜔𝑒) 2
. (8)
A, 𝑘 , and D denote optical absorption coefficient at the excitation beam wavelength, thermal conductivity, and thermal diffusivity of the sample, respectively. 𝑃𝑒 is the total power of the excitation beam. 𝑡𝑐, defined by Eq. (7), is the characteristic thermal time constant. With geometric parameters, e.g., Z1, Z2, 𝜔𝑒, and 𝜔0𝑝, which can be experimentally measured,14 𝜃 and 𝑡𝑐 can be
deduced with regression analysis, such as least-squares curve fitting of the time-resolved curve (transit) of the probe beam intensity 𝐼𝑝(𝑡) at its beam centre to Eq. (5). Optical and thermophysical properties, such as A, D, or 𝑑𝑛
𝑑𝑇 can then be determined. 𝑑𝑛
𝑑𝑇 is usually negative for hydrocarbon mixtures. Wen et al.16,17 showed that the 𝑑𝑛
𝑑𝑇 represents the competition between polarizability and thermal expansion of a material, conveying information about molecular size. For hydrocarbons, except those materials containing heteroatoms such as oxygen (e.g., alcohols and ketones), to a first approximation, −𝑑𝑛
𝑑𝑇 decreases as the molecular size or weight becomes larger.
The foregoing TL model does not take possible photochemical reactions into account. During the irradiation of a photo-sensitive sample, a photo-induced chemical reaction may take place. When this occurs, the concentration of the photo-absorbing species is reduced in the region irradiated by the excitation beam, generating a concentration gradient from outside to inside the region. Consequently, mass diffusion occurs, compensating for part of the consumed photo-absorbing species. The concentration gradient produces a temporal and radial refractive-index gradient (i.e., a concentration lens), superimposed to the above-mentioned thermally induced refractive-index gradient (the thermal lens), causing an optical path length change and an additional phase shift to the probe beam15,18,19
This is the author’s peer reviewed, accepted manuscript. However, the online version of record will be different from this version once it has been copyedited and typeset.
10 𝛷(𝑟, 𝑡) =2𝜋 𝜆𝑝{ 𝑑𝑛 𝑑𝑇[𝑇(𝑟, 𝑡) − 𝑇(0, 𝑡)] + 𝑑𝑛 𝑑𝐶[𝐶(𝑟, 𝑡) − 𝐶(0, 𝑡)]}. (9) 𝑑𝑛
𝑑𝐶 is the concentration coefficient of the refractive index at 𝑝. In this case, besides A, D, 𝑑𝑛 𝑑𝑇, mass diffusivity 𝐷𝑚 and photoreaction cross section 𝜎 can be measured after performing excitation-laser on- and off-analysis with the model developed by Malacarne et al.15,20 𝐷𝑚 is related to viscosity as shown by the Stokes-Einstein diffusion law, and 𝜎 characterizes the ability of a species to absorb light of a specific wavelength and undergo photoreaction.15 These two parameters were utilized to verify the stability and quality of biodiesel.20
In the case where there is only a thermally induced lens and the proposed approximation is valid, the regression analysis is simple. In other cases, semi-analytical or numerical procedures must be performed for the curve fitting. When an NIR laser is used for excitation, the radiation is outside the absorption bands of diesel or biodiesel, and a photochemical reaction will not occur. The result is a pure thermal lens and any interference from photochemical reactions in the measurements of A,
D, and 𝑑𝑛
𝑑𝑇 is thus avoided.
20,21
B. Photopyroelectric techniques
In a photopyroelectric (PPE) measurement, intensity-modulated optical radiation impinges on a pyroelectric element or another material in contact with such an element, producing a temperature rise. This temperature rise introduces a variation in the dielectric polarization charge and consequently a potential difference 𝑉(𝑡) across the pyroelectric element22
𝑉(𝑡) ≈ 𝑝𝑧
𝑒𝜀0∫ ∆𝑇(𝑧, 𝑡) 𝐿
0 𝑑𝑧 (10)
This is the author’s peer reviewed, accepted manuscript. However, the online version of record will be different from this version once it has been copyedited and typeset.
11
with 𝜀0 and 𝑒 being the dielectric constant and electric susceptibility of the pyroelectric element, respectively. ∆𝑇(𝑧, 𝑡) is the temperature rise in the pyroelectric element caused by the absorption of the periodic optical radiation. L denotes the thickness of the element.
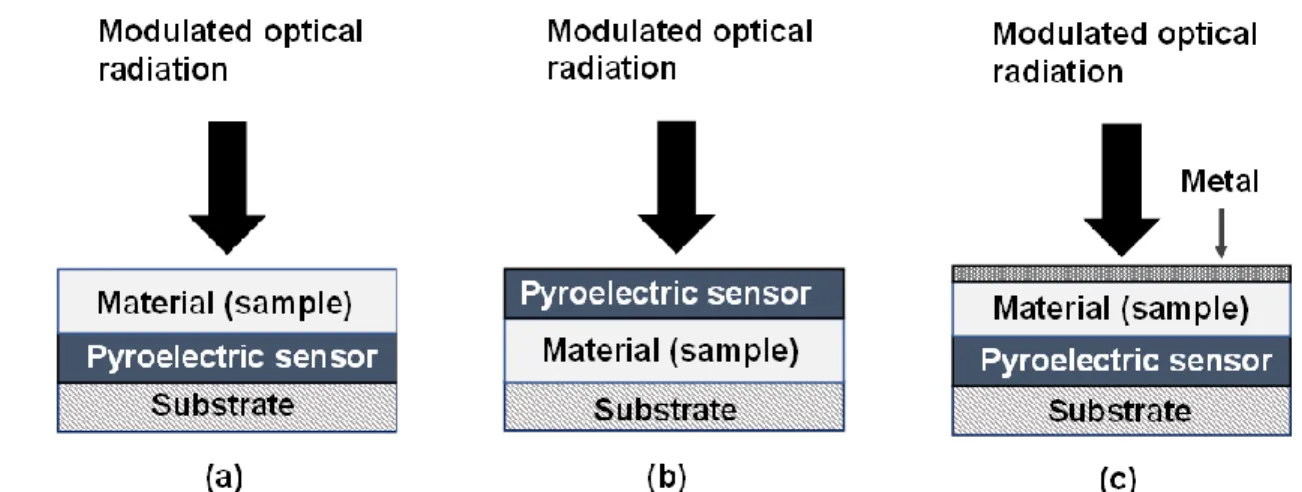
FIG. 2. A schematic diagram of PPE setups: (a) back (BPPE) detection configuration, (b) front
(FPPE) detection configuration, (c) thermal-wave resonant cavity (TWRC).
Photopyroelectric techniques can be categorized according to their implementation of either back/standard (BPPE) or front/inverse (FPPE) detection configurations,23 as shown in Figure 2. In the back-detection configuration, the periodic optical radiation illuminates the surface of a material, which may be layered, and a pyroelectric sensor in good thermal contact with the opposite side of the material produces a potential difference 𝑉(𝑡). By contrast in the front-detection configuration, the optical radiation impinges on the front surface of a pyroelectric sensor with the material in thermal contact with its rear surface, creating a potential difference 𝑉(𝑡) generated across the sensor. Due to the fact that the thermal conduction and consequently the temperature rise ∆𝑇(𝑧, 𝑡) in the pyroelectric sensor depend on the thermophysical properties of both the material and pyroelectric sensor, the thermophysical properties can be evaluated from the potential difference 𝑉(𝑡) described in Eq. (10).22 By scanning intensity-modulation frequency or varying the layered-material thickness,
This is the author’s peer reviewed, accepted manuscript. However, the online version of record will be different from this version once it has been copyedited and typeset.
12
thermal diffusivity D and thermal effusivity e can be measured.23 As a type of BPPE configuration, thermal-wave resonant cavity (TWRC),24,25 or thermal-wave interferometry, consists of a piece of thin metal (e.g., aluminium foil), a sample under investigation, a pyroelectric sensor and substrate, as shown in Figure 2 (c). The thin metal and the sample can be considered as a two-layer material, replacing the single-layer material (sample) in Figure 2 (a). The TWRC measures D of a gas or liquid sample by scanning the sample thickness. A high precision D value with standard deviation less than 0.07% for a distilled water sample was reported in the literature.25 Importantly, no photochemical reaction occurs when measuring D of diesel or biodiesel with a TWRC, because the radiation does not interact with the sample directly.
D is the ratio of thermal conductivity 𝑘 to volumetric heat capacity 𝜌𝑐𝑝, 𝐷 = 𝑘
𝜌𝑐𝑝, (11)
quantifying the conduction of thermal energy relative to its storage. 𝜌 and 𝑐𝑝 denote density and specific heat, respectively. Thermal effusivity e, the thermal inertia of a material, is defined as
𝑒 = √𝑘𝜌𝑐𝑝. (12)
Combining equations (11) and (12), 𝑘 can then be derived from the values of 𝐷 and 𝑒:
𝑘 = 𝑒√𝐷. (13)
One may notice that compared with chromatography and NMR methods, the TL and PPE techniques frequently used in photothermal characterization of diesel and biodiesel fuels are less complex, as shown in Figures 1 and 2. Furthermore, TL and PPE methods need only common optical laboratory equipment, without the requirement of a strong magnetic fieldand expensive cryogens as in NMR. In addition, fuel samples can be directly analyzed with no further sample preparation, keeping cost down and saving time.
This is the author’s peer reviewed, accepted manuscript. However, the online version of record will be different from this version once it has been copyedited and typeset.
13
III. PHOTOTHERMAL CHARACTERIZATION OF FUELS
A. Early work on photothermal characterization of gasoline fuel
Early photothermal characterization of liquid fuels started with gasoline fuels. A TWRC was employed to investigate evaporation kinetics of three grades of gasoline and HPLC-grade n-pentane,26 which were placed in a closed cell with an outlet. Gas chromatographic (GC) analysis data showed that n-pentane was one of the main chemical components of these gasoline samples. Once about 5 mL of gasoline was placed inside of the cell, the gasoline started to evaporate, diffusing into the air existing in the cell and then expelling the air though the outlet until a steady state was reached. Consequently, the thermal properties of the vapor-air mixture and the TWRC signal varied with time before reaching the steady state. Measurement results showed that at the steady state, the mixture of air and n-pentane vapor had a lower D value, while the mixture with a higher grade of gasoline possessed a higher D, which may be related to its lower n-pentane concentration as indicated by the GC data. These results revealed that the thermal diffusivity was dependent on the composition of the vapor-air mixture, and therefore, the various grades of gasoline could be distinguished by their steady state D values with the TWRC.
Furthermore, the transient TWRC signal carries information about the mass diffusion of hydrocarbons. Assuming that hydrocarbon vapor diffusion into the air in a closed cell without any outlet was Fickian diffusion, Lima et al.27,28 developed a theoretical model, in which the saturated vapor concentrations, vapor-air mass diffusion time constants of the amplitude of the transient TWRC signal, and consequently the vapor-air mass diffusivity of three hydrocarbons (i.e., n-pentane,
n-hexane, n-heptane) were successfully measured. The experimental results revealed that the
vapor-This is the author’s peer reviewed, accepted manuscript. However, the online version of record will be different from this version once it has been copyedited and typeset.
14
air mass diffusion time and therefore the mass diffusivity values varied for different hydrocarbons. Mass diffusivities may be a characteristic property of hydrocarbons.
The thermal diffusivity at saturation and vapor-air mass diffusion time were subsequently employed to detect adulterants in gasoline fuels.29 210 commercial gasoline samples were collected in different gasoline stations in the province of Rio de Janeiro, Brazil, tested, and classified by the National Institute for Metrology, Standardization and Industrial Quality. Twelve parameters were analysed for each sample by three distinct assays: density (ASTM D 4052), distillation (ASTM D 86), and infrared spectroscopy. Among the 210 samples, 115 and 95 samples were therefore found confirmed and nonconformed with the specifications, respectively. In addition, the thermal diffusivity values at saturation and mass diffusion times of these samples were measured. The difference between the average values of D of conformed and nonconformed gasoline samples was significant, as were the average values of mass diffusion time. Consequently, the value expressed as ‘average value of conformed samples ± twice the standard deviation’ was defined as a conformity interval to gauge conformed gasoline samples. For both conformity intervals of both thermal diffusivity and mass diffusion time, an uncertainty of 5.7% was found for these 210 samples, indicating the high accuracy of this gauge method and, once again, that the D and mass diffusion time could be the key characteristics of gasoline fuels.
B. Fuel thermophysical properties and correlations
Generalizing from the results of the early photothermal characterization of gasoline fuels, it seemed likely that thermophysical properties would also be related to the quality of diesel and biodiesel fuels. Castro et al.30 carried out pioneering work on photothermal characterization of biodiesel. TL and open cell photoacoustic techniques were employed to measure the thermophysical
This is the author’s peer reviewed, accepted manuscript. However, the online version of record will be different from this version once it has been copyedited and typeset.
15
properties (i.e., D, e, k, and 𝑑𝑛
𝑑𝑇) of six biodiesel samples. An excitation laser at 454.5 nm and curve fitting short-time transients (0 to ~ 0.8 s) to Eq. (5) were employed in the TL measurements. Four samples were obtained by transesterification of soybean and castor bean oils with both ethanol and methanol. The others were prepared by transesterification of sunflower and turnip oils with ethanol. The sample extracted from soybean oil with methanol was 5.17% and 13.51% lower in D and −𝑑𝑛
𝑑𝑇, respectively, in comparison with those extracted with ethanol. For the biodiesel extracted from castor bean oil with methanol as compared with ethanol, D and −𝑑𝑛
𝑑𝑇were 0.086% and 13.51% lower, respectively. Given the fact that the molecular structures of methyl and ethyl fatty acid esters are not the same, these results suggested that D and −𝑑𝑛
𝑑𝑇 varied with molecular structure, and − 𝑑𝑛 𝑑𝑇 was more sensitive to it. In the same paper, an additional investigation was performed to study the effect of oxidation on thermal diffusivity. An oxidized biodiesel sample extracted from castor bean oil with ethanol was analysed, and D was found to be about 20% lower than a similar extract of unoxidized biodiesel. The oxidation products of the biodiesel were confirmed by gas chromatography/mass spectrometry analyses.
Lima et al.31 employed FTIR photoacoustic spectroscopy (PAS) to measure water washed and
unwashed biodiesel samples produced by mixing ethanol with soybean vegetable oil. The spectra revealed that the unwashed biodiesel had a higher percentage of glycerol than did the washed one, while the washed sample retained more ester. Lima et al.32 also used TLS to study the effects of the residues from transesterification and oxidation on D of the biodiesel extracted from transesterification of soybean oil with ethanol. In the single-beam thermal lens experiments, a 632.8 nm excitation laser and short-time duration (0 to 0.3 s) curve fitting were used. After the transesterification, two biodiesel samples were taken, respectively, before and after five final washes
This is the author’s peer reviewed, accepted manuscript. However, the online version of record will be different from this version once it has been copyedited and typeset.
16
with distilled water, identified as unwashed and washed soybean diesel. The D of the unwashed biodiesel was found to be about 17% lower than that of the washed one. Furthermore, the D of the washed biodiesel became about 42% lower after it was thermally treated for 4 h at 105 °C to accelerate its oxidation. These results reported by Lima et al.31 revealed that D is sensitive to the residues from transesterification and biodiesel oxidation, indicating that the thermal diffusivity value is correlated with the chemical composition of the sample.
With near-infrared thermal lens spectroscopy, Deus et al.21 explored the possibility to monitor ester production during the transesterification reaction of soybean oil with ethanol. Aliquots of 5 mL were collected at different reaction times (ranging from 0.5 to 20.0 min). Ester concentrations in each aliquot were determined by chromatography, and 𝐴𝑑𝑛
𝑑𝑄 was measured using the TL technique with excitation laser wavelength 970 nm. 𝐴𝑑𝑛
𝑑𝑄 represents how the refractive index changes with the heat deposited per unit volume in the sample (𝑑𝑛
𝑑𝑄) with optical absorption coefficient at the excitation laser wavelength. As shown in Figure 3, good correlation was obtained between ester concentration and 𝐴𝑑𝑛
𝑑𝑄. In the first 5 minutes of the transesterification reaction, ester concentration increases about 33%, while 𝐴𝑑𝑛
𝑑𝑄 decreases by the same amount. This behaviour might be related to the alcohol consumption when the ester was produced, reducing the absorption at 970 nm (related to 𝜈̅3of the OH vibration). Both 𝐴𝑑𝑛
𝑑𝑄 and ester concentration were curve-fitted to exponential functions with the same response time of 𝜏 = 0.91 𝑠, resulting in good agreement with the experimental data. This work established that the transesterification reaction in ester production reached completion in about 5 min and that longer reaction time was not needed. Hence, this method might be used to optimize the ester production process, reducing energy consumption during industrial biodiesel production.
This is the author’s peer reviewed, accepted manuscript. However, the online version of record will be different from this version once it has been copyedited and typeset.
17 FIG. 3. 𝐴𝑑𝑛
𝑑𝑄 and ester concentration as a function of the reaction time. Reproduced with permission from Fuel 253, 1090 (2019). Copyright 2019 Elsevier.
Thermophysical properties (i.e., D, e, and k) of biodiesel fuels and their corresponding precursor vegetable oils were measured and compared by Machado et al.33 BPPE (TWRC) and FPPE detection configurations were employed to measure the values of D and e, respectively. Comparisons were made for the biodiesel fuels produced from sunflower, soybean, cambre (crambe abyssinica), and castor oils. The paper does not specify how the biodiesel samples were produced. It was found that the values of both D and 𝑘 of these biodiesel fuels were lower than that of their corresponding vegetable oils. For instance, the D and 𝑘 of the biodiesel extracted from sunflower oil were measured as (0.80 ± 0.01) × 10-7 m2 s-1 and (0.154 ± 0.001) W m-1 K-1, respectively, smaller than (0.85 ± 0.01) × 10-7 m2 s-1 and (0.162 ± 0.002) W m-1 K-1, respectively, of sunflower oil. For the biodiesel extracted from soybean oil, (0.83 ± 0.02) × 10-7 m2 s-1 and (0.154 ± 0.002) W m-1 K-1 were found,
while (0.87 ± 0.02) × 10-7 m2 s-1 and (0.159 ± 0.002) W m-1 K-1 were determined for soybean oil.
This is the author’s peer reviewed, accepted manuscript. However, the online version of record will be different from this version once it has been copyedited and typeset.
18 FIG. 4. Trend between the thermal diffusivity and biodiesel type produced from several vegetable
oil sources. For each point, iodine value (IV) of biodiesel is reported. Reproduced with permission from Fuel 130, 105 (2014). Copyright 2014 Elsevier.
Silva et al.34 also made comparisons between biodiesel fuels and their corresponding vegetable
oils regarding D, in addition to density, kinematic viscosity, and Prandtl number. The biodiesel samples were obtained by transesterification of soybean, sunflower, canola, and crambe sp. oils through ethylic route. D was measured using a mode-mismatched dual-beam TL configuration (excitation wavelength 488 nm) and curve fitting Eq. (5) to the TL transient in the interval from 0 to about 0.9 s. Density and kinematic viscosity at 40 °C were also determined experimentally. The density values of the biodiesel samples were found smaller than those of their corresponding vegetable oils, but in the same order, while the kinematic viscosity values of the biodiesel fuels were only about 12.7% to 18.3% of that for the corresponding oils. Regarding D, this work found that biodiesel exhibits a higher value compared with that of the corresponding oil, which was different from the earlier results obtained by Machado et al.33 For example, (1.11 ± 0.01) × 10-7 m2 s-1 and (1.08 ± 0.01) × 10-7 m2 s-1 were measured with biodiesel samples extracted from sunflower and soybean oil, respectively, while (1.05 ± 0.01) × 10-7 m2 s-1 and (1.02 ± 0.01) × 10-7 m2 s-1 were found
This is the author’s peer reviewed, accepted manuscript. However, the online version of record will be different from this version once it has been copyedited and typeset.
19
with sunflower and soybean oil, respectively. These different results could be related to the extrapolation of the validity of the pure TL model, Eq. (5), and possible photoreaction effects that could appear at 488 nm excitation that were not taken into account. With the measured viscosity and thermal diffusivity, the Prandtl number, a dimensionless number defined as the ratio of momentum diffusivity (kinematic viscosity) to D, could be calculated. Thus, the Prandtl number values of biodiesel fuels were found to be 10.5% to 17.3% of those of the corresponding vegetable oils, indicating the improvement of heat diffusion in biodiesel as compared with that in vegetable oil. Silva et al.34 also described the correlation between D and iodine value (IV) for biodiesel produced
from several oil sources as shown in Figure 4. This figure revealed that biodiesel extracted from different vegetable oils had different IV values. Iodine value, or iodine number, was introduced in biodiesel quality standards for evaluating their stability to oxidation.6 IV is one of the structure indices, a measure of the average amount of unsaturation of fats and oils, expressed in terms of the number of centigrams of iodine absorbed per gram of sample (% iodine absorbed).35 Some studies
also pointed out that it might also indicate their tendency for polymerization and deposit formation.5 Therefore, Figure 4 revealed that the stability of biodiesel produced from different vegetable oils was different and that D might be employed to study biodiesel stability.
Shen et al.36 reported the correlations among thermophysical properties (D, −𝑑𝑛
𝑑𝑇), ignition quality, volatility, chemical composition, and kinematic viscosity of 17 hydrocarbon distillates derived from Canadian oil sands. The time-resolved TL technique and a short-time (i.e., much shorter than photochemical reaction time) least-squares curve-fitting algorithm were employed to measure D. 𝑑𝑛
𝑑𝑇 was measured using a Fabry-Perot interferometer
37,38. Physicochemical fuel
properties of the samples were determined using the ASTM methods. A least-squares curve-fitting algorithm was used to quantify the correlations of D and −𝑑𝑛
𝑑𝑇 with ignition quality, physicochemical
This is the author’s peer reviewed, accepted manuscript. However, the online version of record will be different from this version once it has been copyedited and typeset.
20
properties, and aromatic content. The correlation coefficient matrix is given in Table 1. −𝑑𝑛 𝑑𝑇 had a strong correlation with the ignition quality, cetane number (CN) and cetane index (CI), as well as with distillation characteristics (T10, T50, and T90). Recalling that −𝑑𝑛
𝑑𝑇 varies inversely with molecular size (or molecular weight) for most common hydrocarbon constituents of diesel fuels,16,17 lower −𝑑𝑛
𝑑𝑇 values are to be expected for hydrocarbon streams with higher distillation temperatures, which generally contain larger molecules. −𝑑𝑛
𝑑𝑇 was also strongly related to fuel kinematic viscosity, tending to decrease as viscosity increased. This high correlation may be a consequence of the fact that −𝑑𝑛
𝑑𝑇 and viscosity both depend on molecular size. It should be noted that viscosity and − 𝑑𝑛 𝑑𝑇 also depend on molecular polarity, and in all likelihood on molecular shape36; differences in the chemical compositions of the fuels could thus influence the relationships between these two physical properties. It is notable that −𝑑𝑛
𝑑𝑇 consistently exhibited higher correlations with the fuel properties than those observed for D, as shown in Table I. Raman spectra were also measured, yielding information on the chemical compositions of the distillates. Based on the Raman data, partial least squares regression (PLSR) models39 were built to investigate the influence of chemical composition on the modelled D and −𝑑𝑛
𝑑𝑇 properties. Predicted (after cross-validation) D and − 𝑑𝑛
𝑑𝑇 values agreed with experimental data, and better results were achieved for −𝑑𝑛
𝑑𝑇. Figure 5 illustrates the PLS regression coefficients vector corresponding to the −𝑑𝑛
𝑑𝑇 ‘best’ model. Important positive contributions occurred in the 200–600 cm-1 and ~750 cm-1 regions (mainly involving aliphatic
carbon–carbon linkages), as well as ~1000 cm-1 (monocyclic aromatics). Negative features in the ~1300–1450 cm-1 region corresponded to CH2 and CH3 groups, in addition to dicyclic aromatics.
This is the author’s peer reviewed, accepted manuscript. However, the online version of record will be different from this version once it has been copyedited and typeset.
21
This information provided guidance as to which molecular structure components mainly affected −𝑑𝑛
𝑑𝑇 values.
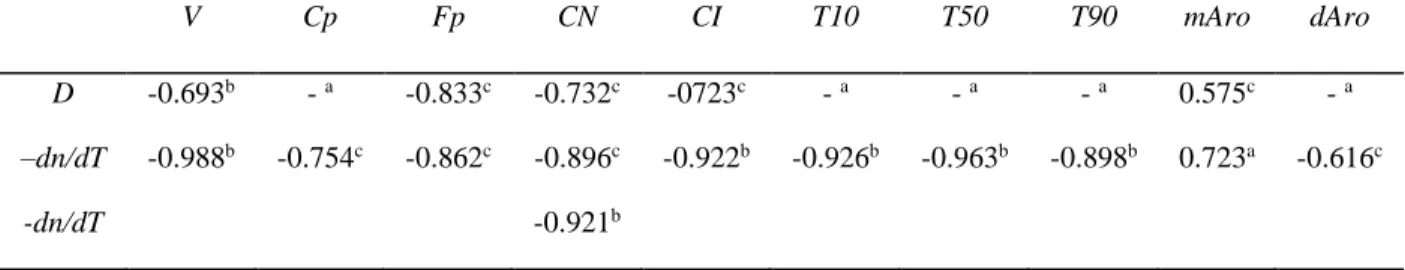
TABLE I Correlation coefficient matrix for thermophysical and physicochemical properties of 17 hydrocarbon distillates. V: kinematic viscosity at 40 °C, Cp: cloud point, Fp: flash point, CN: cetane number, CI: cetane index, Txy: distillation temperature (xy = 10, 50, 90%), mAro: monoaromatics,
dAro: diaromatics. Reproduced with permission from Fuel 163, 324 (2016). Copyright 2016
Elsevier. V Cp Fp CN CI T10 T50 T90 mAro dAro D -0.693b - a -0.833c -0.732c -0723c - a - a - a 0.575c - a –dn/dT -dn/dT -0.988b -0.754c -0.862c -0.896c -0.921b -0.922b -0.926b -0.963b -0.898b 0.723a -0.616c
a no correlation, b exponential-decay model, c linear model
FIG. 5. Regression coefficients for the PLS model for −𝑑𝑛
𝑑𝑇 based on Raman spectra, visualizing regions characteristic of functional groups that exerted positive (unfilled areas) or negative (filled areas) influences on this thermophysical property. Reproduced with permission from Fuel 163, 324 (2016). Copyright 2016 Elsevier.
This is the author’s peer reviewed, accepted manuscript. However, the online version of record will be different from this version once it has been copyedited and typeset.
22
Jiménez-Pérez et al.40,41 measured the enhancement to thermal diffusivity and effusivity after adding Au nanoparticles of mean diameter 9 nm to biodiesel. The biodiesel was purchased from Biofuels of Mexico (biodiesel C 4), and six samples with different concentrations (0.2, 0.6, 1, 1.4, 1.6, and 2 mg mL−1) of Au nanoparticles were prepared. The mode-mismatched TL technique with 514.5 nm Ar+ excitation laser and FPPE were employed to measure D and e. Compared with the pure biodiesel, the thermal diffusivity and thermal conductivity values of the biodiesel with Au nanoparticle concentrations of 0.2 to 2 mg mL-1 increased from 3.3% to 33% and 3% to 28%,
respectively. Jiménez-Pérez et al.42 also used TL technique (excitation wavelength 532 nm) to quantify thermal-diffusivity increase of biodiesel with Ag nanoparticles having a particle size distribution peak at 16.32 nm. The biodiesel was obtained through transesterification from soybean oil with methanol. It was found that the thermal diffusivity of the diesel with different Ag nanoparticle concentrations from 0.1 to 1 vol % increased from 26% to 81% in comparison with the pure biodiesel.
C. Determination of fuel blend levels
The work reviewed in section III B demonstrated that thermophysical properties of biodiesel and diesel fuels were influenced by molecular structure and chemical composition, which accorded with other reported research work in the literature8. This influence laid the foundation for photothermal characterization of the fuels and determination of their blend levels. Guimarães et al.43 investigated diesel/biodiesel blends using the PPE technique. Biodiesel fuels were obtained through transesterification with ethylic route from olive oil (Olea europaea L.), rapeseed (Brassica napus) and animal fat. D and e values were measured with back and front configurations, respectively. It was
This is the author’s peer reviewed, accepted manuscript. However, the online version of record will be different from this version once it has been copyedited and typeset.
23
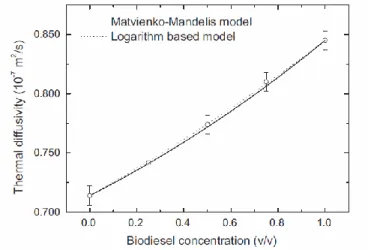
found that the blend D increased concomitantly with biodiesel concentration as shown in Figure 6, demonstrating that D could be employed to determine blend level. Figure 6 also demonstrated that the variation could be described by a model44 for a binary liquid mixture proposed by Matvienko and
Mandelis. Based on a logarithmic mixing model for thermal conductivity and a simple additive law for volumetric heat capacity for a binary mixture, Guimarães et al. also suggested a semi-empirical model (logarithm-based model) for the thermal diffusivity variation to fit the experimental data. In addition, molecular associations in the blends were evaluated based on “excess values”, an alternative way to obtain information on molecular association proposed by Dadârlat and colleagues,45,46 and
found a weak molecular association between biodiesel and diesel in the blends. This finding accords with the fact that the simple additive law for volumetric heat capacity can be applied to calculate D, which implies that the blend can be treated as a binary mixture with weak molecular association.
FIG. 6. Thermal diffusivity variation with volumetric concentration of animal-fat based biodiesel in
diesel. The solid and dashed lines fit the data to the Matvienko-Mandelis model and to a logarithm-based model, respectively. Reproduced with permission from Thermochimica Acta 527, 125 (2012). Copyright 2012 Elsevier.
This is the author’s peer reviewed, accepted manuscript. However, the online version of record will be different from this version once it has been copyedited and typeset.
24
Ventura et al.47 reported the use of TLS to assess soybean-oil/biodiesel blends. The samples were commercial, refined soybean oil and biodiesel purchased in Brazil. A mode-mismatched dual-beam thermal lens setup with a 514.5 nm excitation laser was used to study the blends. Curve-fitting of the 0 – 0.5 s interval of the time-resolved thermal lens signal to the pure thermal lens model Eq. (5) was performed to find the D value, while curve fitting of the 0 – 10 s interval with the model18 that considers thermal lens, photochemical reaction and mass diffusion made it possible to determine the mass diffusivity. The experimental results showed that when the blend was changed from pure biodiesel to one of 98% biodiesel and 2% soybean oil, the thermal diffusivity decreased by 15% and the mass diffusivity increased by 59%. This indicates that both parameters can provide significant information about the presence of soybean oil in biodiesel.
With the use of an excitation laser at 532 nm, Sadrolhosseini et al.48 applied the mode-mismatched dual-beam thermal lens technique to measure thermal diffusivity values of diesel/biodiesel (methyl ester obtained from palm oil) blends. No photochemical reaction was reported. Thermal diffusivity was found to increase as the biodiesel concentration (v/v) became larger and could be fitted well to a model44 proposed by Matvienko and Mandelis, consistent with the above-mentioned results obtained by Guimarães et al.43 using the PPE technique.
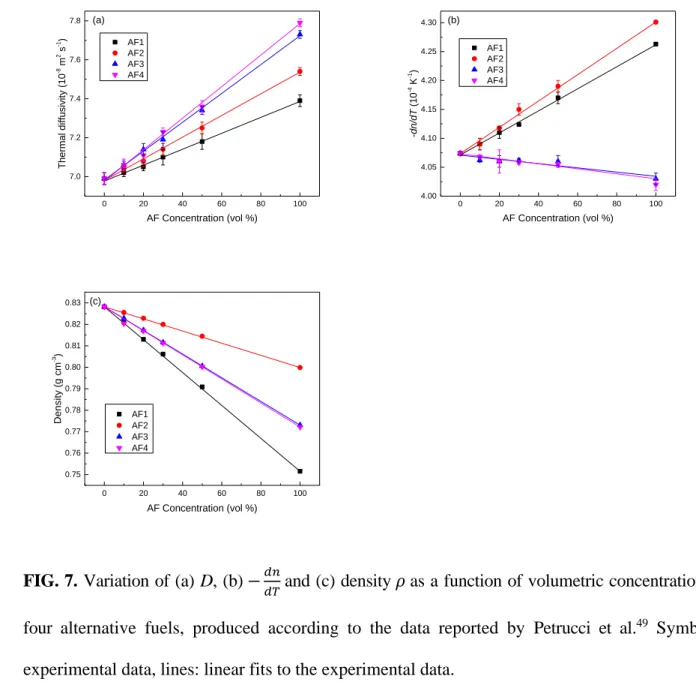
Petrucci et al.49 investigated diesel/alternative fuel (AF) blends. The fuel samples were prepared
by blending alternative renewable components with an ultralow sulfur diesel (ULSD) fuel derived from Canadian oil sands sources. The alternative fuels consisted of two renewable jet fuels (AF1 and AF2) and two commercial, renewable diesel fuels (AF3 and AF4). AF3 and AF4 were prepared by lightly hydrotreating vegetable oils or waste fats to produce a paraffinic fuel. AF1 was produced by hydroprocessing vegetable oils or waste fats to produce a paraffinic fuel in the jet fuel
This is the author’s peer reviewed, accepted manuscript. However, the online version of record will be different from this version once it has been copyedited and typeset.
25
boiling range, which was then isomerized to improve the low-temperature properties. The final alternative fuel (AF2) was prepared by catalytic hydrothermolysis of a vegetable oil, which produced paraffins, naphthenes, and aromatics. The four alternative fuels were blended with the ULSD fuel in five different proportions (10, 20, 30, 50, and 100 vol % AF; 90, 80, 70, 50, and 0 vol % diesel, respectively). These blends were analyzed by spectroscopy (Raman and near infrared) techniques. A TWRC50 was employed to measure D of the samples. A Fabry−Perot interferometer was used to determine 𝑑𝑛
𝑑𝑇 for the fuel blends. Physicochemical fuel properties of the ULSD and four alternative fuels were determined using ASTM methods. D was found to increase together with the increase of AF concentration, as presented in Figure 7 (a), consistent with the aforesaid PPE measurement results of Guimarães et al.43 and TL experimental results presented by Sadrolhosseini et al.48. Figure 7 (b) and (c) show that values of −𝑑𝑛
𝑑𝑇 and density 𝜌 changed linearly with concentration. The linear trends suggest that the AF/ULSD blends resemble simple two-component mixtures, an interpretation that also agrees with the Raman and NIR spectra. The existence of isosbestic points in the Raman spectra further supports the suggestion that each blend acted essentially as a binary mixture, despite the known complexities of the fuels.
This is the author’s peer reviewed, accepted manuscript. However, the online version of record will be different from this version once it has been copyedited and typeset.
26 0 20 40 60 80 100 7.0 7.2 7.4 7.6 7.8 AF1 AF2 AF3 AF4 Th er ma l diffu sivity (1 0 -8 m 2 s -1) AF Concentration (vol %) (a) 0 20 40 60 80 100 4.00 4.05 4.10 4.15 4.20 4.25 4.30 AF1 AF2 AF3 AF4 -d n/d T (1 0 -4 K -1) AF Concentration (vol %) (b) 0 20 40 60 80 100 0.75 0.76 0.77 0.78 0.79 0.80 0.81 0.82 0.83 AF1 AF2 AF3 AF4 Density (g cm -3) AF Concentration (vol %) (c)
FIG. 7. Variation of (a) D, (b) −𝑑𝑛
𝑑𝑇 and (c) density 𝜌 as a function of volumetric concentration of four alternative fuels, produced according to the data reported by Petrucci et al.49 Symbols: experimental data, lines: linear fits to the experimental data.
The linearity in Figure 7 may be viewed as an indication of weak molecular association between the ULSD and each alternative fuel. The density of a binary liquid mixture is expected to be linearly proportional to the concentration (vol %) 1 of liquid 1 if the mixture is not associative, which can be expressed as45
𝜌𝑚𝑖𝑥 = 𝜌2+ (𝜌1− 𝜌2)
1. (14)
This is the author’s peer reviewed, accepted manuscript. However, the online version of record will be different from this version once it has been copyedited and typeset.
27
Here 𝜌1, 𝜌2, and 𝜌𝑚𝑖𝑥denote the density of liquid 1, liquid 2, and the binary mixture, respectively. Also, −𝑑𝑛
𝑑𝑇 of a binary hydrocarbon mixture varies linearly with volume fraction if the volumetric properties of the hydrocarbons obey ideal mixing16,17:
(−𝑑𝑛𝑑𝑇) 𝑚𝑖𝑥 = (− 𝑑𝑛 𝑑𝑇)2+ [(− 𝑑𝑛 𝑑𝑇)1− (− 𝑑𝑛 𝑑𝑇)2]1. (15) (−𝑑𝑛 𝑑𝑇)1, (− 𝑑𝑛 𝑑𝑇)2 and (− 𝑑𝑛
𝑑𝑇)𝑚𝑖𝑥 are the negative thermo-optic coefficients of liquid 1, liquid 2, and
the binary mixture, respectively. The linear trends of 𝜌 and −𝑑𝑛
𝑑𝑇in Figure 7 (c) and (b) demonstrate
that the ULSD/AF blends are non-associative, which is in agreement with the above-mentioned evaluation made by Guimarães et al.43
Raman and NIR spectra of the AF/ULSD blends were also recorded, yielding information on the chemical compositions of the fuels. Two Raman spectrum regions, 400−1700 and 2660−3110 cm−1, were used independently, and also together, for the partial least squares regression (PLSR) calculations. It turned out that the agreement between the actual (i.e., experimental) and predicted values for D, −𝑑𝑛
𝑑𝑇, and 𝜌 were essentially the same when data from either or both regions were
utilized.49 Also, the NIR data in the entire 4740−8870 cm-1 region were utilized for PLSR. Both PLSR calculations achieved excellent agreement between the predicted and experimental values, confirming once again that these properties are governed by the chemical compositions of the fuels.
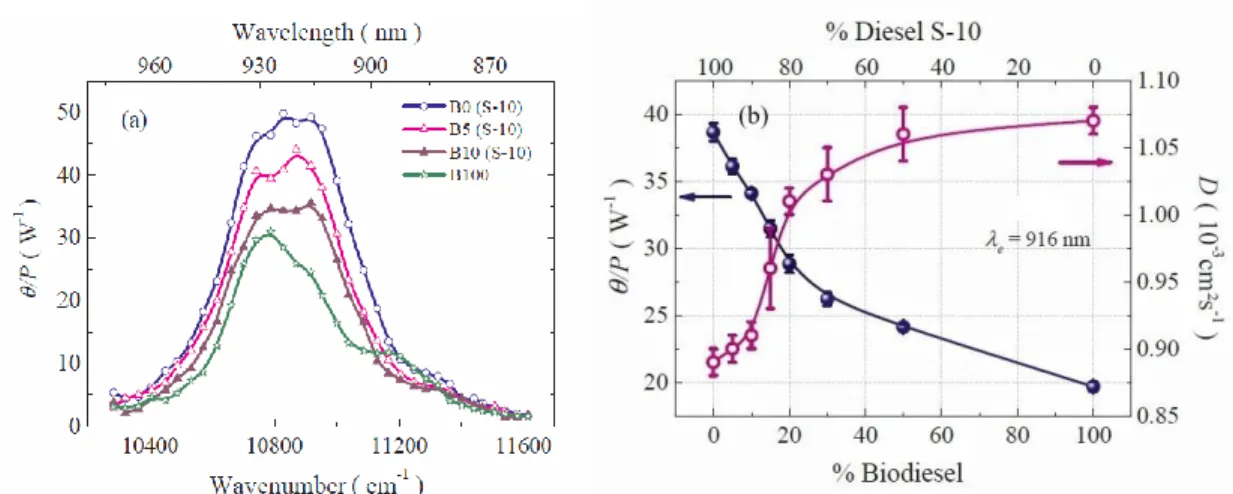
Biodiesel/diesel blends of different concentrations were investigated by Ventura et al.12 using the mode-mismatched TL technique with excitation wavelengths in the NIR region. Samples of methyl biodiesel (B100), S-10 and S-500 diesel (B0) fuels used in this research were commercially available in Brazil. The sulphur contents in the S-10 and S-500 fuel were 10 and 500 mg/kg, respectively. No photochemical reaction or mass diffusion was observed in the NIR region. Steady-state TL
This is the author’s peer reviewed, accepted manuscript. However, the online version of record will be different from this version once it has been copyedited and typeset.
28
measurements were carried out to measure the spectra of 𝜃/𝑃𝑒 defined in Eq. (6), which is proportional to the optical absorption coefficient, as shown in Figure 8 (a). Time-resolved TL experiments with a 916 nm excitation laser were conducted to evaluate 𝜃/𝑃𝑒 and D. As displayed in Figure 8 (b), both parameters varied significantly with concentration, especially when the concentrations of biodiesel in the blends were lower than 20%.
FIG. 8. (a) Spectra of 𝜃/𝑃𝑒 (proportional to optical absorption coefficient) of different blend concentrations; (b) the 𝜃/𝑃𝑒 (filled circle) and D (open circle) of biodiesel/diesel blends varied with blend concentrations. Reproduced with permission from Fuel 212, 309 (2018). Copyright 2018 Elsevier.
As presented in the foregoing reported work, thermophysical properties (e.g., thermal diffusivity and thermo-optic coefficient) and physical properties (e.g., density and mass diffusivity) varied with biodiesel concentration in a biodiesel/diesel blend, owing to the fact that the properties are governed by the chemical compositions of the blend. The variation of these properties, especially thermal diffusivity, in turn can be employed to determine blend level, where a calibration procedure might be
This is the author’s peer reviewed, accepted manuscript. However, the online version of record will be different from this version once it has been copyedited and typeset.
29
required. The blend may be considered a two-component mixture with weak molecular association between the pseudo-components.
D. Fuel stability investigations
The stability of biodiesel, an important characteristic, affects its usage and storage. Stability of biodiesel is its capability to withstand the physical and chemical changes caused by interaction with the environment.5,51 Stability can be categorized into three types:5,9 (1) oxidation, (2) storage, and (3) thermal stability.
Regarding oxidation stability, there is not much resistance for biodiesel when exposed to air, light, and moisture.5 Early work using a photothermal (thermal lens) technique to quantitatively
study the stability was conducted by Savi et al.52 Commercially available soybean oil was divided into three groups. Synthetic antioxidant tert-butylhydroquinone was added to group 1, while 200 ppm natural antioxidant, essential grapeseed oil, was added to group 2. No antioxidant was added to the third group, i.e., pure soybean oil. Conventional oxidation measurements with an accelerated storage testing light bulb (ASTLB) were utilized. The samples were stored in an incubator at (25.0 ± 0.1) °C under the illumination of two 15 W fluorescent lamps for ten days. The degree of oxidation of the oils was evaluated by measuring the content of the conjugated diene once every two days. The conjugated diene concentration increased as a function of time under the photo-oxidation process. On the eighth and tenth days, the samples of groups 2 and 3 showed almost the same concentration of dienes, which was far above that of the group 1 sample. This indicated that the synthetic antioxidant protects the sample from oxidation better than the natural antioxidant does. Besides the conventional ASTLB method, before storage in the incubator, photochemical reaction and mass diffusion parameters of the samples were measured using a mode-mismatched dual-beam
This is the author’s peer reviewed, accepted manuscript. However, the online version of record will be different from this version once it has been copyedited and typeset.
30
thermal lens spectrometer with excitation wavelength 457.9 nm. Significant differences in the values of photoreaction cross-section 𝜎 were found: 𝜎1 = (1.5 ± 0.2) × 10−24 𝑚2, 𝜎2 = (3.5 ± 0.2) × 10−24 𝑚2, and 𝜎
3 = (3.6 ± 0.2) × 10−24 𝑚2 for sample groups 1, 2, and 3, respectively. Photoreaction cross-section 𝜎 characterizes the probability of light interacting with the reactants in the samples and could be considered a direct measurement of photostability of these samples.52 The TL measurement results were in good agreement with those from the conjugated diene method, demonstrating that the TL technique, compared with the conventional ASTLB method, can be used as a much faster and highly sensitive analytical tool for quantitative measurement of photostability in oils.
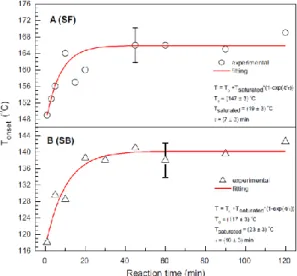
Constantino et al.53 also used mode-mismatched dual-beam TLS with an excitation wavelength of 514.5 nm to evaluate ethylic biodiesel oxidation stability. The biodiesel was produced in the transesterification process from commercial sunflower (SF) and soybean (SB) oils at 40 °C. Samples were collected at different time intervals t (t = 1, 5, 10, 20, 30, 45, 60, 90, 120 min) of the transesterification process. The sample was placed in a quartz cuvette and inserted in an oven with an aperture allowing propagation of the laser beam. Each sample underwent quick oxidation through temperature (T) escalation (22 to 190 °C) with a heating rate of 1 °C/min. During this escalation, short time (200 ms) TL transient signals were recorded at a rate of six transients per °C to attain normalized amplitude 𝜃(𝑇)/(𝑃𝑒𝑙) [see Eq. (6)] and 𝐷(𝑇) . Onset temperatures 𝑇𝑜𝑛𝑠𝑒𝑡, which identify the temperature at which oxidation began, were collected for each sample at different reaction times t by analysing its 𝜃(𝑇)/(𝑃𝑒𝑙) ~ T curve. These 𝑇𝑜𝑛𝑠𝑒𝑡 were subsequently plotted against reaction time t, as shown in Figure 9. The 𝑇𝑜𝑛𝑠𝑒𝑡 ~ t data were curve-fitted to an exponential model 𝑇𝑜𝑛𝑠𝑒𝑡 = 𝑇0+ 𝑇𝑠𝑎𝑡[1 − 𝑒𝑥𝑝(−𝑡/𝜏)]. Here 𝜏 denotes a time constant, governing the growth of the 𝑇𝑜𝑛𝑠𝑒𝑡. Setting the oxidation characteristic time as 5𝜏 , when 99.95% of the maximum
This is the author’s peer reviewed, accepted manuscript. However, the online version of record will be different from this version once it has been copyedited and typeset.
31
amplitude of the 𝑇𝑜𝑛𝑠𝑒𝑡 was reached, gave sufficient duration to reach the steady state of the onset temperature. Figure 9 shows that the samples produced with the reaction time less than 5𝜏 had lower oxidation stability than those over 5𝜏, implying that 5𝜏 could be specified as the transesterification reaction time to produce biodiesel of high oxidation stability. To reduce production cost, longer reaction time should not be required.
FIG. 9. Onset temperature 𝑇𝑜𝑛𝑠𝑒𝑡 of oxidation varied with transesterification reaction time t for biodiesel samples converted from sunflower (SF) and soybean (SB) oils. Reproduced with permission from Fuel 202, 78 (2017). Copyright 2017 Elsevier.
Silva et al.54 employed several analytical methods to evaluate thermal degradation of the ethylic biodiesel converted from soybean oil. The biodiesel was placed in ceramic crucibles and heated at 150 °C for 24 h in a vacuum oven (Fisherbrand™ Isotemp™ Model 282A). The samples were collected at different times t (t = 0, 3, 6, 9, 12, 15, 24 h) for further analysis. PPE and TL (excitation wavelength 488.0 nm) techniques were used to determine thermal effusivity and thermal diffusivity, respectively. It was found that with the thermal treatment, viscosity increased about 85% in 24 h,
This is the author’s peer reviewed, accepted manuscript. However, the online version of record will be different from this version once it has been copyedited and typeset.
32
while iodine index decreased about 19%. The 1H NMR spectrum confirmed the viscosity increase and iodine index reduction resulted from moderate polymerization and possible reduction of double bonds in the biodiesel. Thermal diffusivity and conductivity increased by 9.0% and 9.2%, respectively, not as pronounced as the change of viscosity.
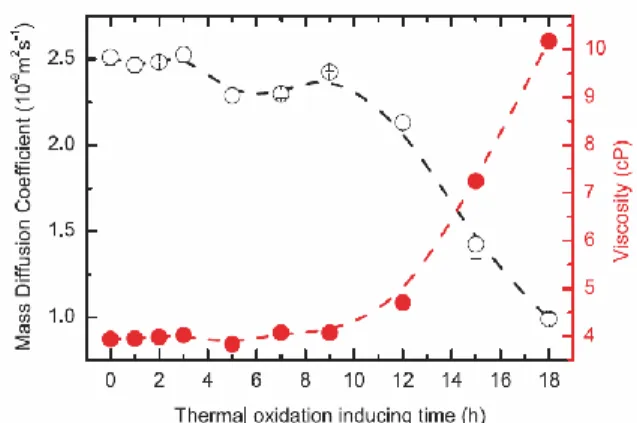
FIG. 10. Evolution of dynamic viscosity (red filled circles) and mass diffusion coefficient (black
open circles) with thermal degradation inducing time. Dynamic viscosity values were measured at 40 °C. Reproduced with permission from Fuel 217, 404 (2018). Copyright 2018 Elsevier.
Savi et al.20 also utilized mode-mismatched TLS to investigate thermal degradation of
commercial biodiesel derived from 50% soybean oil and 50% animal fat by transesterification with methanol. A set of ten samples was placed in a Rancimat apparatus at 110 °C under constant air flux of 10 L/h, undergoing thermo-oxidation for different durations of 0 to 18 h. An excitation wavelength of 950 nm, which was outside any absorption bands of the samples, was used to generate a pure thermal lens and to measure 𝜃 and D as described by Eqs. (6) and (7). A 532 nm excitation laser was used to measure photochemical reaction and mass diffusion with excitation-laser on-and-off analysis.20 It was found that the mass diffusivity (or mass diffusion coefficient) 𝐷
𝑚 did not change significantly during the first 9 h of induced thermo-oxidation. However, after this period,
This is the author’s peer reviewed, accepted manuscript. However, the online version of record will be different from this version once it has been copyedited and typeset.
33
𝐷𝑚 decreased rapidly, which seems to correspond to the increase in dynamic viscosity as shown in Figure 10. This was consistent with the authors’ previous finding that the ratios between saturated and unsaturated species were constant from 0 to 9 h.55 After that, the unsaturated fatty acids methyl
ester (FAME) concentration decreased because of the thermal oxidation. The high viscosity of the samples under thermal oxidation was due to isomerization of the double bond and the increased secondary oxidation products such as gums and insoluble sediments.56
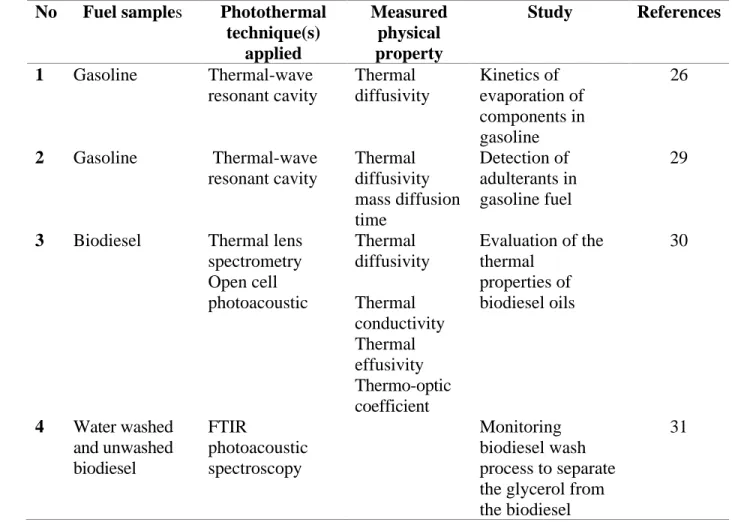
For the information of readers, TABLE II lists the applications of photothermal techniques in fuel characterization reviewed in this section (section III) and corresponding references.
TABLE II Applications of photothermal techniques in fuel characterization
No Fuel samples Photothermal
technique(s) applied Measured physical property Study References 1 Gasoline Thermal-wave resonant cavity Thermal diffusivity Kinetics of evaporation of components in gasoline 26 2 Gasoline Thermal-wave resonant cavity Thermal diffusivity mass diffusion time Detection of adulterants in gasoline fuel 29
3 Biodiesel Thermal lens spectrometry Open cell photoacoustic Thermal diffusivity Thermal conductivity Thermal effusivity Thermo-optic coefficient Evaluation of the thermal properties of biodiesel oils 30 4 Water washed and unwashed biodiesel FTIR photoacoustic spectroscopy Monitoring biodiesel wash process to separate the glycerol from the biodiesel
31
This is the author’s peer reviewed, accepted manuscript. However, the online version of record will be different from this version once it has been copyedited and typeset.
34 5 Biodiesel Thermal lens
spectrometry Thermal diffusivity Effects of residue and oxidation on thermal diffusivity of biodiesel 32 6 Biodiesel Near-infrared thermal lens spectrometry Refractive index changes with the heat deposited per unit volume in the sample with optical absorption coefficient Monitor esters production during the transesterification reaction of soybean oil with ethanol
21 7 Biodiesel and vegetable oils Photopyroelectric techniques Thermal diffusivity Thermal effusivity Thermal conductivity Thermal characterization of biodiesel fuels and their corresponding precursor vegetable oils 33 8 Biodiesel and vegetable oils Thermal lens spectrometry Thermal diffusivity Correlation of thermal diffusivity with physicochemical and rheological properties of biodiesels from several oil sources.
34 9 Alternative diesel Thermal lens spectrometry Thermal diffusivity Thermo-optic coefficient Correlation of thermophysical properties with nine physicochemical properties. 36
10 Biodiesel Thermal lens
spectroscopy Thermal diffusivity Thermal diffusivity enhancement after adding Au nanoparticles 40, 41
11 Biodiesel Thermal lens
spectroscopy Thermal diffusivity Thermal diffusivity enhancement after adding Ag nanoparticles 42 12 Diesel/biodiesel blends Photopyroelectric techniques Thermal diffusivity Thermal effusivity Thermal characterization of biodiesel/diesel blends and 43
This is the author’s peer reviewed, accepted manuscript. However, the online version of record will be different from this version once it has been copyedited and typeset.
35 Thermal conductivity molecular associations 13 Soybean-oil/biodiesel blend Thermal lens spectroscopy Thermal diffusivity Thermal diffusivity of the soybean-oil/biodiesel blend 47 14 Diesel/biodiesel blends Thermal lens spectroscopy Thermal diffusivity Thermal diffusivity of the biodiesel/diesel blends 48 15 Alternative-fuel/diesel blends Thermal-wave resonant cavity Thermal diffusivity Thermo-optic coefficient Density Correlation of thermophysical properties with chemical composition of blends 49 16 Diesel/biodiesel blends Thermal lens spectroscopy Thermal diffusivity 𝜃/𝑃𝑒 Blend levels 12
17 Soybean oil Thermal lens
spectroscopy Photoreaction cross-section Stability of soybean oil 52
18 Biodiesel Thermal lens
spectroscopy Onset temperatures Stability of soybean oil 53 19 Biodiesel Photopyroelectric techniques Thermal lens spectroscopy Thermal diffusivity Thermal conductivity Viscosity Stability of soybean oil 54
20 Biodiesel Thermal lens
spectroscopy Mass diffusivity Dynamic viscosity Stability of soybean oil 20
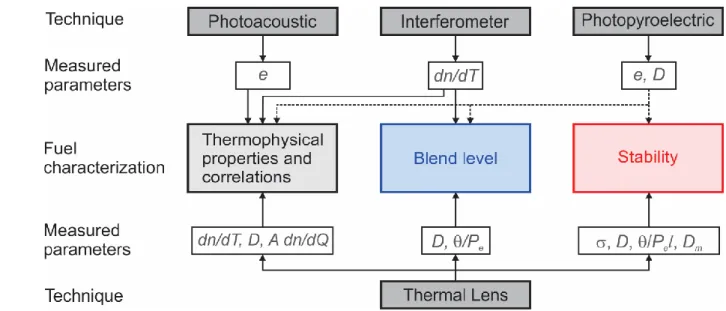
IV. DISCUSSION AND PERSPECTIVE
As shown in section III, photothermal techniques have been employed to characterize renewable diesel (e.g., biodiesel), diesel, and their blends in three areas: fuel thermophysical properties and correlations, determination of fuel blend levels, and fuel stability investigations. Figure 11 summarizes the major techniques and measured parameters for the characterization in these areas. This figure shows that thermal lens is the most widely applicable technique, followed by the
This is the author’s peer reviewed, accepted manuscript. However, the online version of record will be different from this version once it has been copyedited and typeset.