HAL Id: hal-00646120
https://hal.inria.fr/hal-00646120
Submitted on 29 Nov 2011
HAL is a multi-disciplinary open access
archive for the deposit and dissemination of
sci-entific research documents, whether they are
pub-lished or not. The documents may come from
teaching and research institutions in France or
abroad, or from public or private research centers.
L’archive ouverte pluridisciplinaire HAL, est
destinée au dépôt et à la diffusion de documents
scientifiques de niveau recherche, publiés ou non,
émanant des établissements d’enseignement et de
recherche français ou étrangers, des laboratoires
publics ou privés.
Interactive competitive breadth-first exploration for
sketch interpretation
Achraf Ghorbel, Sébastien Macé, Aurélie Lemaitre, Eric Anquetil
To cite this version:
Achraf Ghorbel, Sébastien Macé, Aurélie Lemaitre, Eric Anquetil. Interactive competitive
breadth-first exploration for sketch interpretation. International Conference on Document Analysis and
Recog-nition, Sep 2011, Beijing, China. �10.1109/ICDAR.2011.241�. �hal-00646120�
Interactive competitive breadth-first exploration for sketch interpretation
Achraf Ghorbel∗, S´ebastien Mac´e∗, Aur´elie Lemaitre†, Eric Anquetil∗ ∗INSA de Rennes,†Universit´e de Rennes 2
UMR IRISA, Campus de Beaulieu, F-35042 Rennes Universit´e Europ´eenne de Bretagne, France
{achraf.ghorbel, sebastien.mace, aurelie.lemaitre, eric.anquetil}@irisa.fr
Abstract—In this paper, we present a new generic method for an interactive interpretation of sketches. This method is based on a competitive breadth-first exploration of the analysis tree. As opposed to well known structural approaches, this method allows to evaluate simultaneously several possible hypotheses of recognition in a dynamic local context of document. At each step of the analysis, the decision process selects the best hypotheses. If it detects an ambiguity, it will solicit the user to select the right hypothesis. In fact, the user participation has a great impact to avoid error accumulation during the analysis step and overcomes the combinatory due to the sketch complexity. This paper demonstrates this interactive method on 2D architectural floor plans.
Keywords-sketch recognition; breadth-first exploration; in-teractive recognition; 2D architectural floor plans;
I. INTRODUCTION
Digital documents are becoming more and more om-nipresent in our life. Many reasons such as the flexibility of-fered by digital processing have led to transform handwritten documents to digital ones. In this context, we are working on mapping technical paper documents, like architectural floor plans, to numerical ones. We aim at offering a complete and homogeneous solution to unify paper document recognition and pen-based sketch interpretation (for instance: with Tablet PC).
In the literature, two major approaches to interpret doc-uments are perceived: statistical and syntactic. Choosing one of these two approaches depends on the document to analyze: the syntactic approach is the best approach to interpret a well structured document, and the statistical approach is the best adopted when dealing with a big ho-mogeneous and labeled base allowing the learning. A major advantage of methods based on statistical approach [1] [2] is the incorporation of uncertainty. However, these methods usually lack the ability to convey the hierarchical structure of the document and need a wide learning on a homogeneous and labeled base. Syntactic methods [3] [4] [5] [6] segment the image in primitives and are based on rules or graphs to describe how to compose these primitives. However, syntac-tic methods have difficulties to incorporate the uncertainty.
In this work, we focus on structured documents. We present a new syntactic approach based on an interactive lazy interpretation of the document. For modeling this approach, we adopt the bidimensional grammars. Unlike the classical
syntactic and the static approaches, the suggested method does not always select the first or the best found hypothesis. The associated analysis process is able to take into account the uncertainty so that the user can be solicited by the analyzer to choose between two or more possible hypothe-ses. This intervention of the user avoids a false decision and thus the propagation of errors during the analysis. This interactive recognition strategy allows lazy interpretation of complex structured documents. It can be applied to off-line documents (image), as illustrated in this paper (Figure 8(a)), as well as on-line or vectored documents. One of the main originalities is to allow a breadth-first exploration of the analysis tree driven by a contextual focus on a delimited zone of the document. Each branch is characterized by a score so that the decision process is able to take the right decision or to ask the user in case of ambiguities.
The remaining of the paper is organized as follows. In the section II, we introduce our analysis method. The implementation of our interactive analyzer is described in section III. Experimental results are reported in section IV and finally, section V concludes the paper.
II. INTERACTIVE BREADTH-FIRST EXPLORATION In this section, we present the analyzer by first describing its main characteristics. Then, we detail its internal design. A. Analyzer characteristics
In structured documents, the primitives must not be in-terpreted in an isolated manner. Indeed, the interpretation of each primitive has an impact on the interpretation of its neighbors. For that, to interpret a primitive, it is necessary to take into account the neighbor primitives. However, we work in a bidimensional context (images), which induces a large combinatory. To overcome this complexity problem, we propose to guide our breadth-first exploration using a spatial contextual focus.
This idea is close to the well known LL(k) analysis, where reading the next k tokens enables to choose without ambiguities which rule must be applied. However, in our bidimensional analysis, we have to limit the number of token k to explore, i.e. the depth of the analysis. Consequently, contrary to the LL(k) analysis, the exploration of the fol-lowing tokens does not allow to take a unique decision on the rule to apply, because we voluntarily limitate the value of
k. Moreover, sometimes, the grammar is not LL(k) for any k and the analyser meets ambiguities. In those two cases, the process can not take the right decision, and may hesitate between several hypotheses. In order to validate the right decision, we propose an analysis process that can, through its decision process, take the right decision or ask the user in case of ambiguities. For this purpose, the analyzer is based on the following characteristics:
• a rule based analysis,
• a bidimensional descending breadth first analysis, • the attribution of scores to each hypothesis, • a spatial contextual focus of the exploration. B. Analyzer design
The analyzer explores the matching between the docu-ments structure defined by the production rules and the set of primitives contained in the document. The interactive breadth-first analysis process consists of three stages: 1) defining the local context, 2) building the analysis tree and 3) making the decision . Figure 1 shows the complete process of analysis and the relationship between the three parts of the analyzer. User intervention Defining the local context Building the analysis tree Making the decision Starting analysis : document to analyze End of analysis : document analyzed
Figure 1. Analysis process
1) Defining the local context: the bidimensional local context is defined for an analysis tree as the maximum distance between the elements of the root and the elements of any leaves. The size of the local context is a parameter to define according to each type of document. Figures 5(a) and 5(b) show the evolution of the local context (the frame which surrounds primitive to interpret) during the analysis process.
2) Building the analysis tree: each primitive can be interpreted in several ways. The number of analysis trees corresponds to the number of possible interpretations for the current primitive. Each root is the production rule which consumes this primitive. Each node or leaf is the application of a production rule deduced from the previous node. Figure 4 illustrates an example of the analysis for a given bidimensional local context. The system tries to explore all the possible productions in the local context.
Every leaf or node of the tree has a calculated score from both its local score and the score obtained from the preceding nodes. Every score determines the adequate degree to validate a production. It is calculated from each rule.
3) Making the decision: after building all the analysis trees, the decision process determines the right root to validate. Two cases are presented: case of a single root and case of several roots.
• Case of a single root: this root is validated.
• Case of several roots: the branch having the highest leaf score in each root is considered. These branches are sorted by the score of each leaf. Then we compare the obtained branches. Two cases may appear:
– Implicit validation: when the analyzer is confident enough to choose the correct root without integrat-ing the user. The analyzer implicitly validates the root which has the branch having the highest score. – Explicit validation: when the decision process re-quires the user to validate the right decision. In practice, if the difference between the branch with the highest score and another branch is below a threshold, called threshold of confidence and these two branches are contradictory (at least one joint primitive is not consumed by the same rule production), the user intervention is required. When the correct root is validated, other roots are put on hold and the new roots are either the sons of this root if exists, or the waiting roots otherwise. We take the first step (cf section II-B1). The analysis is complete when no production rule is applicable.
III. IMPLEMENTATION OF THE INTERACTIVE ANALYZER In this section, we describe the implementation of our interactive analysis method and illustrate it on 2D architec-tural plans. For this, we consider a set of production rules modeling 2D architectural plans. These rules are illustrated in Figure 2. We detail, during this section, the building of the analysis tree for the interpretation of a primitive, the impact of moving the local context on the analysis tree and the decision process in a case of ambiguity.
Figure 2. Example of production rules used for the architectural plans A. Interpretation of a primitive
In order to simplify the explanation of this part, we rely on a simple example of 2D architectural plan. We consider that each primitive can be interpreted as a wall or as a part of a door. A door is composed of a sequence of primitives between a wall and a segment that are collinear. A wall is composed of a single primitive. This is described by the production rules P1, P2 and P4 presented in Figure 2.
Figure 3 shows the image during the interpretation. An element is already interpreted (a wall), and other primitives
have not yet been interpreted. We now present how we build the analysis tree for the next primitive to interpret (here ”prim2”).
Figure 3. Document being analyzed and position of the lo-cal context during the analysis. ”prim2” is the next primitive to interpret. The box describes the local context and includes ”prim2”, ”prim3” and ”prim4”
Figure 4. Illustration of the analysis tree for the interpre-tation of ”prim2”: two roots are considered. (-) and (+) designate respectively the con-sumed elements and the created elements.
Building the analysis tree of a primitive ”prim2” begins with the productions which consumes the primitive ”prim2” and describes all possible productions in a local context (Figure 4). The number of analysis trees corresponds to the number of possible productions to interpret ”prim2”. ”prim2” can be interpreted in two different manners (rules P1 and P2). P1 allows the transformation of ”prim2” to a wall and P2 transforms ”prim2” in a sequence (one of the components of a door). Then, we continue the analysis while the following primitives belong to the local context. Here, we study the different interpretations of ”prim3” and ”prim4”. Each branch of the tree has a score deduced from the set of productions applied in this branch. The decision process will validate the right decision based on the criteria described in section II-B3.
B. Transition between two successive analysis trees After building the analysis trees and validating the right root, the analyzer examines the rest of the document. This processing consist in building new analysis trees. The roots of these trees are the sons of the last validated production (last root validated) if they exist, or roots placed on hold, otherwise. The transition of an analysis tree to the next analysis tree involves a shift of the local context. This movement allows applying the other productions. In fact, the building of the new analysis trees is not the rebuilding of the whole branch but only the new found productions by shifting the context.
In order to better assimilate this transition, we describe an example of interpretation of the 2D architectural plan. This example is composed of seven primitives; three of them build up a door. Figure 5(a) and 5(b) show the state of the analyzer in two consecutive stages. Figures 6(a) and 6(b) show the built analysis trees from two consecutive primitives.
(a) Analysis step; the analysis tree is illustrated in Figure 6(a)
(b) Next analysis step; the anal-ysis tree is illustrated in Fig-ure 6(b)
Figure 5. Document being analyzed and position of the local context (box) during the analysis
The two roots of the Figure 6(b) are the sons of the root illustrated in Figure 6(a). The productions in gray are the productions that are found by shifting the local context. If
(a) The first analysis tree: one root exists
(b) The second analysis tree: two roots exist. The grayed leaves indicate the new applied production rules in movement the local context.
Figure 6. The analysis trees. (-) and (+) designate respectively the consumed elements and the created elements.
a single tree appears, the decision process validates its root. Otherwise it takes the best hypothesis or can solicit the user in case of ambiguity.
C. Ambiguity cases
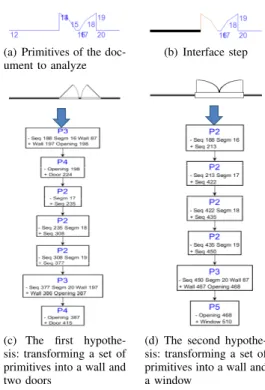
In this section, we focus on a particular case of the analysis process: the case of user intervention. Figure 7(a) shows a part of architectural floor plan to interpret. We launch the analyzer on the same principle described in Sec-tion II-B. When arriving the stage illustrated in Figure 7(b), two contradictory hypotheses are considered: with almost the same score (see section II-B3). The decision process evaluates two production rules: apply the first hypothesis, which corresponds to the branch described in Figure 7(c), i.e. the interpreted document will consist of two doors, or apply the second hypothesis, which corresponds to the branch described in Figure 7(d), i.e. a single window is interpreted. The decision process decides to report the decision on the user because the two branches in competition are contradic-tory and the difference between the scores is lower than the threshold of confidence. The decision process launches an interaction with the user, and proposes to validate the first hypothesis (Figure 7(c)). If the user validates this hypothesis, the corresponding root is validated. If the user declines the first hypothesis, the system implicitly validates the second hypothesis, and then we will have the result shown in Figure 7(d).
(a) Primitives of the doc-ument to analyze
(b) Interface step
(c) The first hypothe-sis: transforming a set of primitives into a wall and two doors
(d) The second hypothe-sis: transforming a set of primitives into a wall and a window
Figure 7. Example of ambiguity between two hypotheses IV. EXPERIMENTAL RESULTS
In this section we illustrate the presented interactive breadth-first exploration on handwritten 2D architectural floor plans (cf Figure 8(a)). We present the formal rule description of the document, and how we estimate the size of the local context before presenting preliminary results.
A. Document description
In order to describe the structure of the document, we use the context-driven constraint multiset grammars (CD-CMG), developed in our previous work [7]. The CD-CMG allows the use of statistical pattern recognizers. The analysis process is driven by the document structure that involves a significant decrease in the complexity of the analysis process. We have adapted this eager analysis process to address a lazy (a posteriori) interpretation process based on the interactive breadth-first exploration. The score calculated by each production is due to preconditions and constraints of the rule production [7]. This grammar has been used for the interpretation of on-line hand-drawn structured documents. In this work, we adopt this grammar for a off-line interpre-tation of structured document.
In the application context of handwritten 2D architectural floor plan recognition, we focus on floor plans composed of walls, doors and windows. The set of primitives is composed of segments extracted from the image using Kalman filter-ing [8]. Each primitive can be a component of an openfilter-ing (door or window), or a wall. An opening element is a set of segments localized between two collinear walls, or between a collinear wall and segment. Figure 2 shows some production rules used for the description of architectural plans.
B. Determination of the local context size
An important question is the definition of the size of the 2D local context. Increasing the size of the 2D local context can increase the rate of document recognition, but also creates more combinatory and ambiguity problems, and therefore requires more user intervention. The idea is to minimize the size of the 2D local context while conserv-ing enough contextual information to take the right local interpretation of the primitives according to the productions rules. In our case, this size is calibrated according to the maximum length of an opening.
C. Preliminaries results
We tested this interactive sketch recognition approach on 26 images of handwritten 2D architectural floor plans (some examples are reported in Figure 8(a) and Figure 9) drawn by five persons. Each image consists of walls, doors and windows. These images contain 128 doors and 133 windows. During the interpretation of these images, the decision process solicits the user on average of one time by image. About 60% of these images do not require a user intervention. In 70% of the cases of ambiguity, the user validates the first hypothesis. In 30% cases, the user does not validate the first hypothesis, and so he does not validate the branch that has the best score. This demonstrate the importance of the user intervention to avoid interpretation errors. The Figure 8(a) focuses on the interpretation of one of these floor plan images. During the interpretation of this
(a) Original image (b) Document misinterpreted. User validates the first hypothesis. Transformation of two doors in a window (cf. dotted line).
(c) Document correctly interpreted. User invali-dates the 1st hypothesis and the decision process implicitly validates the 2nd hypothesis (two doors). Figure 8. Interpretation’s result for the second example
image, a single case of ambiguity is presented; and thus the analysis process solicits the user at once. Figure 8(b) shows the result if the user validates the first hypothesis (wrong interpretation) and Figure 8(c) shows the obtained result otherwise (if the user rejects the first hypothesis, the analysis process implicitly validates the second hypothesis).
(a) (b)
(c) (d)
Figure 9. Examples of 2D architectural floor plans V. CONCLUSION
In this paper, we have presented an original interactive analysis process to interpret structured documents such as 2D architectural floor plans. This analyzer is based on a competitive breadth-first exploration of the analysis tree according to a dynamical local context of the document. The decision process is able to solicit the user in the case of strong ambiguity. The first tests of this interactive analyzer have been made on the 2D architectural floor plans. Integrating the user in the analysis process is in our view a key point to adress complex off-line sketch reognition.
Future work will focus on applying this new analysis strategy in different types of structured documents and on extending the experimental results on large image databases.
ACKNOWLEDGMENT
The authors would like to thank all the people who took part in the experiments. This work partially benefits from the financial support of the ANR Project Mobisketch.
REFERENCES
[1] M. Lemaitre, E. Grosicki, E. Geoffrois, and F. Preteux, “Pre-liminary experiments in layout analysis of handwritten letters based on textural and spatial information and a 2d markovian approach,” in ICDAR 2007, vol. 2, 2007, pp. 1023 –1027. [2] F. Montreuil, E. Grosicki, L. Heutte, and S. Nicolas,
“Un-constrained handwritten document layout extraction using 2d conditional random fields,” ICDAR 2009, vol. 0, pp. 853–857. [3] K. Chan and D. Yeung, “An efficient syntactic approach to structural analysis of on-line handwritten mathematical expres-sions,” Pattern Recognition, vol. 33, no. 3, pp. 375–384, 2000. [4] J. Fitzgerald, F. Geiselbrechtinger, and T. Kechadi, “Mathpad: A fuzzy logic-based recognition system for handwritten math-ematics,” in ICDAR 2007, vol. 2, 2007, pp. 694 –698. [5] S. Mao, A. Rosenfeld, and T. Kanungo, “Document structure
analysis algorithms: a literature survey,” in Proc. SPIE Elec-tronic Imaging, vol. 5010, 2003, pp. 197–207.
[6] B. Co¨uasnon, “Dmos, a generic document recognition method: Application to table structure analysis in a general and in a specific way,” IJDAR 2006, vol. 8, no. 2, pp. 111–122. [7] S. Mac´e and E. Anquetil, “Eager interpretation of on-line
hand-drawn structured documents: The dali methodology,” Pattern Recognition, vol. 42, no. 12, pp. 3202–3214, 2009.
[8] I. Leplumey, J. Camillerapp, and C. Queguiner, “Kalman filter contributions towards document segmentation,” in icdar 95, 1995, p. 765.