25 June 2021
AperTO - Archivio Istituzionale Open Access dell'Università di Torino
Original Citation:
VvPIP2;4N aquaporin involvement in controlling leaf hydraulic capacitance and resistance in grapevine
Published version: DOI:10.1111/ppl.12463 Terms of use:
Open Access
(Article begins on next page)
Anyone can freely access the full text of works made available as "Open Access". Works made available under a Creative Commons license can be used according to the terms and conditions of said license. Use of all other works requires consent of the right holder (author or publisher) if not exempted from copyright protection by the applicable law. Availability:
This is a pre print version of the following article:
VvPIP2;4N aquaporin involvement in controlling leaf hydraulic capacitance and resistance in 1
grapevine 2
Marco Vitali1*, Hervé Cochard2,3, Giorgio Gambino4, Alexandre Ponomarenko2, Irene Perrone4, 3
Claudio Lovisolo1,4.
4
1 Department of Agricultural, Forest and Food Sciences (DISAFA), University of Turin, Largo
5
Paolo Braccini 2, 10095 Grugliasco, TO, Italy 6
2 INRA, UMR 547 PIAF, F–63100 Clermont-Ferrand, France;
7
3 University Blaise Pascal, UMR 547 PIAF, F–63177 Aubière, France
8
4 Institute for Sustainable Plant Protection, National Research Council (IPSP-CNR), Grugliasco
9
unit, Largo Paolo Braccini, 10095 Grugliasco, TO, Italy 10 11 Corresponding author: 12 *Marco Vitali 13
Department of Agricultural, Forest and Food Sciences (DISAFA), University of Turin, Largo Paolo 14
Braccini 2, 10095 Grugliasco, TO, Italy 15 Tel: +39.011.6708885 16 Fax: +39.011.6708658 17 e-mail: [email protected] 18 19 e-mail addresses: 20
Marco Vitali: [email protected] 21
Hervé Cochard: [email protected] 22
Giorgio Gambino: [email protected] 23
Alexandre Ponomarenko: [email protected] 24
Irene Perrone: [email protected] 25
Claudio Lovisolo: [email protected] 26
Abstract 27
Hydraulic capacitance in a plant tissue (C), buffers the xylem tension storing and releasing water 28
and has been highlighted in recent years as an important factor that affects water relations such as 29
drought tolerance and embolism formation. Aquaporins are well known to control leaf hydraulic 30
resistance (Rh) but their role in the control of C is unknown. Here, we assess Rh and C on detached 31
grapevines leaves (cv. Brachetto) wild type (WT) and over-expressing the aquaporin gene 32
VvPIP2;4N (OE). For this purpose, we developed a new method inspired from the pressure-volume 33
curve technique and the rehydration kinetic method, which allowed us to monitor the dynamics of 34
dehydration and rehydration in the same leaf. The recovery after dehydration was measured in the 35
dark, in light non-transpirative conditions, light-transpirative conditions and transpirative condition 36
adding abscisic acid. 37
Pressurizing to dehydrate leaves in the OE line, the recorded Rh and C were respectively lower and 38
higher than those in the WT. The same results were obtained in the dark recovery by rehydration 39
treatment. In the presence of light, either when leaves transpired or not (by depressing vapour 40
pressure deficit), the described effects disappeared. The change in Rh and C did not affect the 41
kinetics of desiccation of detached leaves in the dark in air, in OE plants compared to WT ones. 42
Our study highlighted that both Rh and C were influenced by the constitutive over-expression of 43
VvPIP2;4N. The effect of aquaporins on C is reported here for the first time and may involve a 44
modulation of cell reflexion coefficient. 45
46
Key words: Vitis vinifera (L.), transgenic plant, leaf water potential, pressure-volume curve, 47
isohydric, anisohydric, osmoregulation. 48
49
Abbreviations: 50
AQPs, aquaporins; OE, over-expressing; WT, wild type; C, hydraulic capacitance; Rh, hydraulic 51
resistance; RWC, relative water content; Ψ, leaf water potential; +0.5, dehydration treatment with 52
pressure applied of 0,5 MPa; +1, dehydration treatment with pressure applied of 1 MPa; dark, 53
rehydration treatment in dark condition; light VPD≈0, rehydration treatment in light condition 54
without transpiration; light transp, rehydration treatment in light and transpirative condition; light 55
transp ABA, rehydration treatment in light transpirative condition supplying ABA in the 56
rehydrating water. 57
58 59
Introduction 60
Water is the most limiting resource for plant life and yield (Lange et al. 1982). Although the 61
majority of a plant’s fresh weight consists of water, the amount of water retained by the plant in the 62
biomass is less than one percent of the total water transpired via stomata. Consequently, a huge 63
quantity of water is required to enable photosynthesis and plant growth. Therefore, water uptake 64
from the soil, its transport, storage and usage are mediated through a system that has evolved to 65
fully exploit the chemical and physical properties of water. 66
The cohesion-tension theory, formulated by Dixon (1914), explains the transport of water in the 67
soil-plant-atmosphere continuum. In this system, water moves from high to low water potential (Ѱ), 68
and thus, towards transpiring leaves. Transpiration itself drives the rise of the xylem sap and 69
submits water to a considerable tension. Such tension is balanced by the hydrogen bonds among 70
water molecules, which prevent the breaking of the water column. However, under different 71
conditions (e.g., water shortage, freezing, high evaporative demand), this tension can increase and 72
cavitation can occur by air seeding mechanisms (Angeles et al. 2004). 73
In Dixon’s theory, water transport in plants behaves like an electrical circuit, and follows Ohm’s 74
law as described by van den Honert (1948), hence, the flow is due to the water potential gradient 75
and is hindered by the hydraulic resistance (Rh). Moreover, the pathway can be split into the water 76
transport of individual organs (root, stem, leaf), each with its own Rh that affects the water flux 77
(Tyree and Ewers 1991; Sperry et al. 1998). However, in this equation, the hydraulic capacitance 78
(C) has to be considered as an important variable that affects the output. Analogously to an 79
electrical circuit, C has the function of a capacitor (or condenser) used to store charge temporarily, 80
thus buffering a power surge. Therefore, in plants, C represents the ability to store water and to 81
buffer the system reducing the degree of tension in the xylem in transient water status conditions. 82
Capacitance corresponds to the ratio between the change in water content and the change in water 83
potential (C=ΔRWC/ΔѰ; Tyree and Ewers 1991; Sperry et al. 2008); its effect is to make the 84
amount of water entering a region different from the amount of water leaving it, whenever ΔѰ 85
changes. 86
Leaves are the final component of the water transport system and via their stomata, they balance 87
carbon nutrition and water loss by transpiration, thereby playing a key role in the regulation of the 88
water status and the strategy of responses to drought stress. To prevent deleterious dehydration, 89
stomatal conductance is controlled by a complex regulation of guard cells, involving chemical and 90
hydraulic signals (Comstock 2002). The relevance of leaf C was recently investigated in relation to 91
various physiological traits, such as leaf thickness (Sack et al. 2003), leaf water content per unit dry 92
weight, leaf mass per unit area and lignin content (Blackman and Brodribb 2011). In addition, the 93
latter study described the ‘dynamic C’ (computed as the volume of flowing water measured by a 94
flowmeter) to be highly coordinated with leaf hydraulic conductance (Blackman and Brodribb 95
2011). 96
Aquaporins (AQPs) exercise a strategic function in the leaf water pathway by controlling 97
symplastic water movements (Kaldenhoff et al. 2008), and being the main link between the 98
symplastic and apoplastic pathways, e.g., bundle sheath cells. These water channels, without 99
changing the flux direction, can enormously increase the water movement across membranes, and 100
therefore, decrease the Rh. Aquaporins can be modulated at several levels, via transcription, 101
translation, trafficking and gating (opening and closing of the pore) and by environmental and 102
developmental factors (Chaumont and Tyerman 2014), such as: irradiation (Prado et al. 2013; 103
Lopez et al. 2013), transpiration (Sakurai-Ishikawa et al. 2011; Laur and Hacke 2013), circadian 104
rhythms (Hachez et al. 2008), abscisic acid (ABA) feeding (Shatil-Cohen et al. 2011; Pantin et al. 105
2013), auxin feeding (Péret et al. 2012) and shoot wounding (Sakurai-Ishikawa et al. 2011; 106
Vandeleur et al. 2014). 107
Several experiments using transgenic plants overexpressing or silencing AQP genes have been 108
performed (reviewed by Martínez-Ballesta and Carvajal 2014) and have demonstrated that the 109
transcriptional modulation of AQPs generally modifies the Rh, however, to date, no results exist 110
concerning the effects of AQPs on C. 111
In this study, grapevine plants over-expressing VvPIP2;4N (an aquaporin previously described by 112
Perrone et al. 2012, extremely efficient in facilitating cell-to-cell water pathways), were used to 113
assess the role of this AQP isoform on leaf Rh and C during leaf dehydration and recovery. The 114
hydraulic parameters were evaluated by a new method derived from the pressure-volume curve 115
(Tyree and Hammel 1972) and the rehydration kinetic technique explained by Blackman and 116
Brodribb (2011). 117
118
Materials and Methods 119
Plant material 120
The experiments were performed on leaves of potted ‘Brachetto’ grapevines; 10 wild-type (WT) 121
and 10 transgenic plants from line 16, which overexpressed VvPIP2;4N (OE), previously described 122
by Perrone et al. (2012). The 4-year-old plants (two buds pruned with bud-break in March, non-123
grafted) were grown in a greenhouse on a mixture of peat–loam, under natural light and CO2
124
concentration conditions. Plants were irrigated regularly according to their needs. In this 125
experiment, fully expanded, mature leaves were used. 126
Assessment of Rh and C in the dehydration and rehydration processes 127
To assess leaf Rh and C during dehydration, a method similar to the pressure-volume curve 128
technique was used (PV curve, Tyree and Hammel 1972), whereas for the rehydration phase, a 129
modified rehydration kinetic method (see Cdyn measurements, Blackman and Brodribb 2011) was
130
applied. 131
The new method proposed required the use of a high-precision balance (Mettler Toledo AT261 132
deltarange; Greifensee, CH) and a modified Scholander pressure bomb, inverted over the balance, 133
and controlled by an external manometer (Bourdon, FR; class 0.1). The cut surface of the petiole, 134
which passed through the sealing system of the pressure chamber, was immersed in a cylinder (50 135
mL), filled with deionised water, placed on the balance plate (Fig. 1). The balance plate was 136
isolated from the laboratory atmosphere and the relative humidity inside the balance chamber was 137
kept close to 100% using wet paper. By applying and releasing the pressure in the chamber, the 138
flow out/in of the leaf was measured by an increase or decrease in weight measured by the balance, 139
as explained below. 140
141
Dehydration phase (Fig. 1a): 142
Leaves were collected at 18.00. The petiole extremity, cut under water, was submerged in deionised 143
water in non-transpirative conditions (dark, sealed bag) overnight, to allow full leaf hydration. 144
During the following day (at 9.00; 12.00; 15.00), the leaves were removed from water and were 145
immediately placed in the pressure chamber. After measurement of the native water potential 146
(Ѱleaf), the pressure chamber was upturned on the balance, placing the petiole in the 50-mL
147
cylinder. Starting from this steady state, the pressure was increased to a value of +0.5 (noted +0.5 148
thereafter) and +1.0 MPa (+1) and was kept constant; the pressure rose by 0.05 MPa per second 149
regulated by a needle valve. The mean native Ѱleaf, after one night hydration in water, was -0.01
150
MPa for both WT and OE leaves. 151
This kind of measurement was also possible with water-stressed leaves, taking care to maintain the 152
pressure inside the chamber slightly lower than that balancing the leaf water potential. This was 153
necessary to avoid water uptake by the leaf and thus, to maintain a stable weight on the balance to 154
begin measurements. 155
156
Rehydration phase (Fig. 1b): 157
The pressure was applied to the dehydrated leaves until Ѱleaf = -1 MPa (dehydration, +1). After
158
reaching this level of dehydration, the pressure was released and the chamber was removed. The 159
petioles remained suspended by the lid of the pressure chamber and immersed in the 50-mL 160
cylinder. The water uptake by the leaves began immediately after depressurisation and was 161
monitored for 1 h in different conditions: 162
1) dark and non-transpirative condition (Dark, leaf in a dark glass bell); 163
2) light and low transpirative condition (Light VPD≈0, a 2L glass baker was placed over the leaf 164
with artificial light set at 500 µmol photons m-2s-1, wet paper was previously used to reduce the 165
VPD to 0 with formation of condensed water on the glass surface); 166
3) light and transpirative condition (Light transp, artificial light set at 500 µmol photons m-2s-1,leaf 167
in laboratory atmosphere); 168
4) light, transpirative condition and ABA (Light transp ABA, conditions as in 3), and ABA 169
solution (100 µmol final concentration) supplied in the cylinder. 170
In the transpiring treatments, the air temperature was between 19°C and 24°C and the relative 171
humidity was between 45 and 60% (max VPD 10 Pa/KPa). 172
The Rh and capacitance C were obtained from the equation describing the pressure-volume curves 173
and was computed using the formula: 174
𝑓 𝑥 = P ∗ C ∗ 1(!!/(!"∗!)) (Tyree and Hammel 1972)
175
where: x is the cumulative water in/out of the leaf and P is the pressure applied. Using this equation 176
Rh correspond to the slope of the first part of the curve and C to the plateau phase, as highlighted in 177
Fig. 2. 178
To avoid errors in the calculation due to the transpiration, in the rehydration phase, C was computed 179
subtracting mathematically the transpiration rate from the water uptake weight measurements above 180
600 seconds. Until this time, transpiration marginally affected the water uptake (see Fig. 4). Data 181
were normalised to the dry weight (70°C, 12 h) and the leaf area (measured by the area-meter 182
Li3000, Lincoln NE, USA) of the single leaves. SigmaPlot 12.3 software (Systat Software, San Jose 183
CA, USA) was used for data elaboration and statistical analysis by t-test and one-way ANOVA 184
(after passed Shapiro-Wilk test). To perform ANOVA analysis, data were normalised when the 185
homogeneity of variance test (Bartlett’s test) failed. 186
187
Aquaporin expression profile 188
Leaves for the aquaporin expression analysis were collected in light and dark conditions following 189
the same time-course and sampling protocol as for leaves used in the physiological tests (collected 190
at 18.00 and left rehydrated overnight in a dark, sealed bag). Leaves in the dark treatment were 191
harvested in liquid nitrogen at 9.00, whereas leaves in the light treatment were submitted to 192
artificial irradiation for 1 h before harvesting. The real-time RT-PCR (qRT-PCR) quantification of 193
transgenic VvPIP2;4N, endogenous PIP2 genes and PIP1-type aquaporins were carried out as 194
previously reported (Perrone et al., 2012) on two biological replicates (three technical replicates 195
each). 196
197
Leaf dehydration dynamics in dark conditions 198
For each line, 22 leaves were sampled at 18.00; petioles were cut under water to avoid embolism 199
formation. Leaves were left free to rehydrate through the petiole in deionised water overnight, as 200
above. The following day at 8.00, water was removed and leaves were left dehydrated on the bench 201
in the dark in the laboratory atmosphere. The fresh weight of fully hydrated leaves was measured 202
with a balance (Denver Instruments Company TR603D; Arvada CO, USA), and then for each line, 203
the weight and Ѱleaf were measured every hour during dehydration. The dry weight was recorded
204
after drying the leaves at 70°C for 12 h as above, and was used to calculate the relative water 205
content (RWC). The C was newly computed according to Koide et al. (2000), as: 206 C =RWC/Ψleaf dry weight 207 Results 208 Dehydration phase 209
During dehydration, water was forced to exit through the petioles, and a higher flow out through the 210
petiole of the OE leaves was observed in comparison to the WT, as shown in Fig. 2, when leaves 211
were pressurised to +0.5 MPa (+0.5). These differences were also observed if the data were 212
normalised by the leaf dry weight or leaf area (Fig. 2). 213
By collecting the data during three different daily time-points (Fig. S1); morning, noon and 214
afternoon, we observed that for both lines, the amount of water that exited from the petioles 215
followed an increasing trend and reached a maximum at noon and a minimum in the morning. 216
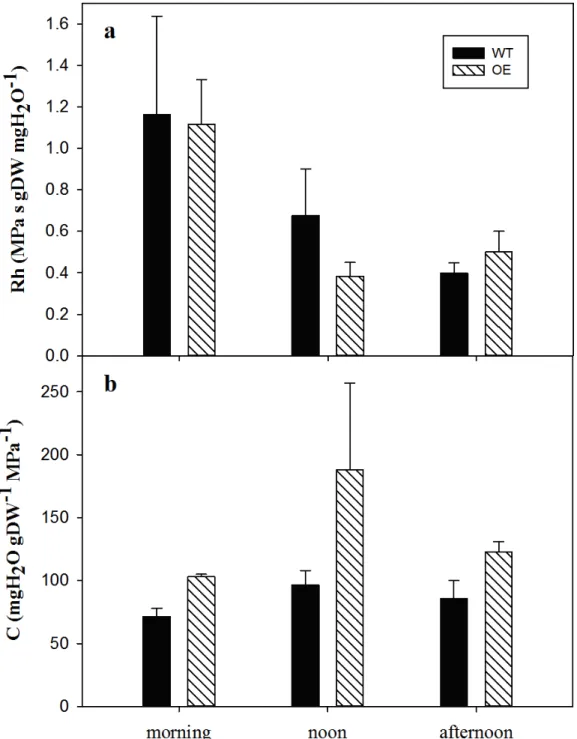
The mean Rh and C, obtained by pressurising leaves (dehydration phase), are shown in Fig. 3 (and 217
Fig. S3). When leaves were pressurised to +0.5 MPa (+0.5), Rh was very low in both lines with no 218
significant differences, whereas at +1 MPa (+1), the Rh increased drastically and a significant 219
difference was observed in the OE line (P < 0.01), where the Rh was lower than in WT (Fig. 3a). 220
Conversely, C was significantly higher (+38%, P < 0.05) in the OE line in the first treatment (+0.5), 221
but this difference disappeared when the pressure was increased to +1 MPa (+1) (Fig. 3b). 222
223
Rehydration phase 224
Subsequent to dehydration to Ѱleaf = -1.0 MPa (+1 treatment), leaves were left to rehydrate for 1 h
225
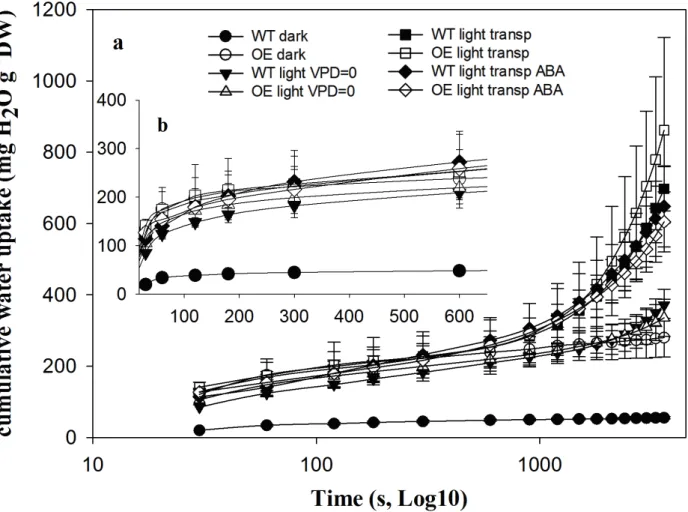
(rehydration phase) by subjecting them to different stimuli. The total time course of the amount of 226
water flowing into the petiole after the pressure release is shown in Fig. 4. Moreover, the first 600 227
seconds of the experiment, which was used to compute Rh and C, are highlighted in Fig. 4 frame b. 228
These figures illustrate that for all lines and conditions, the recovery from stress occurred via a slow 229
rise in the volume of water absorbed, and that transpiration began at about 600 s following 230
depressurisation, as suggested by the divergence among treatments with (light transp, light transp 231
ABA) or without transpiration (dark, light VPD≈0). Finally, although the standard errors 232
overlapped for all treatments, the leaves of the WT line in dark conditions appeared to behave 233
differently from those in the other treatments, which uptook more water. 234
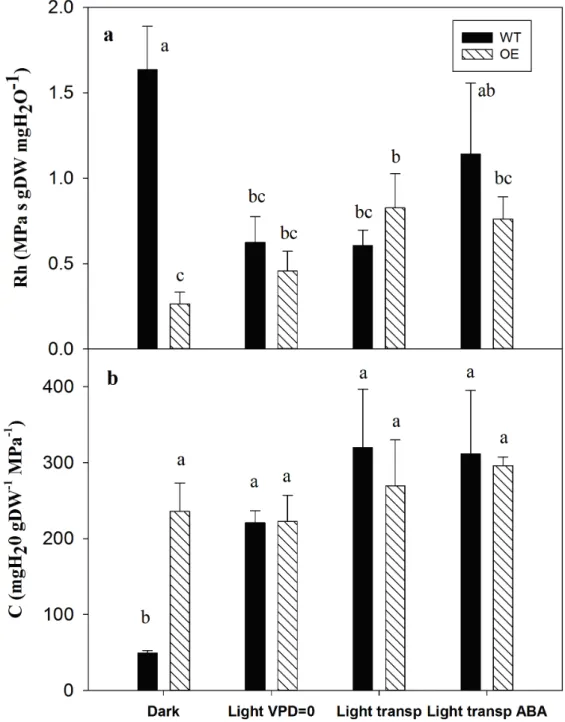
The recovery behaviour following dehydration can be analysed by Rh, C (calculated from the 235
dynamics shown in Fig. 5) and the Ѱleaf reached after 1 h of rehydration (Table 1). Major
236
differences in Rh between the two lines were observed in dark conditions (Fig. 5a), where in WT 237
leaves, the Rh was significantly higher than in OE leaves (P < 0.01). This result agrees with the 238
difference observed in the +1 treatment (where dark conditions were ensured by the pressure 239
chamber) between WT and OE, although at a higher order of magnitude. The switch from dark to 240
light VPD≈0 conditions decreased the Rh in WT to levels similar to those in the OE line, whereas 241
Rh was not affected by the transition between dark and light in OE leaves. Transpiration (‘light 242
transp’ treatment) did not have any effect on the Rh in WT lines, whereas a slight increase was 243
observed in the transgenic line. Finally, after the addition of ABA to the solution absorbed through 244
the petiole (light transp ABA), the Rh in WT leaves increased, but not significantly, compared to 245
other rehydration conditions in the light and from the transgenic line. However, in general, we 246
observed a reduction in Rh in WT following the transfer from the dark to the light conditions 247
adopted in the rehydration experiments, whereas the Rh in the OE line tended to increase with 248
increased transpiration. 249
The C computed from the same dataset did not differ between WT and transgenic leaves; only the 250
dark condition strongly affected this parameter, causing it to be significantly lower (P < 0.001) in 251
the WT than in all other treatments. 252
The Ѱleaf recorded in the pressurisation experiment and its recovery are reported in Table 1. During
253
dehydration, there were no differences in the native Ѱleaf and consequently in the final Ѱleaf reached.
254
However, in contrast, during rehydration, the leaves of the two lines revealed a different ability to 255
recover the Ѱleaf within 1 h after de-pressurisation. In particular, both lines in dark conditions
256
showed a higher recovery rate, reaching a Ѱleaf close to 0. On the contrary, Ѱleaf decreased when
257
leaves were subjected to artificial light and transpiration, whereas ABA treatment facilitated the 258
recovery of Ѱleaf. The statistical analysis showed differences in the Ѱleaf between the two lines in the
259
‘light VPD≈0’ and ‘light transp’ treatments. 260
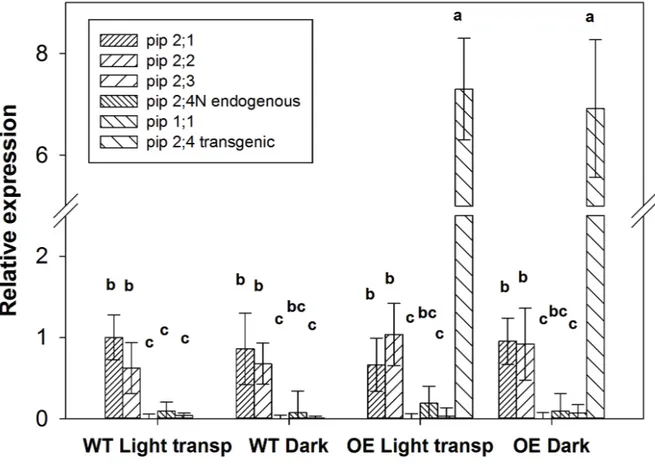
Based on these observations, the expression levels of transgenic VvPIP2;4N, together with those of 261
other known PIP2 genes and a PIP1-type aquaporin were quantified by qRT-PCR in dark and light-262
transpiration conditions in both lines. The WT showed the same AQP expression profile in dark and 263
light-transpiration conditions, suggesting a light-independent expression of these PIP genes (Fig. 264
6). Furthermore, in the OE line, the expression profile of AQPs and transgenic VvPIP2;4N was 265
generally not affected by light; only VvPIP2;2 was slightly more highly expressed in the dark. 266
267
Leaf dehydration dynamics in dark conditions 268
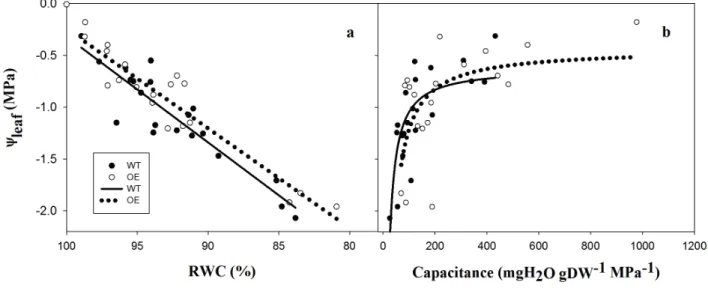
The dynamics of the dehydration of detached leaves in darkness was observed from the relationship 269
between Ѱleaf and relative water content (RWC). In addition, C was calculated as ΔRWC/ΔѰ*dry
270
weight. The linear regression indicated a slightly higher RWC coupled to the decrease in Ѱleaf in
271
OE compared to WT leaves (Fig. 7a). The hyperbole describing Ѱleaf versus C was similar in both
272
lines, showing a reduction of C that was related to the decrease in Ѱleaf (Fig. 7b). Overall, the mean
273
values of C for the two lines confirmed the higher C in OE lines (156 ± 26 for the WT, 261 ± 52 for 274
OE; P < 0.05). 275
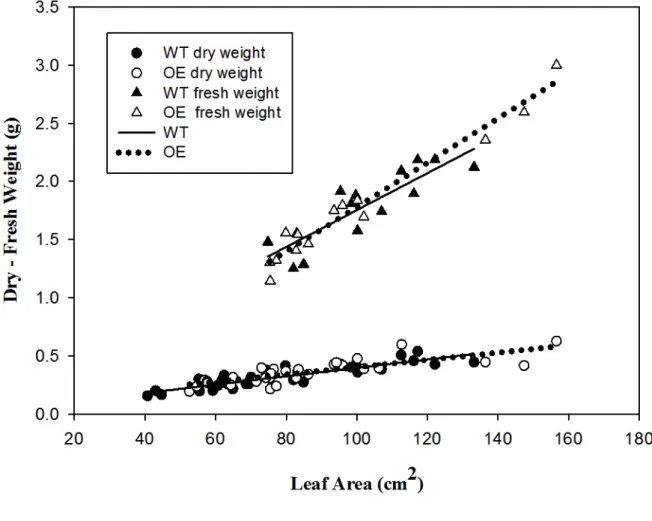
Finally, to evaluate whether the observed differences were attributable to anatomical or 276
morphological traits, the pairwise relationships between leaf area, dry weight and fresh weight were 277
assessed, without identifying any significant differences between WT and OE samples (Fig. S2). 278
279
Discussion 280
In this study, transgenic grapevines that constitutively over-expressed VvPIP2;4N under the 281
Cauliflower mosaic virus 35S promoter (Perrone et al. 2012) were used to assess the role of this 282
AQP on leaf Rh and C during leaf dehydration and recovery. Many studies in several transgenic 283
plants had previously shown that overexpression of aquaporin genes decreased the Rh (Ding et al., 284
2004; Lee et al. 2012; Perrone et al. 2012), whereas the silencing of AQPs resulted in an increase in 285
Rh (Siefritz et al. 2004, Sade et al. 2014). However, no information is available concerning the 286
relationship between AQP and C. 287
288
The effect of aquaporins on hydraulic resistance (Rh) 289
As expected, the Rh was lower in OE leaves than WT leaves when a high over-pressure was applied 290
to the leaves (+1) and when recovery was performed in dark conditions. These two results can be 291
ascribed to a direct effect of transgenic PIP2;4N, since an increase in PIP2;4N protein in the 292
membranes improves the membrane permeability to water. 293
Several studies have demonstrated that AQPs expression and activity are regulated in leaves by 294
circadian rhythms (Siefritz et al. 2002; Nardini et al. 2005; Hachez et al. 2008). In this study, the 295
dynamics of the cumulative water outflow from leaves showed an influence of circadian rhythms 296
both in OE and WT leaves (Fig. S1). These differences might have affected the computation of the 297
hydraulic traits (Fig. S3); however, to limit the impact of the biological clock, the experiments were 298
performed at distinct times during the day and averaged together in both genotypes. AQP 299
expression has been assessed just during the morning. However, the impact of circadian rhythms on 300
the extremely high expression of the transgene (meanly 7 times higher than endogenous aquaporins) 301
can be reasonably neglected. In addition, it is known that the 35S gene promoter, controlling 302
expression of our transgene, shows low or no sensitivity to the biological clock (Millar et al. 1992; 303
Xu and Johnson 2001). 304
The leaf Rh increase with increased dehydration as observed in Fig. 3, where Rh drastically 305
increased from the +0.5 to the +1 treatment, which was reported previously (Sack & Holbrook 306
2006; Scoffoni et al. 2014). However, this might represent a physical artefact. One hypothesis might 307
be that a pressure of 1 MPa leads to a massive flow of water in the leaf hydraulic system in a short 308
time interval. Probably, the anatomy of the leaf itself (e.g., connectivity between cells, bundle-309
sheath permeation, petiole conductivity) hinders the runoff of a large amount of water in very short 310
period, leading to an overestimation of the Rh. This phenomenon might explain the different 311
magnitude of the Rh values in the dehydration +1 and recovery treatments. 312
In the recovery trial (rehydration, Fig. 6), the impact of various stimuli, such as i) light, ii) ABA and 313
iii) transpiration on the aquaporin activity was studied. 314
i) The light effect cancelled the differences in Rh observed in the dark between WT and OE. 315
Indeed, in WT, the hydraulic resistance decreased from dark to light conditions, whereas this 316
parameter was not affected in OE leaves. This change in the Rh in WT leaves agrees with the 317
increase in leaf conductivity under irradiation previously reported by several authors (Nardini et al. 318
2010, Sellin et al. 2010; Guyot et al. 2012; Lopez et al. 2013; Prado et al. 2013). Cochard et al. 319
(2007) indicated two potential light-modulated mechanisms of water movement in leaves: activated 320
AQPs in light conditions allows water to move freely in the symplast and apoplast, whereas at low 321
irradiance, deactivated AQPs force the water to move apoplastically, limited by the bundle sheath. 322
Voicu et al. (2009) highlighted that the light-dependent change in leaf hydraulic conductance in bur 323
oak (Quercus macro-carpa) was not linked to any AQP transcriptional changes. Similarly, in this 324
study, we observed only slight differences in the expression profile between WT and OE following 325
changes in the light conditions (Fig. 6). The qRT-PCR data showed clearly that the major difference 326
between WT and OE lines derived exclusively from the high and constitutive expression of 327
transgenic VvPIP2;4N in all conditions (Figure 6). Thus, for the OE line, the low levels of Rh in 328
dark conditions were probably linked to the constitutive over-expression of VvPIP2;4N. Some type 329
of contrasting regulation can be hypothesised between the light-mediated activation of leaf AQPs 330
(as in WT) and VvPIP2;4N. In WT plants, light activates AQPs depressing the Rh recorded upon 331
dark condition, whereas in OE plants the effect of VvPIP2;4N (a root-specific AQP isoform, 332
presumably insensitive to light modulation) is masked from the light-activation of the other leaf 333
aquaporins. 334
ii) ABA modulates AQP activity, having opposite effects on root and leaf AQPs: 335
downregulating the bundle-sheath AQPs and thus limiting hydraulic conductivity in leaf (Pantin et 336
al. 2013; Shatil-Cohen et al. 2011), and upregulating the AQP isoforms and increasing the hydraulic 337
conductivity in the root (Jang et al. 2004; Hose et al. 2000; Thompson et al. 2007; Parent et al. 338
2009). In this study, no significant differences in Rh between OE and WT were observed in the 339
presence of ABA. However, comparing the light transp and light transp ABA treatments, Rh 340
values were twice as high in WT, even if this difference was not statistically significant, whereas no 341
changes were observed in OE leaves. We can speculate that ABA caused a closed conformation of 342
PIP2;4N or inhibited the expression of all AQP isoforms in WT leaves. This downregulation might 343
also occur in OE leaves, but additionally and in contrast, ABA might promote the expression or 344
open conformation of PIP2;4N. The PIP2;4N protein is a root-specific AQP, and therefore, is 345
putatively upregulated by ABA; its presence might have led to a lack of increase in Rh. The first 346
ABA signalling transduction pathway that mediates water transport in roots has been recently 347
demonstrated in maize (Fan et al. 2015). Notably, the post-translational regulation of ZmPIP 348
through ABA signalling appears to be particularly important to regulate root hydraulic conductivity. 349
This might also be the case for transgenic VvPIP2;4N aquaporin in leaf: since it is under the control 350
of a constitutive promoter (35s), ABA might promote its activity in a phosphorylation-dependent 351
manner. Moreover, Chitarra et al. (2014) demonstrated that ABA promoted VvPIP2;4N expression 352
in vessel-associated cells (VACs), but not in whole petiole tissue. Similarly to the VACs, the leaf 353
bundle sheath cells regulate exchange between the xylem and other parenchyma cells. The ABA-354
induced upregulation of VvPIP2;4 at this level might easily explain the lack of rise of Rh level in 355
the transgenic leaves. 356
A secondary effect of ABA was observed in the recovery of the final Ѱleaf after 1 h of rehydration
357
(Table 1). In contrast to the Light trans treatment (final Ѱleaf = -0.23 MPa for WT and -0.35 MPa
358
for OE), ABA promoted a more rapid recovery of Ѱleaf in OE leaves than WT leaves (-0.19 MPa for
359
WT and -0.17 MPa for OE). A positive effect of ABA on Ѱleaf recuperation has been already
360
described by Lovisolo et al. (2008) and Chitarra et al. (2014) in grapevine. In the OE leaves, the 361
better recovery of Ѱleaf appeared to be coupled to a low hydraulic resistance, in agreement with data
362
reported by Martre et al. (2002). 363
iii) In this study, we observed no effect of transpiration on changes in leaf Rh, contrary to that 364
reported for AQPs in root (Sakurai-Ishikawa et al. 2011; Laur and Hacke 2013). This might be due 365
to the low vapour-pressure deficit in the laboratory atmosphere or to the real absence of an effect of 366
this parameter in leaf. 367
368
The effect of aquaporins on hydraulic capacitance (C) 369
The C plays an important role in drought tolerance, as does Rh, by affecting the amount of water 370
destined to buffer the change in the transpiration stream elicited by the atmospheric conditions and 371
especially the ability to extend survival after stomatal closure (Bartlett et al. 2012; Gleason et al. 372
2014). Since sapwood has been recognised as the major source of stored water, several studies have 373
addressed the importance of C in this tissue in depth. Generally, C varies in sapwood between 40 374
and 900 kg m-3 MPa-1 (Scholz et al. 2007; Čermák et al. 2007; McCulloch et al. 2014) and is 375
inversely related to the wood density. The contribution to the total daily transpiration reported in 376
literature varies between 5% and 45% (Goldstein et al. 1997; Phillips et al. 2003; Verbeeck et al. 377
2007). However, the importance of the leaf C was highlighted by Gleason et al. (2014), who 378
suggested that the majority of water lost during dehydration derives from leaves. By comparing the 379
C in grapevine leaves in this study (up to 250 mg H2O gDW-1 MPa-1), classifies them within the
380
upper half of the ranking proposed by Blackman and Brodribb (2011), among species with a low C, 381
although the measured units are not the same (the conversion was performed by considering that 1 382
m2 of leaf area corresponds to 31 g DW, from Fig. S2). 383
A novel aspect highlighted by this study is the effect of AQP on C, which, as far as we know, has 384
never been reported so far. The ability of a tissue to be a capacitor, and to buffer the xylem tension 385
and prevent embolism was debated as an important trait that might distinguish plants and their 386
susceptibly to water stress (Sperry et al. 2008; McCulloh et al. 2014). 387
In the pressurisation tests, differences in C were observed between WT and OE leaves only when 388
the pressure applied was low (+0.5 MPa, Fig. 3b), in contrast to what was observed for Rh (Fig. 3a). 389
The absence of effect when the applied pressure reached +1 MPa might be due to the high 390
dehydration imposed on the leaves. Indeed, C is a variable parameter that decreases together with 391
water status (Fig. 7b), potentially becoming comparable in the two lines when the leaves were 392
dehydrated to -1 MPa. 393
In the recovery trials (Fig. 5b), WT leaves showed the lowest C in dark conditions compared with 394
the other treatments; probably, the high Rh observed in WT hindered the water uptake and thus, the 395
recovery of C. In theory, a longer recovery time might lead to the complete recovery of C in WT 396
leaves, although the leaves were in dark conditions. However, in dark conditions, the final Ѱleaf
397
values fully recovered in both lines; even though this occurred in WT without a complete recovery 398
in C. Thus, in this latter case, the amount of water inside the WT leaves was lower than that in OE 399
leaves, and probably, the amount of water outflow pressurizing once more the leaf could be lower 400
than that observed during the first pressurisation. 401
The aim of the last experiment was to check whether OE leaves dehydrate more rapidly in dark 402
conditions (where major differences between WT and OE leaves were observed). However, the 403
overexpression of VvPIP2;4N did not lead to a more rapid leaf dehydration, and the computed C 404
(ΔRWC/ΔѰ*dry weight) confirmed higher values in the OE line. 405
406
Hypothesis and ecological significance 407
Using transgenic plants ant the novel method proposed in this study, a positive relationship between 408
C and AQPs in grapevine leaves was demonstrated. The mechanisms underlying this interaction are 409
not yet clear, however, an initial hypothetical mechanism might involve the reflection coefficient 410
(σ) of the plasma-membrane. This parameter is considered to be the ability of a channel (AQP in 411
our case) to be permeable to, or reflect a solute. It is determined by the arginine selectivity filter at 412
the end of the pore (Zeuthen et al. 2013) and by the solute size. In the membrane of transgenic 413
plants in this study, the higher concentration of AQPs can lead to a higher permeation of small 414
solutes (Gomes et al. 2009), resulting in a low reflection coefficient, and consequently allowing a 415
higher water flow (coupled to osmolyte flow) through the lipid bilayer. Although this consideration 416
depends on the contribution of VvPIP2;4N to the total water transport across the plasma membrane. 417
The theoretical framework for the implication of σ on C is provided as supplemental information. 418
Recently, Maurel et al. (2015) proposed a pivotal role for AQPs in buffering cell osmoregulation, 419
by reviewing and re-interpreting AQP function as osmo-sensor in guard cells during stomatal 420
movements or in growing pollen tubes. The mechanism was only speculated, but an AQP-mediated 421
increasing cell C, conferring to the cells higher buffer capacitance, could gives light to this still un-422
described phenomenon. 423
A second hypothesis, which does not exclude the first, is that AQPs might connect several cells, and 424
increase the volume of the reservoir. In grapevine, AQPs can increase the link between the symplast 425
and apoplast in the areoles, the enclosed areas between the interconnected veins, thereby improving 426
the leaf capacitance. In figure 8 a schematic representation of the leaf hydraulic pathway is 427
represented with its simplification (right side), showing the increase of the total capacitor due to the 428
sum of different capacitors. 429
Previously, studies have attributed a role to AQPs in iso/anisohydric behaviour, due to changes in 430
leaf conductance (Sade et al. 2009; Vandeleur et al. 2009; Chaumont and Tyremann 2014). In other 431
studies (Ogasa et al. 2013; McCulloh et al. 2014), plants are categorised according to their C, for 432
their investment in structural features to maintain the transpiration stream (anisohydry) or their 433
sensitivities to embolisms (Tombesi et al. 2014). 434
Perrone et al. (2012) considered the ‘Brachetto’ WT as an anisohydric cultivar, and the transgenic 435
lines could be interpreted as being even more anisohydric. In this study, AQPs conferred a greater 436
C, and hence, a greater degree of anisohydry, highlighting the possible link between C, Rh, 437
aquaporins and iso/anisohydric responses to water stress. Clearly, the implication of Rh and C on 438
whole leaf hydraulics deserves further attention. 439
440
Author Contributions 441
H.C., C.L. and M.V. conceived and planned the study. M.V. performed the experiment and 442
analysed the data. M.V. wrote the first draft of the manuscript. G.G. and I.P. produced plant 443
materials, carried out the molecular analysis and reviewed the manuscript. A.P. helped in the 444
physical dissertations. H.C. theorized the hypothesis presented and reviewed the manuscript. C.L. 445
reviewed the manuscript and obtained funds to support the project. 446
447
Acknowledgements 448
M.V. wishes to thank the staff of INRA of Clermont Ferrand for their great assistance, and Philippe 449
Label for providing ABA; Francesca Cardinale and Silvia Cavalletto for reviewing the manuscript 450
and for ‘physics’ explanations, respectively, and Sonia Livigni for discussions on post-translational 451
regulation and for her understanding. M.V. was partly granted during his PhD by SIGEVI project 452
(PSR, misura 124, azione 1) founding by Piedmont region and UE. 453
454
References 455
456
Angeles G, Bond B, Boyer JS, Brodribb T, Brooks JR, Burns MJ, Cavender-Bares J, Clearwater M, 457
Cochard H, Comstock J, Davis SD, Domec J-C, Donovan L, Ewers F, Gartner B, Hacke U, 458
Hinckley T, Holbrook NM, Jones HG, Kavanagh K, Law B, Lopez-Portillo J, Lovisolo C, 459
Martin T, Martinez-Vilalta J, Mayr S, Meinzer FC, Melcher P, Mencuccini M, Mulkey S, 460
Nardini A, Neufeld HS, Passioura J, Pockman WT, Pratt RB, Rambal S, Richter H, Sack L, 461
Salleo S, Schubert A, Schulte P, Sparks JP, Sperry J, Teskey R, Tyree M (2004) The cohesion-462
tension theory. New Phytol 163: 451–452 463
Bartlett MK, Scoffoni C, Sack L (2012) The determinants of leaf turgor loss point and prediction of 464
drought tolerance of species and biomes: a global meta-analysis. Ecol Lett 15: 393–405 465
Blackman CJ, Brodribb TJ (2011) Two measures of leaf capacitance: insights into the water 466
transport pathway and hydraulic conductance in leaves. Funct Plant Biol 38: 118–126 467
Čermák J, Kučera J, Bauerle WL, Phillips N, Hinckley TM (2007) Tree water storage and its 468
diurnal dynamics related to sap flow and changes in stem volume in old-growth Douglas-fir 469
trees. Tree Physiol 27: 181–198 470
Chaumont F and Tyerman SD (2014) Aquaporins: highly regulated channels controlling plant water 471
relations. Plant Physiol 164: 1600–1618 472
Chitarra W, Balestrini R, Vitali M, Pagliarani C, Perrone I, Schubert A, Lovisolo C (2014) Gene 473
expression in vessel-associated cells upon xylem embolism repair in Vitis vinifera L. petioles. 474
Planta 239: 887–899 475
Cochard H, Venisse JS, Barigah TS, Brunel N, Herbette S, Guilliot A, Tyree MT, Sakr S (2007) 476
Putative role of aquaporins in variable hydraulic conductance of leaves in response to light. Plant 477
Physiol, 143: 122–133 478
Comstock JP (2002) Hydraulic and chemical signalling in the control of stomatal conductance and 479
transpiration. J Exp Bot 53: 195–200 480
Ding X, Iwasaki I, Kitagawa Y (2004) Overexpression of a lily PIP1 gene in tobacco increased the 481
osmotic water permeability of leaf cells. Plant Cell Environ 27: 177–186 482
Dixon HH (1914) Transpiration and the ascent of sap in plants. Macmillan, London. 483
Fan W, Li J, Jia J, Wang F, Cao C, Hu J, Mu Z (2015) Pyrabactin regulates root hydraulic 484
properties in maize seedlings by affecting PIP aquaporins in a phosphorylation-dependent 485
manner. Plant Physiol Bioch 94: 28-34 486
Flexas J, Scoffoni C, Gago J, Sack L (2013) Leaf mesophyll conductance and leaf hydraulic 487
conductance: an introduction to their measurement and coordination. J Exp Bot 64: 3965–3981 488
Gleason SM, Blackman CJ, Cook AM, Laws CA, Westoby M (2014) Whole-plant capacitance, 489
embolism resistance and slow transpiration rates all contribute to longer desiccation times in 490
woody angiosperms from arid and wet habitats. Tree Physiol 34: 275–284 491
Goldstein G, Andrade JL, Meinzer FC, Holbrook NM, Cavelier J, Jackson P, Silvera K (1997) Stem 492
water storage and diurnal patterns of water use in tropical forest canopy trees. Plant Cell Environ 493
21: 397–406 494
Gomes D, Agasse A, Thiébaud P, Delrot S, Gerós H, Chaumont F (2009) Aquaporins are 495
multifunctional water and solute transporters highly divergent in living organisms. Biochimica 496
Biophysica Acta 1788: 1213–1228 497
Guyot G, Scoffoni C, Sack L (2012) Combined impacts of irradiance and dehydration on leaf 498
hydraulic conductance: insights into vulnerability and stomatal control. Plant Cell Environ 35: 499
857–871 500
Hachez C, Heinen RB, Draye X, Chaumont F (2008) The expression pattern of plasma membrane 501
aquaporins in maize leaf highlights their role in hydraulic regulation. Plant Mol Biol 68: 337– 502
353 503
Honert TH van den (1948) Water transport in plants as a catenary process. Discuss. Paraday Soc, 3, 504
146. 505
Hose E, Steudle E, Hartung W (2000) Abscisic acid and hydraulic conductivity of maize roots: a 506
study using cell- and root-pressure probes. Planta 211: 874–882 507
Jang JY, Kim DG, Kim YO, Kim JS, Kang H (2004) An expression analysis of a gene family 508
encoding plasma membrane aquaporins in response to abiotic stresses in Arabidopsis thaliana. 509
Plant Mol Biol 54: 713–725 510
Kaldenhoff R, Ribas-Carbo M, Sans JF, Lovisolo C, Heckwolf M, Uehlein N (2008) Aquaporins 511
and plant water balance. Plant Cell Environ 31: 658–666 512
Koide RT, Robichaux RH, Morse SR, Smith CM (2000) Plant water status, hydraulic resistance and 513
capacitance. In Plant Physiological Ecology: Field Methods and Instrumentation (eds R.W. 514
Pearcy, J.R. Ehleringer, H.A. Mooney & P.W. Rundel), pp. 161–183. Kluwer, Dordrecht, The 515
Netherlands. 516
Lange OL, Nobel PS, Osmond CB, Ziegler H (1982) Physiological plant ecology II; water relations 517
and carbon assimilation. Encyclopedia of Plant Physiology, vol. 12B. Springer, Berlin 518
Heidelberg New York. 519
Lee SH, Chung GC, Jang JY, Ahn SJ, Zwiazek JJ (2012) Overexpression of PIP2;5 aquaporin 520
alleviates effects of low root temperature on cell hydraulic conductivity and growth in 521
Arabidopsis. Plant Physiol 159: 477–488 522
Lopez D, Venisse JS, Fumanal B, Chaumont F, Guillot E, Daniels MJ, Cochard H, Julien JL, 523
Gousset-Dupont A (2013) Aquaporins and leaf hydraulics: Poplar sheds new light. Plant Cell 524
Physiol 54: 1963–1975. 525
Laur J, Hacke UG (2013) Transpirational demand affects aquaporin expression in poplar roots. J 526
Exp Bot 64: 2283–2293 527
Lovisolo C, Perrone I, Hartung W, Schubert A (2008) An abscisic acid-related reduced transpiration 528
promotes gradual embolism repair when grapevines are rehydrated after drought. New Phytol 529
180: 642–651 530
Martinez-Ballesta MdC, Carvajal M (2014) New challenges in plant aquaporin biotechnology. Plant 531
Sci 217– 218: 71– 77 532
Martre P, Morillon R, Barrieu F, North GB, Nobel PS, Chrispeels MJ (2002) Plasma membrane 533
aquaporins play a significant role during recovery from water deficit. Plant Physiol 130: 2101– 534
2110 535
Maurel C, Boursiac Y, Luu D-T, Santoni V, Shahzad Z, Verdoucq L (2015) Aquaporins in Plants. 536
Physiol Reviews 95 (4) 1321-1358 537
McCulloh AK, Daniel MJ, Frederick CM, David RW (2014) The dynamic pipeline: hydraulic 538
capacitance and xylem hydraulic safety in four tall conifer species. Plant Cell Environ 37: 1171– 539
1183 540
Millar AJ, Short SR, Chua NH, Kay SA (1992) A novel circadian phenotype based on firefly 541
luciferase expression in transgenic plants. Plant Cell 4: 1075–1087 542
Nardini A, Salleo S, Andri S. (2005) Circadian regulation of leaf hydraulic conductance in 543
sunflower (Helianthus annuus cv. Margot). Plant Cell Environ 28: 750–759 544
Nardini A, Raimondo F, Lo Gullo MA, Salleo S (2010) Leaf miners help us understand leaf 545
hydraulic design. Plant Cell Environ 33: 1091–1100 546
Ogasa M, Miki N, Murakami Y, Yoshikawa K (2013) Recovery performance in xylem hydraulic 547
conductivity is correlated with cavitation resistance for temperate deciduous tree species. Tree 548
Physiol 33: 335–344 549
Pantin F, Monnet F, Jannaud D, Costa JM, Renaud J, Muller B, Simonneau T, Genty B (2013) The 550
dual effect of abscisic acid on stomata. New Phytol 197: 65–72 551
Parent B, Hachez C, Redondo E, Simonneau T, Chaumont F, Tardieu F (2009) Drought and 552
abscisic acid effects on aquaporin content translate into changes in hydraulic conductivity and 553
leaf growth rate: a trans-scale approach. Plant Physiol 149: 2000–2012 554
Péret B, Li G, Zhao J, Band LR, Voß U, Postaire O, Luu DT, Da Ines O, Casimiro I, Lucas M, 555
Darren MW, Lazzerini L, Nacry P, King JR, Jensen OE, Schaffer AR, Maurel C, Bennet MJ 556
(2012) Auxin regulates aquaporin function to facilitate lateral root emergence. Nature Cell Biol 557
14: 991–998 558
Perrone I, Gambino G, Chitarra W, Vitali M, Pagliarani C, Riccomagno N, Balestrini R, Kaldenhoff 559
R, Uehlein N, Gribaudo I, Schubert A, Lovisolo L (2012) The grapevine root-specific aquaporin 560
VvPIP2;4N controls root hydraulic conductance and leaf gas exchange upon irrigation but not 561
under water stress. Plant Physiol 160: 965–977 562
Phillips NG, Ryan MG, Bond BJ, McDowell NG, Hinckley TM, Čermák J (2003) Reliance of 563
stored water increases with tree size in three species in the Pacific Northwest. Tree Physiol 23: 564
237–245 565
Postaire O, Tournaire-Roux C, Grondin A, Boursiac Y, Morillon R, Schäffner AR, Maurel C (2010) 566
A PIP1 aquaporin contributes to hydrostatic pressure-induced water transport in both the root 567
and rosette of Arabidopsis. Plant Physiology 152: 1418–1430 568
Prado K, Maurel C (2013) Regulation of leaf hydraulics: from molecular to whole plant levels. 569
Front Plant Sci 4: 255 570
Prado K, Boursiac Y, Tournaire-Roux C, Monneuse JM, Postaire O, Da Ines O, Schäffner AR, Hem 571
S, Santoni V, Maurel C (2013) Regulation of Arabidopsis leaf hydraulics involves light-572
dependent phosphorylation of aquaporins in veins. Plant Cell 25: 1029–1039 573
Robichaux HR (1984) Variation in the tissue water relation of two sympatric Hawaiian Dubautia 574
species and their natural hybrid. Oecologia 65: 75–81 575
Sack L, Cowan PD, Jaikumar N, Holbrook NM (2003) The "hydrology" of leaves: co-ordination of 576
structure and function in temperate woody species. Plant Cell Environ 26: 1343–1356. 577
Sack L. & Holbrook N.M. (2006) Leaf hydraulics. Annu Rev Plant Biol, 57, 361-381. 578
Sade N, Vinocur BJ, Diber A, Shatil A, Ronen G, Nissan H, Wallach R, Karchi H, Moshelion M 579
(2009) Improving plant stress tolerance and yield production: is the tonoplast aquaporin 580
SlTIP2;2 a key to isohydric to anisohydric conversion? New Phytol 181: 651–661 581
Sade N, Shatil A, Attia Z, Maurel C, Boursiac Y, Kelly G, Granot D, Yaaran A, Lerner S, 582
Moshelion M (2014) The role of plasma membrane aquaporins in regulating the bundle sheath-583
mesophyll continuum and leaf hydraulics. Plant Physiol 166: 1609–1620 584
Sakurai-Ishikawa J, Murai-Hatano M, Hayashi H, Ahamed A, Fukushi K, Matsumoto T, Kitagawa 585
Y (2011) Transpiration from shoots triggers diurnal changes in root aquaporin expression. Plant 586
Cell Environ 34: 1150–1163 587
Scoffoni C, Vuong C, Diep S, Cochard H, Sack L (2014) Leaf shrinkage with dehydration: 588
coordination with hydraulic vulnerability and drought tolerance. Plant Physiol 164: 1772–1788 589
Siefritz F, Otto B, Bienert GP, van der Krol A, Kaldenhoff R. (2004) The plasma membrane 590
aquaporin NtAQP1 is a key component of the leaf unfolding mechanism in tobacco. Plant J 37: 591
147–155 592
Siefritz F, Tyree MT, Lovisolo C, Schubert A, Kaldenhoff R (2002) PIP1 Plasma Membrane 593
Aquaporins in Tobacco: From Cellular Effects to Function in Plants. Plant Cell 14 (4): 869-876 594
Shatil-Cohen A, Attia Z, Moshelion M (2011) Bundle-sheath cell regulation of xylem-mesophyll 595
water transport via aquaporins under drought stress: a target of xylem-borne ABA? Plant J 67: 596
72–80 597
Sellin A, Ounapuu E, Karusion A (2010) Experimental evidence supporting the concept of light-598
mediated modulation of stem hydraulic conductance. Tree Physiol 30: 1528–1535 599
Sperry JS, Adler FR, Campbell GS, Comstock JP (1998) Limitation of plant water use by 600
rhizosphere and xylem conductance: results from a model. Plant Cell Environ 21: 347–359 601
Sperry JS, Meinzer FC, McCulloh AK (2008) Safety and efficiency conflicts in hydraulic 602
architecture: scaling from tissues to trees. Plant Cell Environ 31: 632–645 603
Thompson AJ, Andrews J, Mulholland BJ, McKee JM, Hilton HW, Horridge JS, Farquhar GD, 604
Smeeton RC, Smillie IR, Black CR, Taylor IB (2007) Overproduction of abscisic acid in tomato 605
increases transpiration efficiency and root hydraulic conductivity and influences leaf expansion. 606
Plant Physiol 143: 1905–1917 607
Tombesi S, Nardini A, Farinelli D, Palliotti A (2014) Relationships between stomatal behavior, 608
xylem vulnerability to cavitation and leaf water relations in two cultivars of Vitis vinifera. 609
Physiol Plant 152: 453–464 610
Tyree MT, Hammel HT (1972) The measurement of the turgor pressure and the water relations of 611
plants by the pressure bomb technique. J Exp Bot 23: 267–282 612
Tyree MT, Ewers WF (1991) The hydraulic architecture of tree and other woody plants. New 613
Phytol 119: 345–360 614
Vandeleur RK, Mayo G, Shelden MC, Gilliham M, Kaiser BN, Tyerman SD (2009) The role of 615
plasma membrane intrinsic protein aquaporins in water transport through roots: diurnal and 616
drought stress responses reveal different strategies between isohydric and anisohydric cultivars 617
of grapevine. Plant Physiol 149: 445–460 618
Vandeleur RK, Sullivan W, Athman A, Jordans C, Gilliham M, Kaiser BN, Tyerman SD (2014) 619
Rapid shoot-to-root signalling regulates root hydraulic conductance via aquaporins. Plant Cell 620
Environ 37: 520–538 621
Verbeeck H, Steppe K, Nadezhdina N, Op de Beeck M, Deckmyn G, Meiresonne L, Lemeur R, 622
Cermák J, Ceulemans R, Janssens IA (2007) Stored water use and transpiration in Scots pine: a 623
modeling analysis with ANAFORE. Tree Physiol 27: 1671–1685 624
Voicu MC, Cooke JE, Zwiazek JJ (2009) Aquaporin gene expression and apoplastic water flow in 625
bur oak (Quercusmacro- carpa) leaves in relation to the light response of leaf hydraulic 626
conductance. J Exp Bot 60 4063–4075 627
Xu, Y, Johnson CH (2001) A clock-and light-regulated gene that links the circadian oscillator to 628
LHCB gene expression. The Plant Cell 13(6): 1411-1426 629
Zeuthen T, Alsterfjord M, Beitz E, MacAulay N (2103) Osmotic water transport in aquaporins: 630
evidence for a stochastic mechanism. J Physiol 591.20: 5017–5029 631
Captions to figures and tables 633
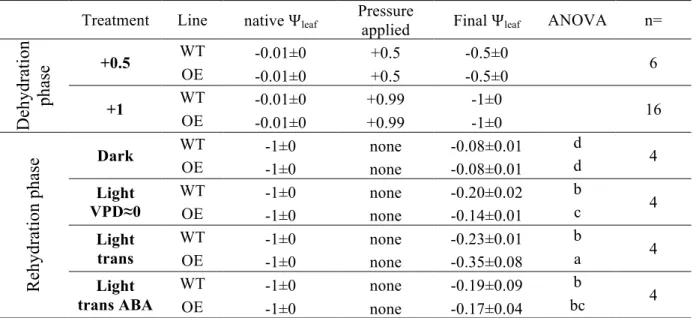
Table 1: leaf water potential (Ѱleaf, MPa) ± SE before and after the pressurisation and rehydration
634
treatments. ANOVA followed by Tukey’s post-hoc test was applied to assess significant differences 635
among lines and treatments in the final Ѱleaf obtained (* = P < 0.05). The experiments concerned
636
two phases: in the first phase, the leaves were pressurised in the pressure chamber and water 637
flowing out from the leaf through the petiole was measured; in the second phase, the pressure was 638
released and water inflow into the leaf was measured by the weight-loss of water in the cylinder. 639
Treatment Line native Ѱleaf Pressure applied Final Ѱleaf ANOVA n=
D ehydra ti on pha se +0.5 WT -0.01±0 +0.5 -0.5±0 6 OE -0.01±0 +0.5 -0.5±0 +1 WT -0.01±0 +0.99 -1±0 16 OE -0.01±0 +0.99 -1±0 Re hydra ti on pha se Dark WT -1±0 none -0.08±0.01 d 4 OE -1±0 none -0.08±0.01 d Light VPD≈0 WT -1±0 none -0.20±0.02 b 4 OE -1±0 none -0.14±0.01 c Light trans WT -1±0 none -0.23±0.01 b 4 OE -1±0 none -0.35±0.08 a Light trans ABA WT -1±0 none -0.19±0.09 b 4 OE -1±0 none -0.17±0.04 bc 640 641
Figure 1: the experimental setup used in this study. Nitrogen gas, regulated through valves and 642
monitored by a manometer, was used to compress the leaf in the pressure chamber. Water flowing 643
out from the petiole increased the weight of the water-filled cylinder (left). Following rehydration 644
(right), the chamber was removed, allowing the rehydration of the previously pressurised leaf. The 645
rehydration was conducted under different stimuli (light, transpiration, ABA). 646
647
648 649
Figure 2: time-course of the cumulative water flow out of leaves in WT leaves (filled symbols) and OE
650
leaves (empty symbols) in the +0.5 experiment. Data were normalised according to the dry weight (circles, 651
left y-axis) or leaf area (triangles, right y-axis). Symbols represent the means ± SE. (n = 6). 652
Figure 3: a) hydraulic resistance (Rh), and b) capacitance (C) in WT leaves (black columns) and 654
OE leaves (grey columns) obtained by pressurising the leaves as described in dehydration phase fo 655
the experimental design: rehydrated leaves pressurised to +0.5 MPa (+0.5) or +1.0 MPa (+1). 656
Columns represent the means (n = 6 for +0.5 and n = 16 for +1.0) ± SE Means were obtained by 657
averaging the measurements performed at different times of day (8:00–10.00; 11:00–13.00; 14:00– 658
16.00). Asterisks mark significant differences between means (* = P < 0.05 ** = P < 0.01). 659
660 661
Figure 4: frame a; time-course of the water flow into the petioles of WT leaves (filled symbols) and 663
OE leaves (empty symbols) in the four recovery treatments: dark (circles), light low transpirative 664
conditions (VPD≈0; triangles), light transpirative conditions (square) and light transpirative 665
conditions in the presence of ABA (rhombus) (n=4). Frame b highlights the first 600 s of the time-666
course (the mean values of of Rh and C are displayed in Fig. 5). 667
668
669 670 671
Figure 5: a) hydraulic resistance (Rh), and b) capacitance (C) in WT (black columns) and OE (grey 672
columns) obtained from the rehydration of leaves after dehydration to Ѱleaf = -1 MPa (+1), as
673
described in the rehydration phase of the experimental design. Recovery treatments were performed 674
in dark, in light low transpirative, light transpirative or light transpirative conditions after adding 675
ABA (final concentration 100 µmol) to the cylinder where the cut petioles were submerged. 676
Columns represent the means (n = 4) ± SE. Different letters mark significant differences (P < 0.05) 677
between means according to ANOVA after data normalisation. In frame b, P < 0.001. 678
679 680
Figure 6: expression of endogenous and transgenic PIP-type AQP genes in WT and OE lines under 682
dark and light transpirative conditions in rehydrated leaves. Relative expression levels of VvPIP1;1, 683
VvPIP2;1, VvPIP2;2, VvPIP2;3, endogenous VvPIP2;4N, and transgenic VvPIP2;4N were 684
determined by qRT-PCR in leaves. The PCR data were normalised with those for UBI transcripts. 685
Data are expressed as the mean ± SE; different letters denote significant differences at P ≤ 0.05. 686
687 688
Figure 7: relationship between Ѱleaf and RWC (a) and Ѱleaf and C (b). Data were obtained from leaves 689
allowed to dehydrate in darkness in the laboratory atmosphere. Filled circles represent the WT leaves; open 690
circles represent OE leaves. Solid and dotted lines correspond to the regression of WT and OE, respectively. 691
692 693 694
Figure 8: schematic representation of the leaf hydraulic pathway. The leaf is divided in several
695
compartments represented by resistors (vascular system, Rv; Bundle sheath cells, BSCs Rb; apoplast, Ra; 696
symplast Rs1 Rs2; and stomata Rst) and capacitors (symplast, Cs1 Cs2). Dashed lines indicate additional 697
parts that can be added to the system. When transpiration is stopped, the system could be simplified by 698
summing the capacitors and the reciprocal resistors (right side). 699
700
Figure S1: time-course of the cumulative water flow out of leaves in WT leaves (filled symbols) and OE
702
leaves (empty symbols) in the +0.5 experiment. Data (corresponding to the ones in Fig. 2) were plotted 703
according to the time of the day when the experiment was performed: morning (8:00–10:00, circles), noon 704
(11:00–13:00, triangles) and afternoon (14:00–16:00, squares). Symbols represent the means ± SE (n = 2). 705
706
707 708 709
Figure S2: relationship between dry weight and leaf area (circles) and fresh weight and leaf area 710
(triangles) in WT (filled symbols) and OE leaves (empty symbols). Regression lines are shown for 711
WT (solid trend line) and OE (dotted trend line). 712
713 714 715
Figure S3: a) hydraulic resistance (Rh), and b) capacitance (C) in WT leaves (black columns) and 716
OE leaves (grey columns) obtained by pressurising the leaves to +0.5 MPa (+0.5). Columns 717
represent the means (n = 2) ± SE. Means were obtained by averaging the measurements performed 718
at different times of day (morning 8:00–10.00; noon 11:00–13.00; afternoon 14:00–16.00 hours). 719
Averages were obtained from the same datasets of Fig. 2 and 3 (only +0.5 treatment) and S1. 720
721 722
Reflection coefficient implication on hydraulic capacitance
723
We provide here the theoretical framework demonstrating the relation between the bulk leaf reflection 724
coefficient s and the bulk leaf capacitance C. The demonstration is based on a reanalyze of the Pressure-725
Volume curve theory (Tyree and Hamel 1972). 726
Whole leaf water potential Y is usually considered as the algebraic sum of the pressure turgor potential P and 727
the osmotic potential P: 728
729
Y=P+P (s1)
730 731
However, this equation is correct only when the reflection coefficient is equal to one. If s less than unity 732 then: 733 734 Y=P+sP (s2) 735 736
When leaf dehydrate, its relative water content (RWC) decreased and the total relative loss of water R is 737 equal to : 738 739 R=1-RWC (s3) 740 741
Assuming a constant apoplasmic water content fraction (af), we can compute the relative water content loss 742
Rs of the symplasmic compartment as: 743
744
Rs=R/(1-af) (s4) 745
746
Rs is equal to 0 when the leaf is fully turgid and equals to 1 when the symplasmic compartment is empty. 747
Leaf capacitance C is defined as: 748
749
C=dRs/dY (s5)
750 751
or, as a proxy, as: 752
753
C=(Rs(Y1) - Rs(Y2)) / ( Y2- Y1) (s6) 754
755
We will focus here on our +0.5 experiment, where Y1 = 0 and Y1 = -0.5MPa 756
757
Defining P0 as the osmotic potential at full leaf turgor and e as the bulk leaf modulus of elasticity, we can 758
express P and P as a function of Rs as: 759 760 P= -s(P0+eRs); P>0 (s7) 761 P= sP0 / (1-Rs) (s8) 762 763
Equations s1, s7 and s8 are used to construct a Höfler diagram (figure s1): 764
765
766 767
Figure S4: Höfler diagram showing the changes in whole leaf water potential (Y), pressure potential (P) and 768
osmotic potential (P) as a function of relative symplasmic water content. The parameters used to construct 769
-3
-2
-1
0
1
2
0
0.1
0.2
0.3
0.4
0.5
Pr
es
su
re
, MP
A
Rs, Rela5ve symplasmic water content
P
Ψ
Π
Turgor loss point Π0 = -1.3 MPa ε = 8 MPa af = 0.25 σ = 1the diagram are shown in the insert. These parameters were obtained on Vitis leaves similar to those used in 770
this study. 771
Combining s1, s7 and s8 we have: 772 773 Y= -s(P0+eRs) + sP0 / (1-Rs) for P>0 (s9) 774 Y= sP0 / (1-Rs) for P=0 (s10) 775 776
By solving equations s9 and s10 we can express Rs as a function of Y as: 777 778 Rs = σ(ε −Π0)-Ψ - (Ψ+σ(Π0−ε))2+4σεΨ 2σε for P>0 (s11) 779 780 Rs = 1- sP0/Y for P=0 (s12) 781 782
Exact solutions of C can then be derived from s11 and s12 using s5 or s6. 783
A proxy of C can also be obtained if we assume that for low Rs values equation s8 can be approximated by: 784
785
P
≈
sP0 (s13)786 787
then, by combining s2, s7 and s13 we have: 788 789 Y
≈
-seRs (s14) 790 791 then it comes: 792 793C
≈
1/se (s15) 794795
The relative change of whole leaf capacitance Crel when the reflection coefficient decreases from 1 to s is: 796
797
Crel
≈ 1/
s (s16)798 799
The relations between Crel derived from s11 and s16 and s are shown in figure s2. The approximation is 800
robust but valid only when Rs is low and s is high (>0.5). 801
Therefore, dividing s by two will double approximately the whole leaf capacitance and this effect is largely 802 independent of e, P0 and Y. 803 804 805 806
Figure S5. Effect of the reflection coefficient s on the relative change in leaf capacitance. The exact relation 807
is shown in green and the approximation given in equation s16 is shown in red. 808