Publisher’s version / Version de l'éditeur:
Chinese Science Bulletin, 58, 16, pp. 1919-1930, 2013-04-03
READ THESE TERMS AND CONDITIONS CAREFULLY BEFORE USING THIS WEBSITE. https://nrc-publications.canada.ca/eng/copyright
Vous avez des questions? Nous pouvons vous aider. Pour communiquer directement avec un auteur, consultez la première page de la revue dans laquelle son article a été publié afin de trouver ses coordonnées. Si vous n’arrivez pas à les repérer, communiquez avec nous à PublicationsArchive-ArchivesPublications@nrc-cnrc.gc.ca.
Questions? Contact the NRC Publications Archive team at
PublicationsArchive-ArchivesPublications@nrc-cnrc.gc.ca. If you wish to email the authors directly, please see the first page of the publication for their contact information.
NRC Publications Archive
Archives des publications du CNRC
This publication could be one of several versions: author’s original, accepted manuscript or the publisher’s version. / La version de cette publication peut être l’une des suivantes : la version prépublication de l’auteur, la version acceptée du manuscrit ou la version de l’éditeur.
For the publisher’s version, please access the DOI link below./ Pour consulter la version de l’éditeur, utilisez le lien DOI ci-dessous.
https://doi.org/10.1007/s11434-013-5726-1
Access and use of this website and the material on it are subject to the Terms and Conditions set forth at
High-quality reference genes for quantifying the transcriptional
responses of Oryza sativa L. (ssp. indica and japonica) to abiotic stress
conditions
Maksup, Sarunyaporn; Supaibulwatana, Kanyaratt; Selvaraj, Gopalan
https://publications-cnrc.canada.ca/fra/droits
L’accès à ce site Web et l’utilisation de son contenu sont assujettis aux conditions présentées dans le site LISEZ CES CONDITIONS ATTENTIVEMENT AVANT D’UTILISER CE SITE WEB.
NRC Publications Record / Notice d'Archives des publications de CNRC:
https://nrc-publications.canada.ca/eng/view/object/?id=24c47b36-e930-440b-aaa5-7cc02f193498 https://publications-cnrc.canada.ca/fra/voir/objet/?id=24c47b36-e930-440b-aaa5-7cc02f193498
© The Author(s) 2013. This article is published with open access at Springerlink.com csb.scichina.com www.springer.com/scp
*Corresponding authors (email: Kanyaratt.sup@mahidol.ac.th; gopalan.selvaraj@nrc-cnrc.gc.ca)
Article
Agricultural Sciences doi: 10.1007/s11434-013-5726-1
High-quality reference genes for quantifying the transcriptional
responses of Oryza sativa L. (ssp. indica and japonica)
to abiotic stress conditions
MAKSUP Sarunyaporn
1, SUPAIBULWATANA Kanyaratt
1*& SELVARAJ Gopalan
2*1 Department of Biotechnology, Faculty of Science, Mahidol University, Bangkok 10400, Thailand;
2 Plant Biotechnology Institute, National Research Council of Canada, 110 Gymnasium Place Saskatoon, SK S7N 0W9, Canada
Received September 26, 2012; accepted December 10, 2012
Rice (Oryza sativa L.) is important to food security andis also an excellent model plant for numerous cereal crops. A functional genomics study in rice includes characterization of the expression dynamics of genes by quantitative real-time PCR (qPCR) anal-ysis; this is a significant key for developing rice varieties that perform well in the face of adverse climate change. The qPCR analysis requires the use of appropriate reference genes in order to make any quantitative interpretations meaningful. Here, the new potential reference genes were selected from a huge public database of rice microarray experiments. The expression stability of 14 candidates and 4 conventional reference genes was validated by geNormPLUS and NormFinder software. Seven candidates are superior to the conventionally used reference genes in qPCR and three genes can be used reliably for quantitating the expres-sion of genes involved in abiotic stress responses. These high-quality references EP (LOC_Os05g08980), HNR (LOC_Os01g71770), and TBC (LOC_Os09g34040) worked very well in three indica genotypes and one japonica genotype. One of indica genotypes including the Jasmine rice, KDML105 developed in Thailand for which no reference genes have been report-ed until now.
KDML105, microarrays, quantitative real-time PCR, reference gene, rice (Oryza sativa L.), stress responsive gene
Citation: Maksup S, Supaibulwatana K, Selvaraj G. High-quality reference genes for quantifying the transcriptional responses of Oryza sativa L. (ssp. indica and japonica) to abiotic stress conditions. Chin Sci Bull, doi: 10.1007/s11434-013-5726-1
Rice (Oryza sativa L.) is an ancient crop domesticated ca. 9000 years ago and plays its significant roles as a staple food that feeds almost half of the human population. The two major subspecies, indica and japonica, are believed to have diverged several thousand years before domestication. As a cereal, it is also a model plant that contributes to our understanding of the other major monocot crops like wheat and corn. Together these three crops constitute the bulk of the caloric supply to much of the world population. Climate change will have an adverse impact on food production and several options need to be considered in dealing with the risks [1]. Given the impact on rice productivity, under-standing how rice copes with abiotic stresses and devising
strategies for developing rice varieties that are capable of better yield under stress conditions is critical for ensuring food security. Functional genomic analyses of stress re-sponses provide information crucial to this process [2–4]. While microarrays and RNASeq are suitable for large-scale expression analysis, quantitative real time PCR (qPCR) re-mains the method of choice for measuring expression of selected gene with higher precision. qPCR analysis is used as either the primary assay or for validation of high- throughput expression analyses of microarray hybridization, it requires reference genes against which genes of interest are compared. However, as pointed out by Guenin et al. [5], many qPCR analyses have been done without using suitable
reference gene(s) for normalization.
Reference genes generally are comprised of the so-called housekeeping genes whose expression is considered to be the least variant under different developmental and envi-ronmental conditions [6]. However, the use of different ref-erence genes can lead to inconsistent interpretation [5]. There are no universal reference genes whose expression is invariant under all conditions [7]. In addition to the need for consistent expression of the reference gene under different conditions, the expression levels of these genes must also be in the same range as the target genes under investigation. Therefore, the identification of new reference genes that do not have the pitfalls of conventional reference genes is nec-essary in order to make any quantitative interpretations meaningful [8–11].
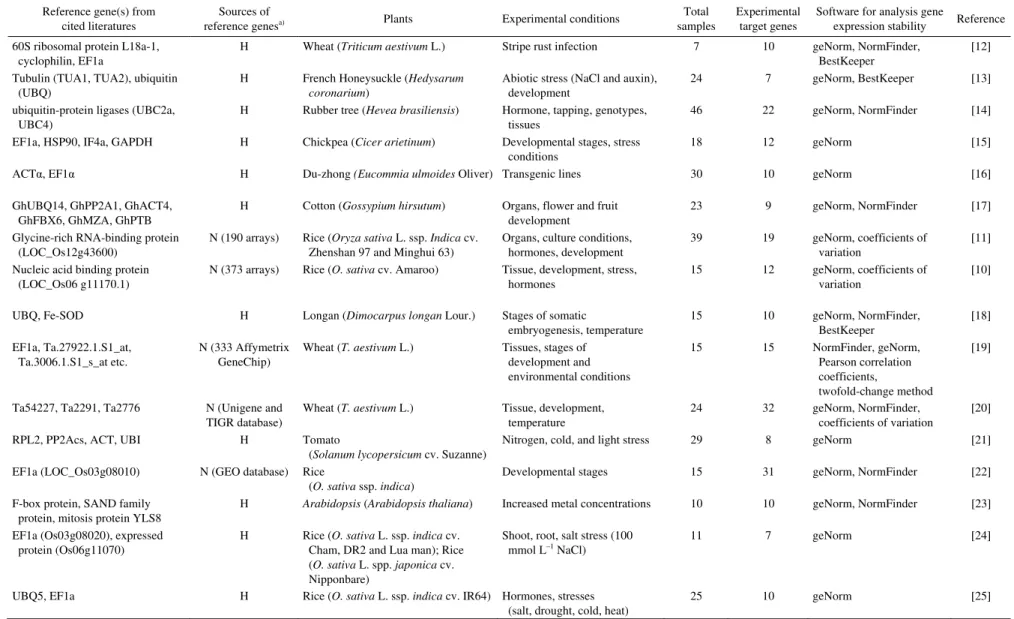
The reference genes used in qPCR are made up of genes derived from two sources (Table 1): (i) genes selected from conventionally designated housekeeping genes or their homologs [12,15,25], and (2) new candidate genes found by the analysis of transcriptomic data for constitutively ex-pressed genes across various experimental conditions [10,11,19,20,22]. Expression stability of these genes is measured by programs such as NormFinder, BestKeeper, or geNorm [6,26,27]. The transcriptomic data-based method has the advantage of identifying novel candidate reference genes that are more stable than the conventional ones. Val-idation of reference genes for qPCR has been reported in many plant species; for example, GAPDH in sugarcane and chickpea [15,28]; EF1a in potato, Arabidopsis, and rice [22,23,25,29]; RPL2, PP2Acs, ACT and UBI in tomato [21]; and SKIP16, UKN1 and UKN2 in soybean [9] (Table 1). In rice, UBQ5 and EF1a were found to be the most stable across 25 rice samples which were derived from different tissues at various developmental stages [22,25]. However, Wang and co-workers reported that the glycine-rich RNA-binding protein gene (GBP) was the most stable gene throughout the growth cycle of rice [11]. The reference genes used in various rice cultivars are compiled in Table 1. The most commonly used gene in the literature is EF1a (Table 1).
The two major subspecies of rice, indica and japonica, are believed to have diverged several thousand years before domestication. Having reference genes that perform well in both subspecies is an ideal for rice functional genomics study under the environmental stresses. In this study, we aim to validate reference genes which stable expressed in the samples that differ in stress tolerant ability as well as broadly usable in both indica and japonica rice. We also target to validate reference genes in KDML105 or so called “Thai Jasmine rice” which has been classified as the high- end traits among the exported traits. Thus, drought tolerant (indica rice ‘NSG19’ and ‘KDML105’) and drought sensi-tive (indica rice ‘IR20’ and japonica rice ‘Taipei 309’) cul-tivars grown under different stress conditions were used as plant materials. We found new references from the analysis
of a much larger data set obtained from 936 microarrays. The three genes discovered in this study outperformed the conventional housekeeping genes as references and these genes were able to be used effectively as the sole reference in both japonica and indica rice types subjected to abiotic stresses. This study is the first to validate reference genes in Thai Jasmine rice.
1 Materials and methods
1.1 Plant materials and stress treatments
Oryza sativa L. ssp. japonica cv. Taipei 309 and O. sativa L. ssp. indica cv. KDML105, NSG19 and IR20 were studied. Stress treatment of the japonica type was as follows. Seeds were germinated in pots containing wet soil in a growth room (20°C day/16°C night, with 16 h day lengths). Three-week old seedlings were transferred to different stress conditions. Leaf tissues of rice samples grown under 4 different conditions i.e. no treatment (control), air-dried for 5 h (drought), treated with 200 mmol L–1 NaCl solution for 24 h (salt stress), and incubated at 4°C for 24 h (cold stress) were used for qPCR and expression stability analysis. For determining the expressions of SalT (15-kD mannose- binding lectin protein) and/or TPP1 (trehalose-6-phosphate phosphatase) genes, leaf tissues of rice samples grown un-der drought, salt, and cold stress for 0, 5, and 10 h were harvested. In the case of the indica type, seeds were germi-nated on wet tissue paper and seedlings were hydroponical-ly grown in Yoshida nutrient solution [30] in a growth chamber (60% ± 5% relative humidity, 25 ± 2°C day and night, at 16 h day). Polyethylene glycol (PEG)-induced os-motic stress treatment was applied to the two-week old seedlings by transferring them into a growth media solution containing 22% (w/v) PEG6000 (about –0.5 MPa). Samples were harvested at 0, 1, 3, and 9 h after stress.
1.2 RNA and cDNA protocols
An RNeasy Plant Mini Kit (Qiagen) was used for preparing total RNA according to the manufacturer’s protocol and the concentrations were measured using a NanoDrop ND-8000 spectrophotometer (NanoDrop Technology). RNA samples with A260 nm/A280 nm > 1.9 were used and their integrity was
determined by gel electrophoresis on a 1% agarose gel. Any residual contaminating DNA was removed using an Ambi-on TURBO DNA-free™ Kit (Applied Biosystem), and 2 µg of RNA was used for cDNA synthesis using an Affin-ityScript qPCR cDNA Synthesis Kit (Agilent Technologies). Additionally, cDNA of the 3 indica cultivars were obtained from Plant Biotechnology Laboratory, Department of Bio-technology, Mahidol University, Thailand and the cDNA were prepared as described by ref. [31]. The concentrations of all cDNA samples were measured using a NanoDrop ND- 8000 spectrophotometer and adjusted to equal concentrations
Mak sup S , et a l. Chin Sc i B u ll Janu ary (2 01 3) Vol .5 8 No.1 3
Table 1 Reference genes that have been used in qPCR analysis of gene expression
Reference gene(s) from cited literatures
Sources of
reference genesa) Plants Experimental conditions
Total samples
Experimental target genes
Software for analysis gene
expression stability Reference 60S ribosomal protein L18a-1,
cyclophilin, EF1a
H Wheat (Triticum aestivum L.) Stripe rust infection 7 10 geNorm, NormFinder, BestKeeper
[12]
Tubulin (TUA1, TUA2), ubiquitin (UBQ)
H French Honeysuckle (Hedysarum
coronarium)
Abiotic stress (NaCl and auxin), development
24 7 geNorm, BestKeeper [13]
ubiquitin-protein ligases (UBC2a, UBC4)
H Rubber tree (Hevea brasiliensis) Hormone, tapping, genotypes, tissues
46 22 geNorm, NormFinder [14]
EF1a, HSP90, IF4a, GAPDH H Chickpea (Cicer arietinum) Developmental stages, stress conditions
18 12 geNorm [15]
ACTα, EF1α H Du-zhong (Eucommia ulmoides Oliver) Transgenic lines 30 10 geNorm [16]
GhUBQ14, GhPP2A1, GhACT4, GhFBX6, GhMZA, GhPTB
H Cotton (Gossypium hirsutum) Organs, flower and fruit development
23 9 geNorm, NormFinder [17]
Glycine-rich RNA-binding protein (LOC_Os12g43600)
N (190 arrays) Rice (Oryza sativa L. ssp. Indica cv. Zhenshan 97 and Minghui 63)
Organs, culture conditions, hormones, development
39 19 geNorm, coefficients of variation
[11]
Nucleic acid binding protein (LOC_Os06 g11170.1)
N (373 arrays) Rice (O. sativa cv. Amaroo) Tissue, development, stress, hormones
15 12 geNorm, coefficients of variation
[10]
UBQ, Fe-SOD H Longan (Dimocarpus longan Lour.) Stages of somatic embryogenesis, temperature 15 10 geNorm, NormFinder, BestKeeper [18] EF1a, Ta.27922.1.S1_at, Ta.3006.1.S1_s_at etc. N (333 Affymetrix GeneChip)
Wheat (T. aestivum L.) Tissues, stages of development and environmental conditions 15 15 NormFinder, geNorm, Pearson correlation coefficients, twofold-change method [19]
Ta54227, Ta2291, Ta2776 N (Unigene and TIGR database)
Wheat (T. aestivum L.) Tissue, development, temperature
24 32 geNorm, NormFinder,
coefficients of variation
[20]
RPL2, PP2Acs, ACT, UBI H Tomato
(Solanum lycopersicum cv. Suzanne)
Nitrogen, cold, and light stress 29 8 geNorm [21]
EF1a (LOC_Os03g08010) N (GEO database) Rice
(O. sativa ssp. indica)
Developmental stages 15 31 geNorm, NormFinder [22]
F-box protein, SAND family protein, mitosis protein YLS8
H Arabidopsis (Arabidopsis thaliana) Increased metal concentrations 10 10 geNorm, NormFinder [23]
EF1a (Os03g08020), expressed protein (Os06g11070)
H Rice (O. sativa L. ssp. indica cv. Cham, DR2 and Lua man); Rice (O. sativa L. spp. japonica cv. Nipponbare)
Shoot, root, salt stress (100 mmol L–1 NaCl)
11 7 geNorm [24]
UBQ5, EF1a H Rice (O. sativa L. ssp. indica cv. IR64) Hormones, stresses (salt, drought, cold, heat)
25 10 geNorm [25]
a) “H” refers to housekeeping genes used on the basis of their function from publications on the same species as the subject of investigation or other plant species. “N” means the reference genes were se-lected on the basis of transcriptomics data.
prior to qPCR analysis.
1.3 Selection of reference genes
The potential reference genes were selected from a public database of rice microarray experiments. The huge micro-array data including the expressions of rice genes under all kinds of stressed conditions were mined using Genevesti-gator (https://www.genevestiGenevesti-gator.com/gv/) in order to find the constitutively expressed genes. The microarray data (Array type: OS_51K: Rice Genome 51K array) derived from the Gene Expression Omnibus (765 arrays), ArrayEx-press (160 arrays), and PLEXdb (11 arrays) were used in the biomarker search module. The description of the candi-date genes was identified according to the RICECHIP.ORG (http://www.ricechip.org/) and the Rice Genome Annotation Project (http://rice.plantbiology.msu.edu/analyses_search_ locus.shtml). Data accession of all analyses was performed in regards to the information presented in web site in June 2011.
1.4 Primer design and quantitative real-time PCR (qPCR) analysis
All primers, except those for EF1a and UBQ5, were de-signed using Primer3 Input (version 0.4.0; http://frodo. wi.mit.edu/primer3/); EF1a and UBQ5 primer sequences were as described in [25] (Table 2). The primers were de-signed to span introns. We dede-signed the primers for use in both indica and japonica types. Only those primers that gave a clear single band after 35 cycles of PCR at an an-nealing temperature of 60°C were retained. Pooled cDNA samples from 3 biological replicates were used as templates in determining the expression stability of the candidates. qPCR was performed in 96-well plates with a StepOnePlus™ Real-Time PCR System (Applied Biosys-tems) and analyzed with StepOne Software v2.2. SYBR® GreenER™ qPCR SuperMix for ABI PRISM® (Invitrogen) was used according to the manufacturer’s protocol (4 repli-cates). The PCR conditions were: 95°C for 10 min; 45 cy-cles of 95°C for 15 s, and 60°C for 45 s which was followed by melting curve analysis to determine the specificity of the amplification. The 10 most stable genes were further se-lected to define the stability of expression in 15 cDNA samples (Table S1). The most stable gene in this set was selected for use in the quantitation of the expression level of stress responsive target genes including: corona-tine-insensitive 1 (COI), TPP1, SalT, and putative H-protein promoter binding factor-2a (Hp2a). Quantitative analysis was performed according to the 2−∆∆Ct method [32].
1.5 Expression stability of reference genes
The qbasePLUS software (Version 2.1 (20110607-1430)) based on the widely used geNorm [27] and qBase [33]
software called geNormPLUS was used to analyze the expres-sion stability of the selected reference genes. The most sta-ble control genes and the optimum number of control genes for normalization were determined by the gene expression stability (M) and pairwise variation (V) values. Moreover, the stability values of the selected references were deter-mined by NormFinder software version 0.953 (http://www. mdl.dk/publicationsnormfinder.htm) as described by ref. [6].
2 Results
2.1 Data mining and functional testing reveals 14 can-didate genes that are potentially superior to the 4 con-ventionally used reference genes in qPCR
Microarray hybridization experiments available in the pub-lic domain collectively provide rich and diverse data on gene expression. We mined the data from a collection of 936 microarray experiments as outlined in the methods sec-tion to arrive initially at 25 genes that were considered to be constitutively expressed (Figure S1). Using Genvestigator, we determined which genes among this set of genes had expression levels within the range of our target gene of in-terest. This was necessary because such genes would be more appropriate as quantitative references. Our target gene,
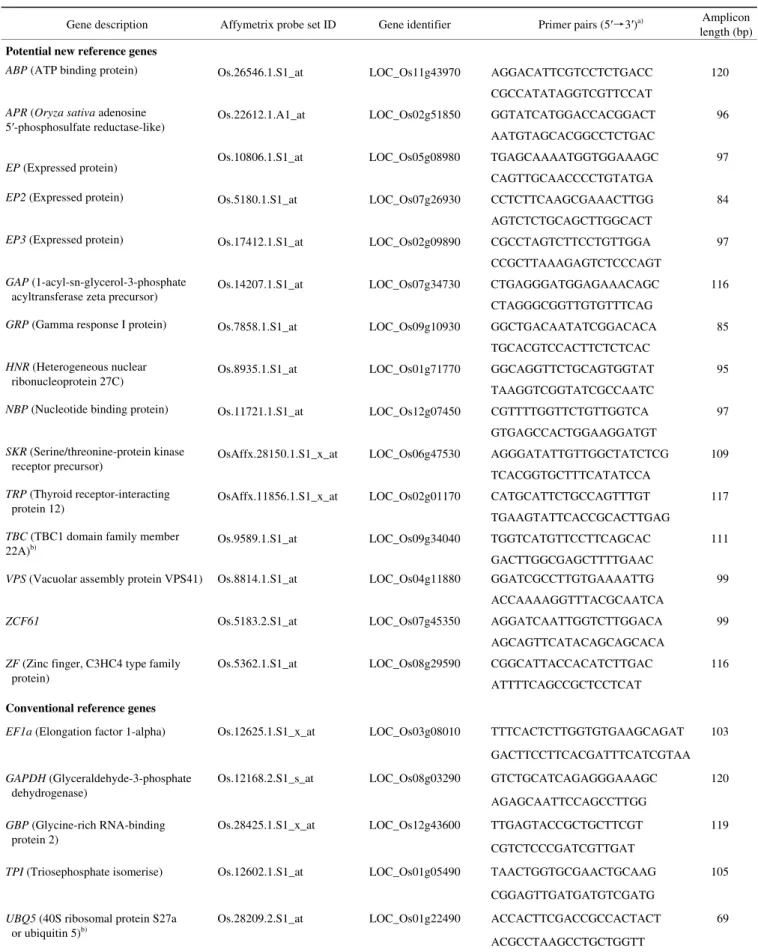
Hp2a was found to have a medium level of expression ac-cording to the signal intensity on the Affymetrix OS_51K: Rice Genome 51K array (Figure S1; low: 0–10; medium: 11–14; high: >14). Fifteen of the 25 genes were found to have a medium level of expression. The PCR primers de-signed for these 15 genes and the 5 conventionally used genes spanned an intron in order to control for any contam-ination due to genomic DNA in the RNA samples (Table 2). The primers were designed such that they would be usable with both indica and japonica rice types. Among the primer pairs for each of the 20 genes, 18 primer pairs gave a clean, single band in RT-PCR reactions. Of these 18 primer pairs, 14 were specific to the new reference genes that we have identified from the microarray data analysis (data not shown) and that have not yet been reported in the literature.
The overall variability and the expression levels of 18 candidate reference genes were initially determined by conducting qPCR analysis of 4 RNA samples from control plants and stressed plants of the japonica type cultivar Tai-pei 309. The RNA samples were prepared from leaf tissues of rice samples grown under control (no treatment), drought stress (air-dried for 5 h), salt stress (200 mmol L–1 NaCl solution for 24 h), and cold stress (4°C for 24 h) conditions. We pooled 3 biological replicates of each condition and performed 4 technical replications for each pool, thus the experiment presented in Figure 1 evaluates only the stability of expression between treatment/condition. The threshold cycle values (Ct) thus obtained ranged from 17 to 30 for the
Maksup S, et al. Chin Sci Bull January (2013) Vol.58 No.1 5 Table 2 Candidate reference genes investigated in this study
Gene description Affymetrix probe set ID Gene identifier Primer pairs (5′→3′)a) Amplicon length (bp)
Potential new reference genes
ABP (ATP binding protein) Os.26546.1.S1_at LOC_Os11g43970 AGGACATTCGTCCTCTGACC 120
CGCCATATAGGTCGTTCCAT
APR (Oryza sativa adenosine 5′-phosphosulfate reductase-like)
Os.22612.1.A1_at LOC_Os02g51850 GGTATCATGGACCACGGACT 96
AATGTAGCACGGCCTCTGAC
EP (Expressed protein) Os.10806.1.S1_at LOC_Os05g08980 TGAGCAAAATGGTGGAAAGC 97
CAGTTGCAACCCCTGTATGA
EP2 (Expressed protein) Os.5180.1.S1_at LOC_Os07g26930 CCTCTTCAAGCGAAACTTGG 84
AGTCTCTGCAGCTTGGCACT
EP3 (Expressed protein) Os.17412.1.S1_at LOC_Os02g09890 CGCCTAGTCTTCCTGTTGGA 97
CCGCTTAAAGAGTCTCCCAGT
GAP (1-acyl-sn-glycerol-3-phosphate acyltransferase zeta precursor)
Os.14207.1.S1_at LOC_Os07g34730 CTGAGGGATGGAGAAACAGC 116
CTAGGGCGGTTGTGTTTCAG
GRP (Gamma response I protein) Os.7858.1.S1_at LOC_Os09g10930 GGCTGACAATATCGGACACA 85
TGCACGTCCACTTCTCTCAC
HNR (Heterogeneous nuclear ribonucleoprotein 27C)
Os.8935.1.S1_at LOC_Os01g71770 GGCAGGTTCTGCAGTGGTAT 95
TAAGGTCGGTATCGCCAATC
NBP (Nucleotide binding protein) Os.11721.1.S1_at LOC_Os12g07450 CGTTTTGGTTCTGTTGGTCA 97
GTGAGCCACTGGAAGGATGT
SKR (Serine/threonine-protein kinase receptor precursor)
OsAffx.28150.1.S1_x_at LOC_Os06g47530 AGGGATATTGTTGGCTATCTCG 109
TCACGGTGCTTTCATATCCA
TRP (Thyroid receptor-interacting protein 12)
OsAffx.11856.1.S1_x_at LOC_Os02g01170 CATGCATTCTGCCAGTTTGT 117
TGAAGTATTCACCGCACTTGAG
TBC (TBC1 domain family member
22A)b) Os.9589.1.S1_at LOC_Os09g34040 TGGTCATGTTCCTTCAGCAC 111
GACTTGGCGAGCTTTTGAAC
VPS (Vacuolar assembly protein VPS41) Os.8814.1.S1_at LOC_Os04g11880 GGATCGCCTTGTGAAAATTG 99
ACCAAAAGGTTTACGCAATCA
ZCF61 Os.5183.2.S1_at LOC_Os07g45350 AGGATCAATTGGTCTTGGACA 99
AGCAGTTCATACAGCAGCACA
ZF (Zinc finger, C3HC4 type family protein)
Os.5362.1.S1_at LOC_Os08g29590 CGGCATTACCACATCTTGAC 116
ATTTTCAGCCGCTCCTCAT
Conventional reference genes
EF1a (Elongation factor 1-alpha) Os.12625.1.S1_x_at LOC_Os03g08010 TTTCACTCTTGGTGTGAAGCAGAT 103
GACTTCCTTCACGATTTCATCGTAA
GAPDH (Glyceraldehyde-3-phosphate dehydrogenase)
Os.12168.2.S1_s_at LOC_Os08g03290 GTCTGCATCAGAGGGAAAGC 120
AGAGCAATTCCAGCCTTGG
GBP (Glycine-rich RNA-binding protein 2)
Os.28425.1.S1_x_at LOC_Os12g43600 TTGAGTACCGCTGCTTCGT 119
CGTCTCCCGATCGTTGAT
TPI (Triosephosphate isomerise) Os.12602.1.S1_at LOC_Os01g05490 TAACTGGTGCGAACTGCAAG 105
CGGAGTTGATGATGTCGATG
UBQ5 (40S ribosomal protein S27a or ubiquitin 5)b)
Os.28209.2.S1_at LOC_Os01g22490 ACCACTTCGACCGCCACTACT 69
ACGCCTAAGCCTGCTGGTT
a) Primer sequences showed 100% complementary to Oryza sativa indica (taxid: 39946) and Oryza sativa japonica (taxid: 39947) group; b) the only 2 genes which primer pairs did not span an intron.
18 genes are summarized in Figure 1. Among the 4 conven-tionally used reference genes tested here, three genes (UBQ5, TPI, and GAPDH) showed high levels of expres-sion, whereas EF1a showed a lower level of expression. All other 14 putative reference genes that we had selected showed lower levels of expression than UBQ5, TPI, and
GAPDH. There were variations in the expression levels of some of the genes. EF1a, GAPDH, and GAP showed the maximum variation. Notably, GAPDH had the most outly-ing data points. However, there were genes that had Ct val-ues less than or equal to 2 cycles (UBQ5, TPI, ABP, HNR,
TRP, NBP, ZCF61, TBC, EP, and SKR). These data, taken together, indicated that 3 of the 4 conventional genes had expression levels that were too high. Furthermore, one of these genes (GAPDH) was also likely too unstable in pression for use as a control. EF1a, although lower in ex-pression and therefore more appropriate for our target gene, was also likely too unstable in expression.
2.2 Use of diverse genotypes, as well as variation of developmental and environmental conditions identifies 3 high-quality references for broader use
Analysis of the expression variation in the compiled data for control plants and plants subjected to the three stress condi-tions indicated that some, but not all of the 14 genes we had selected would be useful as references, and that these genes should be investigated in depth for their stability. Hence the expressions of genes shown in Figure 1 were further ana-lyzed by geNormPLUS and NormFinder software to deter-mine the expression stability. The M value is a measure
Figure 1 Expression levels of candidate reference genes in the leaves of
the japonica Taipei 309 line under drought, salt, and cold stress (4 tech-nical replications). The variability of the Ct values of each reference gene is shown in box-plot graphs. The upper box (white) and the lower box (gray) indicate the first and third quartile, whisker caps indicate the maximum and minimum values, the middle line marks the median, and the crosses () mark the outliers. Only the stability of expression between treat-ment/condition was evaluated. * indicates the new reference genes.
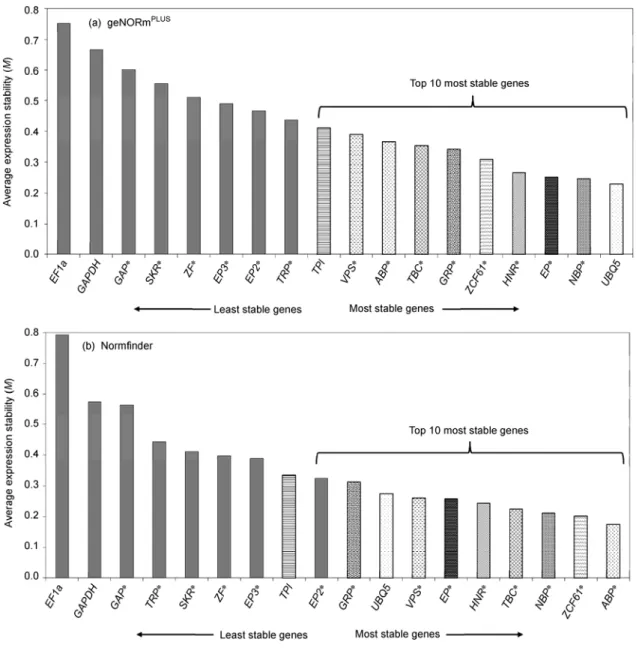
of stability, with lower M values indicating greater stability of the gene [27]. Seven of the 14 candidate reference genes were found to be more stable than the 4 conventional refer-ences in the NormFinder analysis (Figure 2(b)). The expres-sion of ABP (0.175) was most stable in contrast to the two conventional references EF1a (0.793) and GAPDH (0.574). In geNormPLUS analysis, EF1a (0.751) and GAPDH (0.667) were also the least stable for expression under abi-otic stress (Figure 2(a)). Although the two programs differ in their algorithm for ranking expression stability, both identified the same 9 genes within a list of the most stable genes.
The top 10 genes found based on geNormPLUS software were selected for defining the gene expression stability in plants subjected to salt-, cold-, or PEG-induced osmotic stress in comparison to control plants. The source plants included one japonica type and three indica types, and the tissues were comprised of young leaf, leaf sheath, mature leaf, and root (Table S1). The expression stability of the potential reference genes in these genotypically different plants under diverse developmental states and conditions of growth was determined by geNormPLUS analysis (Figure 3). geNormPLUS considers genes with M < 1.5 as suitable for reference. If we took into consideration the entire genetic, developmental, and environmental diversity, the top 3 most stable genes would be EP (0.339), HNR (0.355), and TBC (0.369) in the indicated order (Figure 3(a)). However, for a more restricted analysis in terms of genotypic differences or experimental conditions, it is possible that other references might be more suitable. This was also examined. As shown in Figure 3(b), EP and HNR were among the best references (M < 0.277 for EP and < 0.207 for HNR) for various geno-types within the Indica type and for all developmental or environmental conditions tested for both indica and
japoni-ca sub-species. Even though ZCF61, TPI, and GRP fared better for the japonica type (for all conditions) and EP,
HNR and TBC were better for the indica type (for all condi-tions), the M value of EP, HNR, and TBC for the japonica group of experiments were only marginally higher (Figure 3(b)) and we considered this negligible. Thus, we conclude that EP, HNR, and TBC would serve very well as controls for both the japonica and indica types of rice.
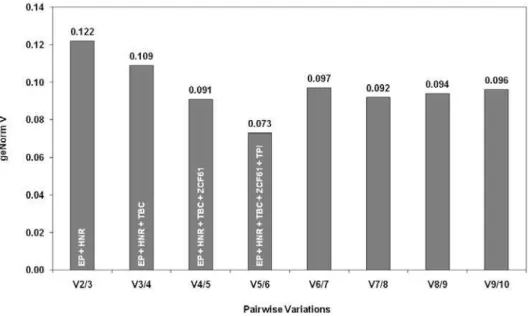
The impact, if any, of including additional reference genes for normalization was investigated by pairwise analy-sis (Figure S2). According to the geNorm handbook (http:// www.rodelab.com/index_archivos/Primer_Design/Housekee ping_genes/geNorm_SYBRgreen_handbook.pdf), a V-value < 0.15 is the recommended cutoff for the optimal number of reference genes. In this analysis, the two most stable genes (EP and HNR) yielded a V-value of 0.122 (Figure S2), indi-cating that use of one or both of these would be sufficient for generating high quality data. Inclusion of the third, fourth, and fifth genes improved the quality even further; however, exceeding five genes did not offer any improve-ments (Figure S2).
Maksup S, et al. Chin Sci Bull January (2013) Vol.58 No.1 7
Figure 2 Expression stability of 18 candidate reference genes calculated by geNormPLUS (a) and NormFinder (b) in leaf samples of the Taipei 309 japonica rice line under drought, salt, and cold stress (4 technical replications). A lower value of average expression stability. M, indicates more stable expression.
EF1a, GAPDH, TPI, and UBQ5 are conventional housekeeping genes and * indicates the new reference genes. Only the stability of expression between treatment/condition was evaluated.
2.3 Conventional reference, EF1a, distort the inter-preted expression dynamics of the SalT gene
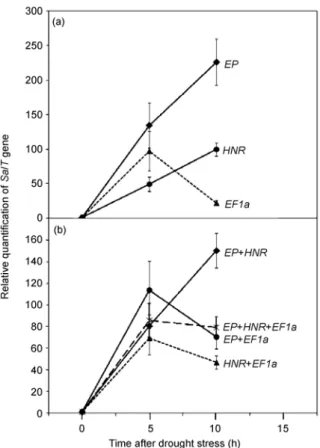
SalT is a rice gene that is induced by osmotic stress [34]. We used this gene as a test gene in order to assess the utility of the reference genes in assaying gene expression. The expression of the SalT gene in leaf tissue from Taipei 309 cultivar under drought stress was normalized with the EP,
HNR and EF1a genes (Figure 4). Descriptive statistics and expression variation of EP, HNR, and EF1a genes in the 3 biological replicates were determined (Figure S4). Accord-ing to Figure 2(a), EP, HNR and EF1a have M values of 0.252, 0.266, and 0.751, respectively. Normalization with the EP gene gave a high level of induction of SalT
expres-sion occurring over a10-h duration of drought stress (Figure 4(a)). The use of HNR for normalization also resulted in a qualitatively similar expression pattern of SalT under drought conditions, but gave a lower level of induction, particularly at 10 h. Notably, normalization with EF1a (highest M value) gave a peak of expression at 5 h and showed very little induction at 10 h unlike what was ob-served with normalization with EP or HNR (Figure 4(a)). Inclusion of EF1a as a reference, along with EP and/or
HNR also distorted the value of the fold increase in SalT expression over the course of the stress treatment, high-lighting the pitfalls of using inappropriate reference genes either alone or in combination with better controls (Figure 4(b)).
Figure 3 Expression stability of 10 selected reference genes calculated
by geNormPLUS in 15 samples based on qPCR data. “All tested samples” includes the data set from all 15 samples (Table S1); “Various tissues” includes mature leaves, young leaves, leaf sheaths, and roots; Where “cul-tivars” are indicated, leaf sheath samples were used; “Various drought” denotes leaf sheath samples of KDML105 at 0, 1, 3, and 9 h after PEG- induced osmotic stress (–0.5 MPa). A lower value of average expression stability, M, indicates more stable expression. M values less than 1.5 indi-cate that the candidate genes can be used as suitable reference genes for the selected experiments. * indicates the new reference genes. Only the stabil-ity of expression between treatment/condition was evaluated.
Figure 4 Quantitation of SalT gene expression in the leaves of japonica
rice Taipei 309, normalized with the indicated references alone (a) or in combination (b). Drought stress was imposed for 0, 5, and 10 h by air-drying of seedlings at room temperature. EP, HNR, and EF1a have M values of 0.252, 0.266, and 0.751 according to Figure 2a. Bars represent the standard deviation of 3 biological replicates (2 technical replicates).
2.4 qPCR with EP as the reference reveals different expression patterns of stress responsive genes among rice cultivars
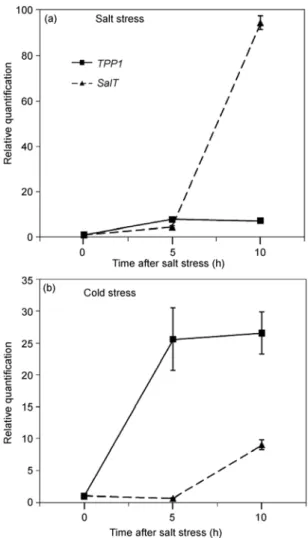
TPP1 encodes a key enzyme for the biosynthesis of treha-lose [35], which accumulates under cold stress [36,37]. The expression pattern of TPP1 and SalT in the leaf tissue of
japonica type Taipei 309 rice plants that were subjected to increased salinity and cold conditions was determined. The top-ranking reference, EP, was used as the reference. It was clear that TPP1 expression was induced earlier and to a higher level by cold conditions, whereas SalT expression was inducible by salinity stress to a much greater extent than by cold (Figure 5). These results agree with the expres-sion behavior of the two genes reported in the literature [35,38]. For testing the use of EP in indica type rice, we used the IR20 and NSG19 cultivars and the jasmine rice cultivar KDML105. In addition to TPP1 and SalT, we tested the expression levels of COI and Hp2a under PEG-induced osmotic stress (–0.5 MPa). COI functions in jasmonate sig-naling, defense responses, and stomatal movement [39,40]. Hp2a, a plant-specific transcription factor that is considered to function in diverse biological processes [41], is known to be induced by cold stress in Arabidopsis [42]. Interestingly,
Maksup S, et al. Chin Sci Bull January (2013) Vol.58 No.1 9
Figure 5 Relative quantification of TPP1 and SalT genes using EP, the
top-ranking reference. The expression levels were determined in the leaf tissue of Taipei 309 after salt (a) and cold stress (b) for 5 and 10 h. Bars represent standard deviation of 3 biological replicates (2 technical repli-cates).
SalT was most dramatically upregulated in the KDML105 and NSG19 cultivars but not in IR20 (Figure 6(b)). Unlike NSG19 and KDML105, IR20 is sensitive to drought and salinity, and the enhanced SalT expression levels in the tol-erant lines may explain the observed difference in pheno-type. Although the expressions of TPP1, COI, and Hp2a showed no obviously changes under drought stress, the dif-ferences in expression over a 9-h period were observed in the three indica cultivars. These results illustrate the use-fulness of the EP reference gene in molecular profiling of selected genes in diverse cultivars.
3 Discussion and conclusions
Quantification of gene expression requires the use of ap-propriate reference genes and such references have been developed for some plant species [9,22,25,43–46]. For rice, a number of genes have been used. These include genes that
are conventionally considered to be housekeeping genes [24,25] and genes identified from microarray data [10,11,22]. It is clearly that EP and HNR have a better per-formance as a good reference gene(s) in comparison with
EF1a [22] (Figures 2 and 4). These two genes also outper-form the glycine-rich RNA-binding protein (GBP) [11] since we could not get a clear single band of its PCR prod-uct (data not shown). The largest dataset used so far consists of 373 arrays [10]. In our study, we mined a much larger dataset consisting of 936 arrays thus the reference genes in this study could be broadly used in more diverse rice sam-ples. The use of microarray data in all these studies has shown that generally, genes other than the traditionally used housekeeping genes are more stable and useful. Validation of reference gene using the whole or a subset of all arrays from databases increases the reliability of the results and this is applicable to any similar researches in gene expres-sion analysis.
There are two widely used analysis software for ranking the stability of reference genes: geNorm [27] and NormFinder [6]. A good control gene needs to have stable expression across various internal (e.g. developmental) and external (e.g. environmental factors) conditions. Determing whether the expression of a given candidate gene is in-deed stable requires comparison with gene(s) that are known to be stable. This circular problem is addressed in programs designed to evaluate candidate genes: geNorm uses pairwise comparison of the candidate gene with known control genes in order to find the genes with the least varia-tion in the expression (denoted as M value), under various experimental conditions is considered to indicate stability. NormFinder does not use pairwise comparison. Instead, it utilizes a mathematical modeling approach to describe the expression values of the genes and performs statistical analyses of intra- and inter-group variations in order to ar-rive at the stability value for a potential control gene. Be-cause of the differences in the algorithms, the ranking of candidates in these two programs can be different [17,18,20]. Here, we used a modified version of geNorm called “geNormPLUS” which has more effective analysis than the old version [27,33] and it allows ranking of candidate references up to the single most stable gene. Notably, de-spite the differences in their algorithms, both geNormPLUS and NormFinder identified almost the same genes as the top-ten candidates in the qPCR data obtained under diverse stress conditions (Figure 2). Note that all candidate genes had an M-values of <1.5 and V-value of <0.15, thus these genes were able to be used effectively as the sole reference. The use of EP and HNR for normalization met this criterion, and the inclusion of five genes (EP, HNR, TBC, ZCF61, and
TPI) reduced the V value of the set of references substan-tially from 0.122 to 0.073 for our experimental conditions (Figure S2). Normalization with multiple reference genes has been reported to give more reliable data [17,47,48]. However, the use of so many reference genes might be
Figure 6 Relative quantification of stress responsive genes (TPP1 (a), SalT (b), COI (c), and Hp2a (d)) in the leaf of rice cultivars KDML105, NSG19, and
IR20 after water stress (22% PEG) for 0, 1, 3, and 9 h. The EP gene was used as an internal control. Bars represent the standard deviation from 3 technical replicates.
unduly expensive for the analysis of large numbers of ex-perimental samples and/or conditions, and EP alone or EP with HNR would suffice. Importantly, these analyses also showed that some of the conventionally used genes would not be useful for the experimental questions addressed in our study (e.g. EF1a and GAPDH). The use of EF1a with
EP and HNR as references did indeed give an incorrect view of the expression of SalT in our experiments (Figure 4), reinstating the cautionary note of Guenin et al. [5] on the use of incorrect references.
EP encodes an expressed protein that is similar to a bZIP family transcription factor in Arabidopsis thaliana, Glycine
max, and Vitis pseudoreticulata according to tblastx search-es. The expression stability of the EP gene indicates that it likely has a housekeeping function in rice cells. The stable expression of the EP gene in different cultivars and organs at different stages of development and under different stress treatment conditions were analyzed from data from 936 rice microarrays using the Meta-Profile Analysis module in Genevestigator software, and it was found that the expres-sion of this gene is constant broadly amongst rice samples (Figure S3). HNR (Heterogeneous nuclear ribonucleopro-tein 27C) is considered to be a component of the RNA- protein complexes involved in transcript processing in the
nucleus (UniProt ID: B6U275); its exact function is un-known, but our studies show that it is a very stably ex-pressed gene in rice. The third reference gene, TBC is simi-lar in its deduced gene product to the mammalian “TBC1 domain family member 22A” that is involved in signal transduction; it is a GTPase activating protein (GAP) (Uni-Prot ID: B6UDP4). The stability of this gene in rice indi-cates that the expression of this particular gene is not mod-ulated by different developmental or environmental cues.
It is valuable to have reference genes that work well for various cultivars. Reference genes have been validated in the Zhenshan 97, Minghui 63, Cham, DR2, Lua man, and IR64 cultivars of the Indica group, as well as the Amaroo and Nipponbare cultivars of the japonica group. Our work shows that the genes we identified work well for four very different cultivars of which one is of the japonica type. KDML105 is the elite jasmine rice, whereas NSG19 and IR20 are the references used as drought-tolerant and drought-sensitive cultivars, respectively [49]. The indica and japonica subspecies might have diverged as early as 0.4 million years ago [50]. Thus, finding reference genes suita-ble for such divergent genotypes under three different stress conditions suggests that these genes are likely to work well for other genotypes of O. sativa as well.
Maksup S, et al. Chin Sci Bull January (2013) Vol.58 No.1 11
The authors are very much appreciative for the supports of ‘Strategic Scholarships for Frontier Research Network for the Joint Ph.D. Program Thai Doctoral Degree’ from the Office of the Higher Education Commis-sion, Thailand and Mahidol University. They also gratefully acknowledge the National Research Council of Canada (NRCC), Saskatoon for
labora-tory facilities and Dr. Paula Ashe at PBI, NRCC for technical advice on qPCR experiments.
1 Godfray H C J, Beddington J R, Crute I R, et al. Food security: The challenge of feeding 9 billion people. Science, 2010, 327: 812–818 2 Mantri N L, Ford R, Coram T E, et al. Evidence of unique and shared
responses to major biotic and abiotic stresses in chickpea. Environ Exp Bot, 2010, 69: 286–292
3 Vij S, Giri J, Dansana P K, et al. The receptor-like cytoplasmic ki-nase (OsRLCK) gene family in rice: Organization, phylogenetic rela-tionship, and expression during development and stress. Mol Plant, 2008, 1: 732–750
4 Zhou J, Wang X, Jiao Y, et al. Global genome expression analysis of rice in response to drought and high-salinity stresses in shoot, flag leaf, and panicle. Plant Mol Biol, 2007, 63: 591–608
5 Guenin S, Mauriat M, Pelloux J, et al. Normalization of qRT-PCR data: The necessity of adopting a systematic, experimental condi-tions-specific, validation of references. J Exp Bot, 2009, 60: 487–493 6 Andersen C L, Jensen J L, Orntoft T F. Normalization of real-time
quantitative reverse transcription-PCR data: A model-based variance estimation approach to identify genes suited for normalization, ap-plied to bladder and colon cancer data sets. Cancer Res, 2004, 64: 5245–5250
7 Hu R, Fan C, Li H, et al. Evaluation of putative reference genes for gene expression normalization in soybean by quantitative real-time RT-PCR. BMC Mol Biol, 2009, 10: 93
8 Chen L, Zhong H-Y, Kuang J-F, et al. Validation of reference genes for RT-qPCR studies of gene expression in banana fruit under differ-ent experimdiffer-ental conditions. Planta, 2011, 234: 377–390
9 Hu R, Fan C, Li H, et al. Evaluation of putative reference genes for gene expression normalization in soybean by quantitative real-time RT-PCR. BMC Mol Biol, 2009, 10: 93–104
10 Narsai R, Ivanova A, Ng S, et al. Defining reference genes in Oryza
sativa using organ, development, biotic and abiotic transcriptome da-tasets. BMC Plant Biol, 2010, 10: 56
11 Wang L, Xie W, Chen Y, et al. A dynamic gene expression atlas covering the entire life cycle of rice. Plant J, 2010, 61: 752–766 12 Long X Y, Liu Y X, Rocheleau H, et al. Identification and validation
of internal control genes for gene expression in wheat leaves infected by strip rust. Int J Plant Breeding Genet, 2011, 5: 255–267
13 Cordoba E M, Die J V, Gonzalez-Verdejo C I, et al. Selection of ref-erence genes in Hedysarum coronarium under various stresses and stages of development. Anal Biochem, 2011, 409: 236–243
14 Li H, Qin Y, Xiao X, et al. Screening of valid reference genes for re-al-time RT-PCR data normalization in Hevea brasiliensis and ex-pression validation of a sucrose transporter gene HbSUT3. Plant Sci, 2011, 181: 132–139
15 Garg R, Sahoo A, Tyagi A K, et al. Validation of internal control genes for quantitative gene expression studies in chickpea (Cicer
ari-etinum L.). Biochem Biophys Res Commun, 2010, 396: 283–288 16 Chen R, Gyokusen M, Nakazawa Y, et al. Selection of housekeeping
genes for transgene expression analysis in Eucommia ulmoides oliver using real-time RT-PCR. J Bot, 2010, 2010: 1–7
17 Artico S, Nardeli S M, Brilhante O, et al. Identification and evalua-tion of new reference genes in Gossypium hirsutum for accurate nor-malization of real-time quantitative RT-PCR data. BMC Plant Biol, 2010, 10: 49–60
18 Lin Y L, Lai Z X. Reference gene selection for qPCR analysis during somatic embryogenesis in longan tree. Plant Sci, 2010, 178: 359–365 19 Long X Y, Wang J R, Ouellet T, et al. Genome-wide identification
and evaluation of novel internal control genes for q-PCR based tran-script normalization in wheat. Plant Mol Biol, 2010, 74: 307–311 20 Paolacci A R, Tanzarella O A, Porceddu E, et al. Identification and
validation of reference genes for quantitative RT-PCR normalization in wheat. BMC Mol Biol, 2009, 10: 11
21 Lovdal T, Lillo C. Reference gene selection for quantitative real-time PCR normalization in tomato subjected to nitrogen, cold, and light stress. Anal Biochem, 2009, 387: 238–242
22 Jain M. Genome-wide identification of novel internal control genes for normalization of gene expression during various stages of devel-opment in rice. Plant Sci, 2009, 176: 702–706
23 Remans T, Smeets K, Opdenakker K, et al. Normalisation of re-al-time RT-PCR gene expression measurements in Arabidopsis
tha-liana exposed to increased metal concentrations. Planta, 2008, 227: 1343–1349
24 Caldana C, Scheible W R, Mueller-Roeber B, et al. A quantitative RT-PCR platform for high-throughput expression profiling of 2500 rice transcription factors. Plant Methods, 2007, 3: 7–15
25 Jain M, Nijhawan A, Tyagi A K, et al. Validation of housekeeping genes as internal control for studying gene expression in rice by quantitative real-time PCR. Biochem Biophys Res Commun, 2006, 345: 646–651
26 Pfaffl M W, Tichopad A, Prgomet C, et al. Determination of stable housekeeping genes, differentially regulated target genes and sample integrity: Bestkeeper-excel-based tool using pair-wise correlations. Biotechnol Lett, 2004, 26: 509–515
27 Vandesompele J, De Preter K, Pattyn F, et al. Accurate normalization of real-time quantitative RT-PCR data by geometric averaging of multiple internal control genes. Genome Biol, 2002, 3: RESEARCH0034
28 Iskandar H, Simpson R, Casu R, et al. Comparison of reference genes for quantitative real-time polymerase chain reaction analysis of gene expression in sugarcane. Plant Mol Biol Rep, 2004, 22: 325–337 29 Nicot N, Hausman J F, Hoffmann L, et al. Housekeeping gene
selec-tion for real-time RT-PCR normalizaselec-tion in potato during biotic and abiotic stress. J Exp Bot, 2005, 56: 2907–2914
30 Yoshida S. Fundamentals of Rice Crop Science. Philippines: IRRI, Los Banos, 1981. 121–122
31 Banyai W, Kirdmanee C, Mii M, et al. Overexpression of farnesyl pyrophosphate synthase (FPS) gene affected artemisinin content and growth of Artemisia annua L. Plant Cell Tiss Org Cult, 2010, 103: 255–265
32 Livak K J, Schmittgen T D. Analysis of relative gene expression data using real-time quantitative PCR and the 2(-delta delta c(t)) method. Methods, 2001, 25: 402–408
33 Hellemans J, Mortier G, De Paepe A, et al. qBase relative quantifica-tion framework and software for management and automated analysis of real-time quantitative PCR data. Genome Biol, 2007, 8: R19 34 Claes B, Dekeyser R, Villarroel R, et al. Characterization of a rice
gene showing organ-specific expression in response to salt stress and drought. Plant Cell, 1990, 2: 19–27
35 Pramanik M H, Imai R. Functional identification of a trehalose 6-phosphate phosphatase gene that is involved in transient induction of trehalose biosynthesis during chilling stress in rice. Plant Mol Biol, 2005, 58: 751–762
36 Iordachescu M, Imai R. Trehalose biosynthesis in response to abiotic stresses. J Integr Plant Biol, 2008, 50: 1223–1229
37 Ge L-F, Chao D-Y, Shi M, et al. Overexpression of the treha-lose-6-phosphate phosphatase gene OsTPP1 confers stress tolerance in rice and results in the activation of stress responsive genes. Planta, 2008, 228: 191–201
38 de Souza Filho G A, Ferreira B S, Dias J M, et al. Accumulation of salt protein in rice plants as a response to environmental stresses. Plant Sci, 2003, 164: 623–628
39 Munemasa S, Oda K, Watanabe-Sugimoto M, et al. The corona-tine-insensitive 1 mutation reveals the hormonal signaling interaction between abscisic acid and methyl jasmonate in Arabidopsis guard cells. Specific impairment of ion channel activation and second mes-senger production. Plant Physiol, 2007, 143: 1398–1407
40 Yan J, Zhang C, Gu M, et al. The Arabidopsis coronatine insensitive1 protein is a jasmonate receptor. Plant Cell, 2009, 21: 2220–2236 41 Yanagisawa S. Dof domain proteins: Plant-specific transcription
fac-tors associated with diverse phenomena unique to plants. Plant Cell Physiol, 2004, 45: 386–391
42 Fowler S, Thomashow M F. Arabidopsis transcriptome profiling in-dicates that multiple regulatory pathways are activated during cold acclimation in addition to the CBF cold response pathway. Plant Cell, 2002, 14: 1675–1690
43 Chi X, Hu R, Yang Q, et al. Validation of reference genes for gene expression studies in peanut by quantitative real-time RT-PCR. Mol Genet Genomics, 2012, 287: 167–176
44 Dekkers B J W, Willems L, Bassel G W, et al. Identification of ref-erence genes for RT–qPCR expression analysis in Arabidopsis and tomato seeds. Plant Cell Physiol, 2012, 53: 28–37
45 Manoli A, Sturaro A, Trevisan S, et al. Evaluation of candidate ref-erence genes for qPCR in maize. J Plant Physiol, 2012, 169: 807–815 46 Pellino M, Sharbel T, Mau M, et al. Selection of reference genes for
quantitative real-time PCR expression studies of microdissected re-productive tissues in apomictic and sexual boechera. BMC Res Notes,
2012, 4: 303
47 Reid K E, Olsson N, Schlosser J, et al. An optimized grapevine RNA isolation procedure and statistical determination of reference genes for real-time RT-PCR during berry development. BMC Plant Biol, 2006, 6: 27
48 Zhong H Y, Chen J W, Li C Q, et al. Selection of reliable reference genes for expression studies by reverse transcription quantitative re-al-time PCR in litchi under different experimental conditions. Plant Cell Rep, 2011, 30: 641–653
49 Sarkarung S. A regional breeding program to develop drought-tolerant rainfed lowland germplasm: IRRI’s experience in south and Southeast Asia. In: Fischer K S, Lafitte R, Fukai S, et al., eds. Breeding Rice for Drought-Prone Environments. Philippines: International Rice Research Institute, 2003. 70–74
50 Zhu Q, Ge S. Phylogenetic relationships among A-genome species of the genus Oryza revealed by intron sequences of four nuclear genes. New Phytol, 2005, 167: 249–265
Open Access This article is distributed under the terms of the Creative Commons Attribution License which permits any use, distribution, and reproduction
in any medium, provided the original author(s) and source are credited.
Supporting Information
Table S1 Description of 15 cDNA samples used for the validation of reference genes
Figure S1 The 25 potential reference genes were obtained from the analysis of 936 microarrays by using the Biomarker Search module in
Genevesti-gator software (https: //www.genevestiGenevesti-gator.com/gv/).
Figure S2 Determination of the optimal number of reference genes for normalization by pairwise variation using geNormPLUS.
Figure S3 Stable expression of the EP (Os.10806.1.S1_at) gene under different stress treatments (a), cultivars (b), organs (c), and development (d)
an-alyzed from the data from the 936 rice microarrays.
Figure S4 The variability of EP (a), HNR (b), and EF1a (c) expressions were tested in seedlings of TP309 rice exposed to drought stress for 0 (Cont), 5
(D5), and 10 h (D10).
The supporting information is available online at csb.scichina.com and www.springerlink.com. The supporting materials are published as submitted, without typesetting or editing. The responsibility for scientific accuracy and content remains en-tirely with the authors.
Maksup S, et al. Chin Sci Bull January (2013) Vol.58 No.1 13
Table S1 Description of 15 cDNA samples used for the validation of reference genes.
cDNA sample Description
Oryza sativa ssp. japonica cv. TP309 1 3 week-old, leaf, watering
2 3 week-old, leaf sheath, watering
3 3 week-old, leaf, 24 h 200 mM NaCl
4 3 week-old, leaf, 24 h 4˚C
O. sativa ssp. indica
cv. KDML105
5 2 week-old, leaf, without PEG (-0.1 MPa)
6 2 week-old, leaf sheath, without PEG (-0.1 MPa)
7 2 week-old, root, without PEG (-0.1 MPa)
8 45 day-old, mature leaf, watering
9 2 week-old, leaf sheath, 1h 22%PEG (-0.5 MPa)
10 2 week-old, leaf sheath, 3h 22%PEG (-0.5 MPa)
11 2 week-old, leaf sheath, 9h 22%PEG (-0.5 MPa)
cv. NSG19
12 2 week-old, leaf sheath, without PEG (-0.1 MPa)
13 2 week-old, leaf sheath, 9h 22%PEG (-0.5 MPa)
cv. IR20
14 2 week-old, leaf sheath, without PEG (-0.1 MPa)
15 2 week-old, leaf sheath, 9h 22%PEG (-0.5 MPa)
Data sets used for the calculation of the average expression stability (M) values: “All tested samples” included all 15 cDNA samples
“Indica and japonica” included cDNA samples 2, 6, 12, 14 “Various tissues” included cDNA samples 5, 6, 7, 8 “Various drought” included cDNA samples 6, 9, 10, 11 “japonica rice” included cDNA samples 1-4
Figure S1 The 25 potential reference genes were obtained from the analysis of 936 microarrays by using the Biomarker Search module in Genevestigator
software (https: //www.genevestigator.com/gv/). The microarray data (Array type: OS_51K: Rice Genome 51K array) derived from the Gene Expression Omnibus (765 arrays), ArrayExpress (160 arrays), and PLEXdb (11 arrays) databases is shown. The 15 candidate genes that have the same expression range as the target gene (Hp2a) were selected. The expression levels were classified as low (0-10), medium (11-14), and high (>14) according to the signal inten-sity on an Affymetrix OS_51K: Rice Genome 51K array.
Figure S2 Determination of the optimal number of reference genes for normalization by pairwise variation using geNormPLUS (Hellemans et al., 2007; Vandesompele et al., 2002). The level of variation (V) in the gene expression is shown. V < 0.15 is recommended (Vandesompele et al., 2002). For example, V2/3 describes the variation of the normalization factor of the two most stable genes (EP and HNR) and V3/4 describes the variation of the normalization factor of the two most stable genes including the third gene, TBC. V6/7 describes the use of EP, HNR, TBC, ZCF61, TPI, and GRP; V7/8 describes the use of six genes including NBP, V8/9 describes the use of seven genes including VPS, and V9/10 describes the use of eight genes including ABP.
Maksup S, et al. Chin Sci Bull January (2013) Vol.58 No.1 15
Figure S3 Stable expression of the EP (Os.10806.1.S1_at) gene under different stress treatments (a), cultivars (b), organs (c), and development (d)
ana-lyzed from the data from the 936 rice microarrays. Data were anaana-lyzed using the Meta-Profile Analysis module in the Genevestigator software (https: //www.genevestigator.com/gv/). The expression levels of Figure (a) and Figure (b) are presented as log2-ratio where log2-ratio < 0 indicates a down-regulated gene (left) and log2-ratio > 0 indicates an up-regulated gene (right). The expression levels of Figure (c) and Figure (d) are shown as signal intensities on the Affymetrix OS_51K: Rice Genome 51K array.
Figure S4 The variability of EP (a), HNR (b), and EF1a (c) expressions were tested in seedlings of TP309 rice exposed to drought stress for 0 (Cont), 5
(D5), and 10h (D10). The Ct values of each replicate were plotted and the descriptive statistics including mean, standard deviation (SD), and variance were analyzed by SPSS software. Data were analyzed from 3 biological replicates (br1, br2, and br3) and 2 technical replicates (1 and 2).