Publisher’s version / Version de l'éditeur:
Journal of Ocean Technology, 8, 2, pp. 73-85, 2013-06-01
READ THESE TERMS AND CONDITIONS CAREFULLY BEFORE USING THIS WEBSITE. https://nrc-publications.canada.ca/eng/copyright
Vous avez des questions? Nous pouvons vous aider. Pour communiquer directement avec un auteur, consultez la première page de la revue dans laquelle son article a été publié afin de trouver ses coordonnées. Si vous n’arrivez pas à les repérer, communiquez avec nous à PublicationsArchive-ArchivesPublications@nrc-cnrc.gc.ca.
Questions? Contact the NRC Publications Archive team at
PublicationsArchive-ArchivesPublications@nrc-cnrc.gc.ca. If you wish to email the authors directly, please see the first page of the publication for their contact information.
NRC Publications Archive
Archives des publications du CNRC
This publication could be one of several versions: author’s original, accepted manuscript or the publisher’s version. / La version de cette publication peut être l’une des suivantes : la version prépublication de l’auteur, la version acceptée du manuscrit ou la version de l’éditeur.
Access and use of this website and the material on it are subject to the Terms and Conditions set forth at
Effect of simulated interior lifeboat environments on occupant thermal
responses
Power, J. T.; Simões Ré, A. J.
https://publications-cnrc.canada.ca/fra/droits
L’accès à ce site Web et l’utilisation de son contenu sont assujettis aux conditions présentées dans le site LISEZ CES CONDITIONS ATTENTIVEMENT AVANT D’UTILISER CE SITE WEB.
NRC Publications Record / Notice d'Archives des publications de CNRC: https://nrc-publications.canada.ca/eng/view/object/?id=12e09e1b-764a-4070-acfe-443d276a88dd https://publications-cnrc.canada.ca/fra/voir/objet/?id=12e09e1b-764a-4070-acfe-443d276a88dd
TITLE:
Effect of simulated interior lifeboat environments on occupant thermal responses. AUTHORS:
J.T. Power1and A.J. Simões Ré1
1. National Research Council of Canada
ABSTRACT:
The effects of simulated interior lifeboat environments on the thermoregulatory responses of participants wearing immersion suits were investigated. Two different environmental conditions were investigated: the interior air temperature and relative humidity levels found in a
conventional lifeboat that relies on passive ventilation (“Condition 1”); and those proposed to be in a next generation lifeboat that will have an active ventilation system (“Condition 2”).
Participants performed three hour tests in both Condition 1 and Condition 2. Condition 1 produced a significantly greater increase (P < 0.05) in the rate of sweat accumulation, rate of mean skin temperature and gastro-intestinal temperature increase, heart rate, and physiological strain index values compared to Condition 2. Condition 1 caused an amount of sweat
accumulation sufficient to dampen the underclothing to a level that would cause a significant reduction in predicted survival time. Heart rate, gastro-intestinal temperature and physiological strain index values continued to rise during Condition 1 suggesting that the level of thermal stress was uncompensable by the thermoregulatory systems of the participants which is
supported by the air temperature and relatively humidity levels being at a critical environmental limit in which heat balance cannot be achieved. It is concluded that the interior environmental
conditions of conventional lifeboats that rely on a passive ventilation system will result in a level of thermal stress that cannot be compensated for by people wearing immersion suits which will result in increasing levels of physiological strain.
ACKNOWLEDGEMENTS
The authors are grateful for the help and assistance from Lise Petrie, Stephanie Power-MacDonald, Andrew Baker, and Peter Hackett in completing this study.
The authors would like to thank Transport Canada for their financial support of this work and all the participants who volunteered for this study.
INTRODUCTION
In the unlikely event of a marine accident the order may be given to abandon the ship or installation. In such an event the priority is to ensure that all personnel are able to evacuate the ship or installation safely, and if necessary, travel a distance away from the potential hazard in a safe refuge. A lifesaving appliance (LSA) that is designed to allow this to be accomplished is a lifeboat. There are many different styles of lifeboats, including, unpowered, open top models such as those used on board the Titanic almost 100 years ago, to more advanced models that are powered and enclosed.
Lifeboats are one of the most used marine evacuation craft in both the shipping and offshore industries. Safety of life at sea regulations (SOLAS) require all offshore vessels and installations carry enough lifeboats to cover all personnel on board (POB), and in some jurisdictions the requirement is for 200% POB capacity. Even though lifeboats are widely used, and required by regulations, little work has been done that examines inside these craft: conditions that the
occupants may be expected to endure for prolonged periods of time in dangerous environments. The International Maritime Organization (IMO) Lifesaving Appliances code does not specify any criteria for the internal environment of a lifeboat during operation. There are no specified maximum levels for carbon monoxide (CO), carbon dioxide (CO2), sound, light temperature, or
humidity.
Earlier work by examined the interior environment of a TEMPSC lifeboat as it navigated through pack ice conditions (Taber et al., 2011). During the tests with the hatches open, there was little change in the interior environment and all crew members remained comfortable, but the water tight integrity of the lifeboat was compromised under such situations. When the hatches were closed (and watertight integrity achieved) the tests had to be ended after only a few minutes as CO and CO2levels exceeded safety limits (Taber et al., 2011). It was also found that the interior
lifeboat temperature began to rise while the hatches were closed.
Expanding on this work, a follow up pilot study by was conducted that focused specifically on the effects that the interior temperature of the lifeboat had on its crew members (Power and Simões Ré, 2010). During sea-keeping exercises (TWater = 7.6°C; TAir= 14.0°C), two of the three
crew members were instrumented with skin thermistors, heat flow transducers, and gastro-intestinal pills (to measure deep body temperature). Both crew members wore wool socks, cotton pants, cotton undershirts and cotton long sleeved over shirts underneath a Transport Canada certified marine abandonment suit.
The first set of sea-keeping exercises were performed with the hatches closed, and the immersion suits fully zipped. The ambient air temperature inside the lifeboat rose to 30°C, and the mean skin temperature (T¯SK) of the two instrumented crew members rose ~3°C in approximately two
hours (Power and Simões Ré, 2010). Both instrumented crew members reported moderate levels of thermal discomfort and had sweated profusely during the sea-keeping exercises. Upon
completion of the tests, both crew members’ underclothing were wet to the touch with sweat. In a later test the hatches of the lifeboat remained opened. While this compromised the watertight integrity of the lifeboat, the interior temperature of the lifeboat was much lower compared to when the hatches were closed. The two crewmembers reported feeling much more comfortable with the hatches open. The findings from this pilot study suggested that the interior temperature of a lifeboat with hatches closed will increase the thermal stress placed on occupants wearing immersion suits, causing increased thermal discomfort and wetting of underclothing due to sweat.
Many previous studies have investigated the effects of wetting of the clothing worn under an immersion suit have on thermal responses during immersions. Earlier work by Hall and Polte has shown that 684g of water added underneath an immersion suit can reduce total insulation by 27.5% and 1986g will result in a 49.6% reduction (Hall and Polte, 1956). Similar findings by Allan and colleagues found that 500g of water underneath an immersion suit would reduce total insulation by 30% (Allan et al., 1985); while Light and colleagues found that 500g of water leakage would reduce predicted survival times to 1.7 hours compared to 3.5 hours when dry during immersions in 5°C water (Light et al., 1987). Tipton and Balmi have reported that not only is the amount of water leakage important, but the location of the leak is as well (Tipton and Balmi, 1996). When 500mL of water was applied over the limbs of participants, it produced a drop in rectal temperature similar to that seen when the participants were dry. When 500mL of water was applied over the torso, it resulted in a significant decrease in rectal temperature compared to when they were dry (Tipton and Balmi, 1996).
Given the significant effects of wetting of the clothing worn underneath an immersion suit can have on reducing total insulation, therefore reducing predicted survival times, it was unknown how the interior environments of lifeboats would contribute to this degradation. This large volume of sweat accumulation is also indicative of a high level of thermal stress placed upon the lifeboat occupants. The initial pilot work performed by Power and Simões Ré (2010) found that the clothing of the lifeboat crewmembers were significantly wet after being in the lifeboat for three hours, leading to a reduction in predicted survival time. What was unknown was how wet the clothing was, and how much a reduction in predicted survival times there would be. The purposes of this study were: firstly, investigate the effects that the interior environment of a conventional (“Condition 1”) lifeboat has on human thermal responses. Secondly, compare the thermal responses of the participants in the conventional lifeboat environment, to an environment proposed to be a “next generation” lifeboat (“Condition 2”) that has active ventilation controls.
The hypotheses for the experiment were:
H1: There will be a significant difference in sweat accumulation rates between Condition 1 and
Condition 2.
H2: There will be a significant difference in the rate of T¯SKchange between Condition 1 and
Condition 2.
H3: There will be a significant difference in the rate of deep body temperature change between
METHODS
Participants
Thirteen male participants volunteered for this study. The National Research Council of Canada’s Research Ethics Board approved this study (REB#: 2011-42). Participants gave their written informed consent prior to participating and all were screened by a medical doctor prior to participating to ensure they were physically fit to do so. The anthropometrics of the participants are given in Table 1.
Table 1. Participant anthropometrics (n = 13).
Age (yrs) Height (cm) Mass (kg) Body Fat % Surface Area (m2) Mean [SD] 25.5 [4.4] 178.9 [6.3] 80.6 [17.8] 17.6 [7.2] 2.0 [0.2]
Environmental Chamber
All tests were conducted in the Thermal Measurements Lab (TML) located at the National Research Council of Canada’s St. John’s facility. The TML contains an environmental test chamber (6m [L] by 5m [W]) used to create a variety of environmental conditions. The
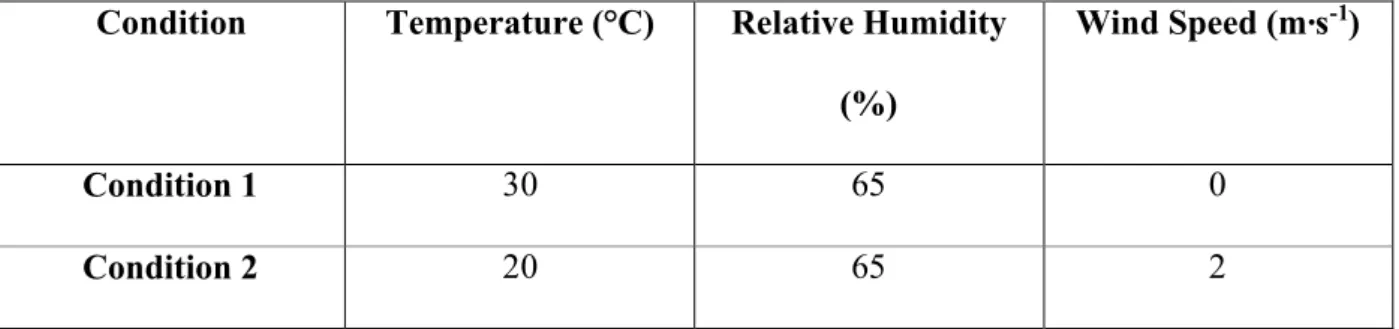
environmental chamber has a closed loop climate control system with temperature stability of +/-0.5°C over the temperature range of 5-35°C. The conditions tested in this study are given in Table 2.
Table 2. Environmental conditions.
Condition Temperature (°C) Relative Humidity (%)
Wind Speed (m∙s-1)
Condition 1 30 65 0
Condition 2 20 65 2
Condition 1 and Condition 2 were recreations of the environments measured inside the lifeboat during the initial pilot work by Power and Simões Ré (2010). Condition 1 in the current study was equivalent to the lifeboat having the hatches closed in the previous pilot work. Condition 2 was equivalent to when the hatches were open in the lifeboat, with a 2m∙s-1wind blowing
through it as a result of its forward speed. In the current study wind was generated in Condition 2 by a floor mounted fan.
Instrumentation
Skin temperature and heat flow
Skin temperature and heat flow were measured using heat flow transducers (Concept
Engineering, Old Saybrook, Connecticut, USA) attached using 3M “Transpore” porous, adhesive tape to the following locations: right foot, left shin, right quadriceps, left abdominal, right
pectoral, underside of right forearm, forehead, right calve, left hamstring, right lower back, left shoulder, topside of left forearm. These sites were chosen based on the Hardy and Dubois modified 12 point system (Hardy and DuBois, 1938). The heat flow transducers were connected to self contained data loggers (ACR Data Systems, Surrey, British Columbia, Canada) that measured and recorded all 12 sensors once every eight seconds. The internal memory of the data
loggers were cleared prior to the start of every test, and all information was downloaded
immediately after each test was completed. The loggers were mounted on a thin mesh vest worn by the participants over their underclothing.
Deep body temperature
Gastro-intestinal temperature (TGI) was measured using ingestible, disposable, radio telemetry
pills (HQ Inc. Palmetto, Florida, USA). Telemetry from the pills were recorded once every 20 seconds by a data recorder (HQ Inc., Palmetto, Florida, USA). The pill data recorder wirelessly transmitted TGIto a laptop to allow for real time monitoring of the deep body temperature of the
participants.
Heart Rate
Heart rate was transmitted using a Polar heart rate monitor (Polar Electro Canada, Lachine, Quebec, Canada). The same data recorder used to measure and record TGIwas also used for
recording heart rate once every 20 seconds.
Interior Immersion Suit Temperature
The temperature underneath the immersion suit was measured using a Philips eosphageal/rectal temperature thermistor (Pillips Medical Systems, Andover, MA, USA). The thermistor was connected to the self contained data loggers used to record heat flow sensor measurements.
Clothing
Participants wore a marine abandonment immersion suit (White’s Manufacturing, Victoria, British Columbia, Canada) certified to the standard CAN/CGSB-65.16-2005. The underclothing ensemble was provided to the participants for this study. The underclothing worn by the
participants was based on that prescribed by CAN/CGSB-65.16-2005 and consisted of wool socks, cotton pants, cotton underwear, cotton undershirt, and a long sleeved cotton shirt. During each test, the participants wore an external bladder in the event they needed to urinate. The bladder consisted of a condom catheter connected to a medical grade urine collection bag filled with powder from a Travel John disposable urinal (Reach Global Industries, California, USA).
Procedure
Participants were tested at the same time of day with six participants starting with the Condition 1, and seven with Condition 2. On the day of each test, participants arrived at the facility and ingested the gastro-intestinal pill with a small amount of room temperature water. The
participants changed into the underclothing provided by the research team. The underclothing and immersion suit were weighed prior to the start of each test on a Sartorius MC1 Scale
(Sartorious AG, Goettigen, Germany) to get the dry weight. A research team member applied the heat flow sensors on the participants at the locations listed previously with adhesive, porous tape. After the sensors were applied, the participants donned the immersion suits and proceeded to the TML. At the TML, the data acquisition equipment was checked for functionality and then five minutes of baseline data were collected. Once the data were collected, the participants entered the TML and were seated at a desk for the duration of the three hour tests. Participants were able to watch movies on a monitor connected to a portable DVD player.
At the end of the three hour tests, or when the participant requested it to end, they exited the TML to have the data downloaded from the acquisition systems and were then de-instrumented. The participant underclothing was placed in a bag and immediately weighed to get the post test weight. The same was done for the immersion suits.
Participants were offered snacks and beverages while their deep body temperature approached pre-test values. After their well-being was assured, the participants were allowed to leave the facility and return for their next scheduled test.
Calculations
Body fat was estimated from the measurement of skinfold thickness from four sites: bicep, trciep, subscapular, and iliac crest (Durnin and Womersley, 1974).
Heat flow and skin temperature values were weighted according to the values reported by Hardy and Dubois (1938) to calculate area weighted mean skin heat flow (MSHF [W∙m-2]) and T¯SK
(°C).
Surface area (SA) was calculated using the following equation (Gehan and George, 1970): SA (m2) = 0.1644∙WT0.51456∙HT0.42246 (1)
Where
WT = mass (kg) HT = height (m)
The final MSHF and T¯SKvalues were divided by 0.95 to take into account the lack of a hand
measurement. The equation used to calculate MSHF and T¯SKwas:
∑ (Measurement Sit ∙ Weighting Value)/0.95 = MSHF (2) Change in TGI(ΔTGI[°C]) and T¯SK (ΔT¯SK[°C]) were calculated by averaging the measurements
period at the start of the test. ΔTGI and Δ¯TSKwere divided by the length of the tests to give the
rate of change for each (°C∙hr-1).
Heat rate values (in beats per minute [BPM]) were averaged over a five minute period at the end of each test.
The physiological strain index (PSI) was calculated using the equation described by Moran and colleagues (1998):
PSI = 5∙([TGIt– TGI0] ∙ [39.5 – TGI0]-1) + 5∙([HRt– HR0] ∙ [180 – HR0]-1) (3)
Where:
TGIt= Gastro-intestinal temperature (°C) taken at a specific time in the test.
TGI0= Gastro-intestinal temperature (°C) taken at the start of the test.
HRt= Heart rate (BPM) taken at a specific time in the test.
HR0= Heart rate (BPM) taken at the start of the test.
Sweat accumulation (g) was measured by subtracting the pre-test mass of the immersion suit and underclothing ensemble from the post test mass. The difference in mass was recorded as the amount of sweat accumulated during the test. The sweat accumulation totals were divided by the length of the tests to give the rate (g∙hr-1).
Statistical analyses
All results are reported as means with a standard deviation [SD] unless otherwise stated. The statistical software program Graphpad InStat v.310 was used to test for normality of data and compare means with paired t-tests, with a P value less than 0.05 considered as significant. RESULTS
All participants completed the tests in Condition 2. Two of the 13 participants completed only two hours in Condition 1; their data are included in the results up to two hours for both conditions. After two hours, the data from 11 participants is reported for both conditions.
Interior Immersion Suit Air Temperature
The interior immersion suit air temperature was significantly greater in Condition 1 (35.9 [1.1]°C) compared to Condition 2 (29.4 [2.6]°C).
Sweat Accumulation
The rate of sweat accumulation was significantly greater in Condition 1 (300.3 [190.3] g∙hr-1)
Figure 1. Rate of sweat accumulation (g∙hr-1) at the end of the tests (Mean [SD], n = 13, ** = P <
0.001).
Mean Skin Heat Flow
MSHF was significantly greater in Condition 2 (47.14 [6.38] W∙m-2) compared to Condition 1
Figure 2. MSHF (W∙m-2) of the participants at the end of the tests (Mean [SD], n = 13, ** = P <
0.001).
Mean Skin Temperature
The rate of ΔT¯SKin Condition 1 (0.87 [0.20]°C∙hr-1) was significantly greater compared to
Condition 2 (-0.03 [0.15] °C∙hr-1) (Figure 3). T¯
SKwas significantly greater at the end of the tests
Figure 3. Absolute T¯SK(°C) during the tests (Mean [SD], ** = P < 0.001).
Gastro-intestinal temperature
The rate of ΔTGIin Condition 1 (0.31 [0.10]°C∙hr-1) was significantly greater compared to
Condition 2 (0.02 [0.08]°C∙hr-1) (Figure 4). T
GIwas significantly greater at the end of the tests in
Figure 4. Absolute TGI(°C) during the tests (Mean [SD], * = P < 0.05).
Heart Rate
Heart rate was significantly greater at the end of Condition 1 (109 [13]BPM) compared to Condition 2 (67 [10]BPM) (Figure 5).
Figure 5. Absolute heart rate (BPM) during the tests (Mean [SD], ** = P < 0.001).
Physiological strain index
The PSI was significantly higher at the end of Condition 1(3.42 [0.95]) compared to Condition 2 (-0.04 [067]) (Figure 6).
Figure 6. Absolute PSI during the tests (Mean [SD], n =13, ** = P < 0.001).
DISCUSSION
The first hypothesis is accepted: sweat accumulation rates were significantly higher in Condition 1 compared to Condition 2 (Figure 1). The second hypothesis is accepted: the rate of ΔT¯SK was
significantly greater in Condition 1 compared to Condition 2 (Figure 3). The third hypothesis is accepted: the rate of ΔTGIwas significantly greater in Condition 1 compared to Condition 2
(Figure 4).
The mean amount of sweat accumulated in the underclothing during Condition 1 was an amount sufficient to cause a significant reduction in the total insulation value of the immersion suit based
on the results reported by Hall and Polte (Hall and Polte, 1956). Hall and Polte reported that 400g∙m-2of water underneath an immersion suit resulted in almost 30% loss of insulation. The
mean amount of sweat produced by our participants was 433.9g∙m-2, indicating that the
immersion ensemble worn by the participants (immersion suit and underclothing) lost approximately 30% total insulation during the course of the tests. Later work by Light and colleagues found that 699g of water leakage and sweat underneath an immersion suit resulted in a 34% loss insulation, and reduced predicted survival time from 3.5 to 1.5 hours when immersed in 5°C water while wearing an uninsulated dry suit that had an immersed clo value of 0.5 (Light et al., 1987).
This large volume of sweat produced during these trials has important implications with regards to immersion suit performance. Current Canadian General Standards Board (CGSB) standards for testing immersion suits require that the amount of water ingress measured during the leakage tests be added underneath the immersion suit prior to measuring its thermal insulation (CGSB, 2005). As a result of this, manufacturers will add enough insulation required to achieve the prescribed 0.75clo value required by the CGSB to offset the loss caused by the water leakage. If an immersion suit has good seals and prevents any water leakage during standards testing, then the amount of insulation in the suit will be an amount required to achieve at least 0.75clo when
dry inside the suit. The conditions experienced by our participants in Condition 1 in the present
experiment resulted in a volume of liquid being introduced underneath the immersion suit sufficient to significantly reduce predicted survival time. In effect, a water tight immersion suit may experience a significant reduction in performance without ever having any of its seals fail. The large volume of sweat accumulated by our participants was a thermoregulatory response to the increasing skin (Figure 3) and deep body temperatures (Figure 4). In order to remain in
thermal balance, the heat loss must equal heat gain in the thermal balance equation. In Condition 1, T¯SKbegan to rise almost immediately and quickly climbed to near 36°C after only one hour
(Figure 3). This rapid rise in temperature indicates that the rate of heat loss to the external environment was well below the rate at which metabolic heat was being generated by the
participants, thus the heat balance was in favour of heat gain. During the first hour of the tests in Condition 1, the rate of T¯SKincrease was 2.24°C∙hr-1; 0.51°C∙hr-1during the second hour; and
0.37°C∙hr-1in the final hour (Figure 4). The slowing of the rate of increase of T¯
SK suggests that
the temperature of the skin was becoming equal with the air temperature inside the immersion suit after the initial rapid rise during the first hour. It is likely that eventually T¯SKwould have
stabilized at a temperature between 36-37°C if the tests had continued past the three hour duration.
Due to the increase in T¯SK, the thermal gradient between the skin and the core of the body
decreased resulting in less heat transfer from the latter to the former. Sweat is only capable of cooling the body when it evaporates (Kenney et al., 2004), and if the participant is in a non-evaporative environment, the non-evaporative cooling is severely limited leading to an eventual rise of deep body temperature. As the tests continued, the stored heat in the tissues of the participants began to rise, eventually leading to TGIsignificantly increasing compared to Condition 2 (Figure
4). During the final hour of the tests in Condition 1, the rate of TGIincrease was 0.41°C∙hr-1
(Figure 4), with no indication of decreasing. The most obvious risk this rate of increase in TGI
poses is the development of heat exhaustion and possibly hyperthermia. The onset of heat exhaustion can result in light-headedness, dizziness, faintness, headaches, nausea and vomiting (Golden and Tipton, 2002; Aggarwal et al., 2008); physiological conditions that would be extremely unpleasant to endure while in the cramped confines of a lifeboat during a marine
evacuation. Motion sickness is a possible occurrence for people inside of a lifeboat which is thought to exacerbated by heat (Light and Coleshaw, 1993).
Condition 1 caused a significant increase in HR compared to Condition 2 (Figure 5) which may have been caused by either dehydration (Sawka et al., 1992); an increase in cardiac output to support the increase in skin blood flow (Rowell, 1986) or a combination of both. Minson and colleagues found that older males had a significantly lower increase in total skin blood flow compared to younger males (Minson et al., 1998) when passively heated with a water suit. Reduced skin blood flow to the surface of the skin would result in an older population not being as capable of transferring heat out of the body as effectively compared to a younger population. The ages of the participants in the current study ranged from 21 to 35 years old with a mean age of 25.5 [4.4]. Kozey and colleagues reported that the range of the age of offshore workers who volunteered for their study was 18 to 58 years old, with a mean age of 37.1 [9.8] years old (Kozey et al., 2009). The older individuals who work in the offshore industry would most likely have reduced skin blood flow, decreasing the amount of heat they could lose through the surface of their skin. It is possible that a workforce with an age older than the participants used in the current study may suffer a greater rise in TGIsince their ability to lose heat to the external
environment via increased skin blood flow would be decreased.
Compared to other work (Moran et al., 1998; Tikuisis et al., 2002), the PSI reported in the current study was much lower (Condition 1: 3.42 [0.95]; Condition 2: -0.04 [0.67]; Figure 6). A mean PSI value of 3.42 in Condition 1 is equivalent to “Low” strain on the PSI index (Moran et al., 1998), suggesting that the conditions in the current study may pose little risk. However, the PSI values reported in earlier studies (Moran et al., 1998; Tikuisis et al., 2002) were obtained from exercising participants, while those in the current study were sitting passively. In Condition
1, PSI rose at a rate of 1.2 [0.3] per hour and was still rising when the tests were ended at the three hour mark (Figure 6). Occupants of lifeboats can be expected to be inside them for up to 24 hours (IMO, 2010). Based on the rate of increase in PSI measured in the current study, it may take as little as six hours to reach a PSI strain level of “High” (Moran et al., 1998).
Previous work by Kenney and Zeman established the critical environmental limits in which heat balance cannot be maintained for a given metabolic heat production (Kenney and Zeman, 2002). Kenney and Zeman reported that, for unacclimated men, an ambient dry bulb temperature of 36°C and approximately 55-60% relative humidity was one such limit (Kenney and Zeman, 2002). Even though relative humidity inside the immersion suit was not measured in the current study, it can be assumed that it was high due to the water tight nature of the suit worn and the sweat produced by the participants saturating the air of the microclimate inside. The internal air temperature of immersion suit was 35.9 [1.1]°C in Condition 1, and assumed high relative humidity, would put it at a critical environmental limit established by Kenney and Zeman in which heat balance cannot be achieved. The continuous increase in TGIthroughout Condition 1
(Figure 4) would support this theory that heat balance was not achieved, and that the participants would continue to gain heat. In contrast to Condition 1, the interior air temperature of the
immersion suit in Condition 2 was only 29.4 [2.6]°C; a value below the reported critical
environmental limit reported Kenney and Zeman. This would suggest that the participants would be able to stay in heat balance in Condition 2; a theory supported by the stable TGImeasured
during those tests (Figure 4).
The initial goal of this study was to determine the amount of sweat accumulated inside the immersion suit in conditions representative of those found in a conventional lifeboat. It was found that the rate of sweat accumulation was sufficient to cause a significant drop in immersion
insulation, which would lead to a reduction in predicted survival times. This shows that even with an immersion suit that had proper water tight seals, the interior environments of a lifeboat would produce conditions sufficient to cause a significant degradation in performance of the suit due to accumulation of liquid underneath it. An unexpected finding from this study was the severity of the thermal stress placed on participants in Condition 1. The significant, and continuous, rise of T¯SK, TGI, HR, and PSI all show that the thermal stress placed on the
participants wearing an immersion suit in Condition 1 was at a sufficient level that their own thermoregulatory responses were not capable of defending against it, resulting in them gaining heat. Based on the results reported by Kenny and Zeman, the temperature inside the immersion suit in Condition 1 was a critical environmental limit in which heat balance cannot be achieved. Given that people can be expected to be in lifeboats for up to 24 hours, it is possible that heat exhaustion and hyperthermia can quickly become serious threats to survival in that time period. It is recommended that lifeboats be modified so that during normal operations at sea, their interior environments match those used in Condition 2 in the current study as opposed to Condition 1.
REFERENCES:
Aggarwal, Y., Karan, B. M., Das, B. N. and Sinha, R. K. (2008). Prediction of heat-illness symptoms with the prediction of human vascular response in hot environment under resting condition. J Med Syst, 32, 167-76.
Allan, J. R., Higenbottam, C. and Redman, P. J. (1985). The effect of leakage on the insulation provided by immersion-protection clothing. Aviat Space Environ Med, 56, 1107-9.
Durnin, J. V. and Womersley, J. (1974). Body fat assessed from total body density and its estimation from skinfold thickness: measurements on 481 men and women aged from 16 to 72 years. Br J Nutr, 32, 77-97.
Gehan, E. A. and George, S. L. (1970). Estimation of human body surface area from height and weight. Cancer Chemother Rep, 54, 225-35.
Golden, F. S. C. and Tipton, M. J. (2002). Essentials of Sea Survival. Human Kinetics. Windsor, ON, Canada.
Hall, J. F., Jr. and Polte, J. W. (1956). Effect of water content and compression on clothing insulation. J Appl Physiol, 8, 539-45.
Hardy, J. D. and DuBois, E. F. (1938). The technic of measuring radiation and convection. . J of
Nutr, 15, 461-75.
International Maritime Organization. (2010). Life-Saving Appliances.
Kenney, W. L., DeGroot, D. W. and Holowatz, L. A. (2004). Extreme of human heat tolerance: life at the precipice of thermoregulatory failure. Journal of Thermal Biology, 29, 479-485. Kenney, W. L. and Zeman, M. J. (2002). Psychrometric limits and critical evaporative coefficients for unacclimated men and women. J Appl Physiol, 92, 2256-63.
Kozey, J. W., Brooks, C. J., Dewey, S. L., Brown, R. C., Howard, K. A., Drover, D.,
MacKinnon, S. and McCabe, J. (2009). Effects of human anthropometry and personal protective equipment on space requirements. Occupational Ergonomics, 8, 67-79.
Light, I. M., Avery, A. and Grieve, A. M. (1987). Immersion suit insulation: the effect of dampening on survival estimates. Aviat Space Environ Med, 58, 964-9.
Light, I. M. and Coleshaw, S. K. (1993). Survivability of Occupants of Totally Enclosed Motor Propelled Survival Craft. Health and Safety Executive. OTH 92 376.
Minson, C. T., Wladkowski, S. L., Cardell, A. F., Pawelczyk, J. A. and Kenney, W. L. (1998). Age alters the cardiovascular response to direct passive heating. J Appl Physiol, 84, 1323-32. Moran, D. S., Shitzer, A. and Pandolf, K. B. (1998). A physiological strain index to evaluate heat stress. Am J Physiol, 275, R129-34.
Power, J. T. and Simões Ré, A. J. (2010). Lifeboat habitability and effects on human subjects.
International Conference and Exhibition on Performance of Ships and Structures in Ice.Anchorage, Alaska, USA.
Rowell, L. B. (1986). Human Circulation: Regulation During Physical Stress. Oxford University Press. New York.
Sawka, M. N., Young, A. J., Latzka, W. A., Neufer, P. D., Quigley, M. D. and Pandolf, K. B. (1992). Human tolerance to heat strain during exercise: influence of hydration. J Appl Physiol, 73, 368-75.
Taber, M. J., Simoes Ré, A. J. and Power, J. T. (2011). A preliminary ergonomic assessment of piloting a lifeboat in ice. Safety Science, 49, 139-147.
Tikuisis, P., McLellan, T. M. and Selkirk, G. (2002). Perceptual versus physiological heat strain during exercise-heat stress. Med Sci Sports Exerc, 34, 1454-61.
Tipton, M. J. and Balmi, P. J. (1996). The effect of water leakage on the results obtained from human and thermal manikin tests of immersion protective clothing. Eur J Appl Physiol Occup
![Figure 1. Rate of sweat accumulation (g∙hr -1 ) at the end of the tests (Mean [SD], n = 13, ** = P <](https://thumb-eu.123doks.com/thumbv2/123doknet/14109856.466465/14.892.153.724.199.626/figure-rate-sweat-accumulation-end-tests-mean-sd.webp)
![Figure 2. MSHF (W∙m -2 ) of the participants at the end of the tests (Mean [SD], n = 13, ** = P <](https://thumb-eu.123doks.com/thumbv2/123doknet/14109856.466465/15.892.136.734.187.588/figure-mshf-w-participants-end-tests-mean-sd.webp)
![Figure 3. Absolute T ¯ SK (°C) during the tests (Mean [SD], ** = P < 0.001).](https://thumb-eu.123doks.com/thumbv2/123doknet/14109856.466465/16.892.138.746.205.583/figure-absolute-sk-during-the-tests-mean-sd.webp)
![Figure 4. Absolute T GI (°C) during the tests (Mean [SD], * = P < 0.05).](https://thumb-eu.123doks.com/thumbv2/123doknet/14109856.466465/17.892.137.768.199.604/figure-absolute-t-gi-c-tests-mean-sd.webp)
![Figure 5. Absolute heart rate (BPM) during the tests (Mean [SD], ** = P < 0.001).](https://thumb-eu.123doks.com/thumbv2/123doknet/14109856.466465/18.892.138.745.187.603/figure-absolute-heart-rate-bpm-tests-mean-sd.webp)
![Figure 6. Absolute PSI during the tests (Mean [SD], n =13, ** = P < 0.001).](https://thumb-eu.123doks.com/thumbv2/123doknet/14109856.466465/19.892.139.737.180.616/figure-absolute-psi-during-the-tests-mean-sd.webp)
