EUROPEAN ORGANISATION FOR NUCLEAR RESEARCH (CERN)
Phys. Lett. B774 (2017) 379
DOI:10.1016/j.physletb.2017.09.078
CERN-EP-2017-054 February 9, 2018
Measurement of jet p
T
correlations in Pb
+Pb and
pp collisions at
√
s
NN
= 2.76 TeV with the ATLAS
detector
The ATLAS Collaboration
February 9, 2018
Measurements of dijet pT correlations in Pb+Pb and pp collisions at a nucleon–nucleon centre-of-mass energy of √sNN= 2.76 TeV are presented. The measurements are performed with the ATLAS detector at the Large Hadron Collider using Pb+Pb and pp data samples corresponding to integrated luminosities of 0.14 nb−1 and 4.0 pb−1, respectively. Jets are reconstructed using the anti-ktalgorithm with radius parameter values R= 0.3 and R = 0.4. A background subtraction procedure is applied to correct the jets for the large underlying event present in Pb+Pb collisions. The leading and sub-leading jet transverse momenta are denoted pT1 and pT2. An unfolding procedure is applied to the two-dimensional (pT1, pT2) distributions to account for experimental effects in the measurement of both jets. Distribu-tions of (1/N)dN/dxJ, where xJ= pT2/pT1, are presented as a function of pT1 and collision centrality. The distributions are found to be similar in peripheral Pb+Pb collisions and pp collisions, but highly modified in central Pb+Pb collisions. Similar features are present in both the R = 0.3 and R = 0.4 results, indicating that the effects of the underlying event are properly accounted for in the measurement. The results are qualitatively consistent with expectations from partonic energy loss models.
c
2018 CERN for the benefit of the ATLAS Collaboration.
Reproduction of this article or parts of it is allowed as specified in the CC-BY-4.0 license.
Contents
1 Introduction 2
2 Experimental set-up 3
3 Data and Monte Carlo samples 4
4 Jet reconstruction 5 5 Data analysis 6 6 Unfolding 8 7 Systematic uncertainties 12 8 Results 15 9 Conclusion 20
1 Introduction
Jets have long been considered an important tool for studying the matter produced in ultra-relativistic heavy-ion collisions. In these collisions, a hot medium of deconfined colour charges is produced, known as the quark–gluon plasma (QGP). Jets produced in the initial stage of the collision lose energy as they propogate through the medium. This phenomenon, known as jet quenching, was first observed at the Rel-ativistic Heavy Ion Collider (RHIC) [1,2]. Early measurements using fully reconstructed jets in Pb+Pb collisions at the LHC provided a direct observation of this phenomenon [3]. In Pb+Pb collisions the
trans-verse momentum (pT) balance between two jets was found to be distorted, resulting from configurations in which the two jets suffer different amounts of energy loss. This measurement was the experimental confirmation of some of the initial pictures of jet quenching and signatures of a deconfined medium [4]. Subsequent measurements of jets in Pb+Pb collisions have improved the understanding of properties of quenched jets and the empirical features of the quenching mechanism [5–14]. Significant theoretical ad-vances also occurred in this period, and while a complete description of jet quenching is not available, some models are capable of reproducing its key features and providing testable predictions. Measure-ments of the dijet asymmetry, AJ ≡ (pT1 − pT2)/(pT1 + pT2), where pT1 and pT2 are the transverse mo-menta of the jets with the highest and second highest pT in the event, respectively, have been crucial in facilitating these developments. The experimental results demonstrate that the measured asymmetries in central collisions, where the geometric overlap of the colliding nuclei is almost complete, differ from those in pp collisions more than is expected from detector-specific experimental effects [3,9,10]. How-ever, such effects, in particular the resolution of the measured jet pT, must be corrected for in order for the measurement to be directly compared to theoretical calculations. Unfolding procedures have been applied to correct for such effects for single-jet measurements [6]; however, the dijet result requires a two-dimensional unfolding to account for migration in the pT of each jet separately. The measurement reported here is the first unfolded Pb+Pb dijet measurement and as such can be directly compared to theoretical models.
This Letter presents a measurement of dijet pT correlations in Pb+Pb and pp collisions at a nucleon– nucleon centre-of-mass energy of 2.76 TeV performed with the ATLAS detector. Jets are reconstructed with the anti-kt algorithm with radius parameter values R = 0.3 and R = 0.4 [15]. The analysis is de-scribed mostly for the example of R= 0.4 jets. A background subtraction procedure is applied to account for the effects of the large underlying event (UE) present in Pb+Pb collisions on the measured jet kinemat-ics. The momentum balance of the dijet system is expressed by the variable xJ≡ pT2/pT1. Measurements of the dijet yield normalised by the total number of jet pairs in a given pT1 interval, (1/N)dN/dxJ, are presented as a function of xJin intervals of pT1 and collision centrality. The results are obtained by first measuring the two-dimensional distribution, (pT1, pT2), and unfolding in the two-dimensional space. The binning in the (pT1, pT2) distribution is chosen such that the bins in the two-dimensional space corre-spond to fixed ranges of xJ, and the (1/N)dN/dxJresults are obtained by projecting into these xJ bins. The (pT1, pT2) distributions are less strongly correlated for jets reconstructed with a smaller value of R due to the effects of parton radiation outside the jet cone, which makes them less suitable as a probe of medium-induced effects in Pb+Pb collisions. However, for smaller jet sizes the effect of the UE on the measurement is significantly reduced. It is therefore interesting to compare the results obtained using R= 0.3 and R = 0.4 jets, to see if the same features are visible.
2 Experimental set-up
The measurements presented in this Letter are performed using the ATLAS inner detector, calorimeter and trigger systems [16]. The inner detector provides measurements of charged-particle tracks over the range |η| < 2.5.1 It is composed of silicon pixel detectors in the innermost layers, followed by silicon microstrip detectors and a straw-tube tracker, all immersed in a 2 T axial magnetic field provided by a solenoid. The minimum-bias trigger scintillators (MBTS) measure charged particles over 2.1 < |η| < 3.9 using two planes of counters placed at z = ±3.6 m and provide timing measurements used in the event selection [17].
The ATLAS calorimeter system consists of a liquid argon (LAr) electromagnetic (EM) calorimeter (|η| < 3.2), a steel–scintillator sampling hadronic calorimeter (|η| < 1.7), a LAr hadronic calorimeter (1.5 < |η| < 3.2), and a forward calorimeter (FCal) (3.2 < |η| < 4.9). The hadronic calorimeter has three sampling layers longitudinal in shower depth and has a∆η × ∆φ granularity of 0.1 × 0.1 for |η| < 2.5 and 0.2 × 0.2 for 2.5 < |η| < 4.9.2 The EM calorimeters are longitudinally segmented in shower depth into three compartments following a pre-sampler layer (|η| < 1.8). The EM calorimeter has a granularity that varies with layer and pseudorapidity, but which is generally much finer than that of the hadronic calorimeter. The first layer has high η granularity (between 0.003 and 0.006) that can be used to identify photons and electrons. The middle sampling layer, which typically has the largest energy deposit in EM showers, has a granularity of 0.025 × 0.025 over |η| < 2.5. A total transverse energy (TE) trigger is implemented by requiring a hardware-based determination of the total transverse energy in the calorimeter system, EtotT , to be above a threshold.
The zero-degree calorimeters (ZDCs) are located symmetrically at z = ±140 m and cover |η| > 8.3. In Pb+Pb collisions the ZDCs primarily measure “spectator” neutrons: neutrons that do not interact 1ATLAS uses a right-handed coordinate system with its origin at the nominal interaction point (IP) in the centre of the detector
and the z-axis along the beam pipe. The x-axis points from the IP to the center of the LHC ring, and the y-axis points upward. Cylindrical coordinates (r, φ) are used in the transverse plane, φ being the azimuthal angle around the beam pipe. The pseudorapidity is defined in terms of the polar angle θ as η= − ln tan(θ/2).
hadronically when the incident nuclei collide. A ZDC coincidence trigger is implemented by requiring the pulse height from each ZDC to be above a threshold set below the single-neutron peak.
In addition to the ZDC and TE hardware-based triggers, a software-based high-level trigger is used to further reduce the accepted event rate. This trigger applies a jet reconstruction procedure, including a UE subtraction, similar to that used in the offline analysis, which is described in Section 4.
3 Data and Monte Carlo samples
The Pb+Pb data used for these measurements were recorded in 2011 and obtained using a combination of jet and minimum-bias triggers. The minimum-bias trigger is defined by a logical OR of the TE trigger with a threshold of EtotT = 50 GeV and the ZDC coincidence trigger. The combined trigger is fully efficient in the range of centralities presented here. In the events selected by the ZDC coincidence trigger alone, at least one track is required to remove empty events. The jet trigger [18] first selects events satisfying the TE trigger with a threshold of ETtot = 20 GeV. A jet reconstruction procedure is then applied using the anti-kt algorithm with R = 0.2 and utilising a UE subtraction procedure similar to that used in the offline reconstruction described in Section 4. Events with at least one jet with ET > 20 GeV at the electromagnetic scale [19] are selected by the jet trigger. The use of R = 0.2 for jets in the trigger, as opposed to the values of R= 0.3 and 0.4 applied in the measurement, is motivated by the need to define an algorithm that is robust against UE fluctuations, which grow with R. The effects of the different R values on the trigger efficiency are discussed in Section5. The minimum-bias trigger operated with a prescale of approximately 18 while no prescale was applied to the jet trigger. After accounting for these prescales, the recorded events correspond to integrated luminosities of 8 µb−1and 0.14 nb−1for the minimum-bias and jet-triggered samples, respectively.
Events are further subjected to criteria designed to remove non-collision background and inelastic elec-tromagnetic interactions between the nuclei. Events are required to have a reconstructed primary vertex and have a timing difference of less than 5 ns between the times measured by the two MBTS planes. After the trigger and event selection criteria, the resulting data samples contain 53 and 14 million events in the minimum-bias and jet triggered samples, respectively. The average number of collisions per bunch-crossing in the Pb+Pb data sample was less than 0.001, and the effects of multiple collisions are neglected in the data analysis.
The centrality of the Pb+Pb collisions is characterised by the total transverse energy measured in the FCal modules,P EFCal
T . TheP E FCal
T distribution obtained in minimum-bias collisions is partitioned into separate ranges ofP EFCal
T referred to as centrality classes [17, 20, 21]. Each class is defined by the fraction of the distribution contained by the interval, e.g. the 0–10% centrality class, which corresponds to the most central collisions, contains the 10% of minimum-bias events with the largestP EFCal
T . The centrality boundaries used in this analysis are 0%, 10%, 20%, 30%, 40%, 60% and 80%.
The pp data sample, recorded in 2013, was composed of events selected by a jet trigger and used a series of different pT thresholds each selected with a different prescale. The jet trigger is the same used in other ATLAS measurements in pp collisions [18] and applies the anti-kt algorithm with R = 0.4. The events are further required to contain at least one primary reconstructed vertex. The average number of ppcollisions per bunch-crossing varied between 0.3 and 0.6 during data taking. The sample corresponds to a luminosity of 4.0 pb−1.
The impact of experimental effects on the measurement is evaluated using the Geant4-simulated detector response [22, 23] in a Monte Carlo (MC) sample of pp hard-scattering events. Dijet events at √s = 2.76 TeV are generated using Pythia version 6.423 [24] with parameter values chosen according to the AUET2B tune [25] using the CTEQ6L1 parton distribution function (PDF) set [26]. To fully populate the kinematic range considered in the measurement, hard-scattering events are generated for separate intervals of ˆpT, the transverse momentum of outgoing partons in the 2 → 2 hard-scattering, and combined using weights proportional to their respective cross sections. Separate samples are generated for the Pb+Pb and ppanalyses, with the simulated detector conditions chosen to match those present during the recording of the respective data samples. In the pp data sample, the contribution of additional collisions in the same bunch crossing (pile-up) is accounted for by overlaying minimum-bias pp collisions produced at the same rate as in the data, generated by Pythia version 8.160 [27] using the A2 [28] tune with CT10 PDF set [29]. In the Pb+Pb sample, the UE contribution to the detector signal is accounted for by overlaying the simulated events with minimum-bias Pb+Pb data. The vertex position of each simulated event is selected to match the data event that is overlaid. Through this procedure the MC sample contains contributions from underlying-event fluctuations and harmonic flow that match those present in the data. The combined signal is then reconstructed using the same procedure as is applied to the data. So-called truth jets are defined by applying the anti-kt algorithm with R = 0.3 and R = 0.4 to stable particles in the MC event generator’s output, defined as those with a proper lifetime greater than 10 ps, but excluding muons and neutrinos, which do not leave significant energy deposits in the calorimeter.
The detector’s response to quenched jets is studied with an additional sample using Pyquen [30]. This event generator applies medium-induced energy loss to parton showers produced by Pythia. It is used to generate a sample of jets with fragmentation functions that differ from those in the nominal Pythia sample in a fashion consistent with measurements of fragmentation functions in quenched jets [11–13].
4 Jet reconstruction
The procedure used to reconstruct jets in heavy-ion collisions is described in detail in Ref. [5] and is briefly summarised here. First, energy deposits in the calorimeter cells are assembled into∆η×∆φ = 0.1×
π
32 logical towers. Jets are formed from the towers by applying the anti-ktalgorithm [15] as implemented in the FastJet software package [31].
An estimate of the UE contribution to each tower within the jet is performed on an event-by-event basis by estimating the transverse energy density, ρ(η, φ). Global azimuthal modulation in the UE arises due to the physics of flow and is traditionally described in terms of the Fourier expansion of the φ dependence of the transverse energy density. In the subtraction procedure, the UE estimate is assigned a φ dependence using the measured magnitudes and phases of the modulation:
ρ(η, φ) = ρ(η) × 1+ 2 X n vncos[n(φ −Ψn)] , (1)
where vnandΨnare the magnitudes and phases of the harmonic modulation, respectively, and ρ(η) is the average transverse energy density measured from energy deposits in the calorimeter as a function of η. In Ref. [5], only the second-order harmonic modulation (n= 2) was considered, but in this measurement the procedure has been extended to account for n= 3 and 4 harmonic modulations as well. The subtraction is applied to each tower within the jet. The quantities in Eq. (1) may be biased if the energy in a jet is included in their calculation, which results in an over-subtraction of the average UE contribution to the
jet energy or incomplete removal of the harmonic modulation. To mitigate such effects, the contribution from jets is excluded from the estimate of the background. The typical background energy subtracted from the jets varies from a few GeV in peripheral collisions to 150 GeV in the most central collisions. A calibration factor, derived from MC studies, is then applied after the subtraction to account for the non-compensating hadronic response. A final in situ calibration is applied to account for known differences in detector response between data and the MC sample used to derive the initial calibration [32]. This calibration is derived in 8 TeV pp data and adapted to the different beam energy and pile-up conditions relevant for the samples considered here. It uses the balance between jet pairs in different η regions of the detector to provide an evaluation of the relative response to jets as a function of η. It subsequently uses jets recoiling against objects with an independently-determined energy scale such as Z bosons or photons to provide constraints on the absolute energy measurement.
5 Data analysis
In this analysis, jet pairs are formed from the two highest-pT jets in the event with pT > 25 GeV and |η| < 2.1. The pair is required to have ∆φ > 7π/8, where ∆φ ≡ |φ1 −φ2|. For events selected by a jet trigger, the leading jet is required to match a jet identified by the trigger algorithm responsible for selecting the jet. The two-dimensional (pT1, pT2) distributions obtained from different triggered samples are combined such that intervals of pT1 are populated by a single trigger. In the pp data analysis, the trigger with the most events that is more than 99% efficient for selecting a jet with pT > pT1 is used, with the reciprocal of the luminosity for the respective trigger samples used as a weight.
The Pb+Pb jet trigger efficiency has a broad turn-on as a function of pTsince the trigger jets are identified using R= 0.2 and have no energy scale calibration applied. This effect is the strongest in central collisions where the UE fluctuations are the largest and further weaken the correlation between jets reconstructed with different values of R. In the most central collisions, the single-jet-trigger efficiency does not reach a plateau until pT ∼ 90 GeV. The jet-triggered sample is used where the efficiency is found to be greater than 97%, which occurs at a pTof approximately 85 GeV in the most central collisions. A trigger efficiency correction is applied in the region where there is an inefficiency.
In addition to the dijet signal, the measured (pT1, pT2) distribution receives contributions from so-called combinatoric jet pairs. Such pairs arise when two jets, which are not from the same hard-scattering process, fulfill the pair requirements through random association. Jets forming such pairs may originate from independent hard scatterings or from upward UE fluctuations identified as jets, referred to as UE jets. The rate for such occurrences is highest in the most central collisions, and the reduction in the true sub-leading jet pT due to quenching effects further enhances the likelihood of forming a combinatoric pair.
The shape of the∆φ distribution for the combinatoric jet pairs is influenced by the harmonic flow. Since the jet pT spectrum falls steeply, the jets most likely to be measured at a given pT value are those lying on top of larger-than-average UE. If the effects of the modulation of the UE are not fully accounted for in the background subtraction, more jets would be observed at angles corresponding to the flow maxima (φ ∼ Ψn). Thus combinatoric jet pairs, without any underlying angular correlation, are expected to ac-quire a modulation to their∆φ distribution determined by the dominant flow harmonics [33]. Although the second-, third- and fourth-order harmonic modulations are considered event-by-event in the jet re-construction procedure described in Section4, only the effects of the second-order modulation on the ∆φ
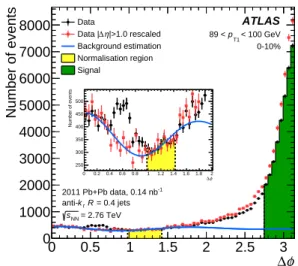
φ ∆ 0 0.5 1 1.5 2 2.5 3 Number of events 0 1000 2000 3000 4000 5000 6000 7000 8000 ATLAS 0-10% < 100 GeV T1 p 89 < Data |>1.0 rescaled η ∆ Data | Background estimation Normalisation region Signal φ ∆ 0 0.2 0.4 0.6 0.8 1 1.2 1.4 1.6 1.8 2 Number of events 250 300 350 400 450 500 -1 2011 Pb+Pb data, 0.14 nb = 0.4 jets R t k = 2.76 TeV NN s
Figure 1: The∆φ distribution for R = 0.4 jet pairs with 89 < pT1< 100 GeV in the 0–10% centrality interval. The
distribution for all jet pairs is indicated by the black circles. The combinatoric contribution given by Eq. (2) is shown as a blue line. The ranges of∆φ used to fix the value of Y and to define the signal region (∆φ > 7π8) are indicated by yellow and green shaded regions, respectively. The parameters c3and c4are obtained by fitting the∆φ distribution for jet pairs with |∆η| > 1 in the region 0 < ∆φ < π2, which is indicated by the red squares (scaled to match the black circles in the yellow region for presentation purposes). The error bars denote statistical errors.
distribution are observed to be completely removed. The residual effects are an indication that the method of estimating the modulation of the UE underneath the jet is less accurate for the higher-order harmonics than for n= 2.
To account for the residual modulation, the combinatoric contribution is assumed to be of the form:
C(∆φ) = Y(1 + 2c3cos 3∆φ + 2c4cos 4∆φ) . (2)
The c3 and c4 values are determined by fitting the∆φ distributions over the range 0 < ∆φ < π/2 where the real dijet contribution is expected to be small. The region 0 <∆φ . 0.8 is also expected to receive real dijet contributions arising from parton radiation which results in pairs of jets at nearby angles. To remove this contribution, the fit to obtain c3and c4is performed only using jet pairs with a separation of |∆η| > 1. Once c3and c4are obtained, the∆φ distribution without this |∆η| requirement is integrated over the range 1 <∆φ < 1.4 to obtain Y. This procedure is performed separately in each (pT1, pT2) interval. In intervals where the c3and c4are found to not be statistically significant their values are taken to be zero. The expected combinatorial contribution, B, in the signal region is obtained by integrating C(∆φ) from 7π/8 to π.
The∆φ distribution of jet pairs is shown in Figure 1 for pairs with 89< pT1< 100 GeV in the 0–10% centrality interval. Also shown is the∆φ distribution obtained from such jet pairs with |∆η| > 1, which is fitted to obtain c3and c4. The background subtraction is most significant in central collisions, where the fraction subtracted from the total yield in the signal region is as large as 10% for small xJand is less than 1% for xJvalues greater than 0.5. The background contribution in more peripheral collisions is less than 1% for all values of xJ. This background subtraction is not applied in the pp data because the pile-up is small.
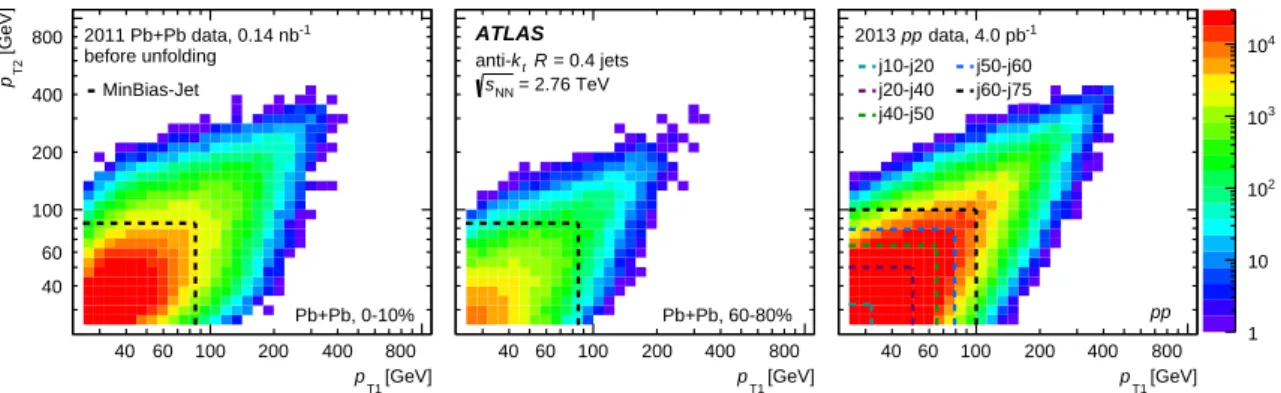
[GeV] T1 p [GeV] T2 p -1 2011 Pb+Pb data, 0.14 nb before unfolding Pb+Pb, 0-10% 40 40 60 60 100 100 200 200 400 400 800 800 MinBias-Jet [GeV] T1 p ATLAS = 0.4 jets R t k = 2.76 TeV NN s Pb+Pb, 60-80% 40 60 100 200 400 800 [GeV] T1 p -1 data, 4.0 pb pp 2013 pp j10-j20 j20-j40 j40-j50 j50-j60 j60-j75 40 60 100 200 400 800 1 10 2 10 3 10 4 10
Figure 2: The two-dimensional (pT1, pT2) distributions after correction and symmetrisation for Pb+Pb data in the
0–10% (left) and 60–80% (centre) centrality bins and for pp data (right) for R = 0.4 jets. The dashed lines indicate the boundaries used in selecting the different triggers. The Pb+Pb data distributions have their combinatoric contribution subtracted.
The presence of combinatoric jet pairs also reduces the efficiency for genuine pairs. The measured inclu-sive jet spectrum is used to estimate the likelihood that another jet in the event, uncorrelated with the dijet system, is measured with a transverse momentum greater than pT2. For the 40–60% and 60–80% central-ity intervals the effect is negligible. In the 0–10% centralcentral-ity bin the efficiency is approximately 0.9 for pT2 = 25 GeV and increases with pT2, reaching unity at 45 GeV. The effects of the combinatoric jet pairs are accounted for by first subtracting the estimated background and then correcting for the efficiency, ε, in each (pT1, pT2) bin. The number of jet pairs corrected for such effects is defined to be:
Ncorr= 1
ε(Nraw− B),
where Nrawis the number of jet pairs after correcting for trigger efficiency and luminosity/prescale weight-ing as described above.
In a given event, the pTresolution may result in the jet with the highest true pT being measured with the second highest pTand vice-versa. To properly account for such migration effects, (pT1, pT2) distributions are symmetrised prior to the unfolding by apportioning half of the yield in a given (pT1, pT2) bin, after combinatoric subtraction, to the bin related to the original by pT1 ↔ pT2. The two-dimensional distri-butions after symmetrisation are shown in Figure2for central and peripheral Pb+Pb collisions and for ppcollisions. The choice of binning in (pT1, pT2) is motivated by the mapping to the xJvariable, and is described in more detail in the following section.
6 Unfolding
The calorimetric response to jets is evaluated in the MC sample by matching truth and reconstructed jets; the nearest reconstructed and truth jets within∆R = p(∆η)2+ (∆φ)2of 0.3 are considered to be a match. The same requirement is applied in both the R= 0.3 and R = 0.4 versions of the analysis. The response is typically characterised in terms of the jet energy scale (JES) and jet energy resolution (JER). These quantities describe the mean and width of the precoT distributions at fixed ptruthT , expressed as a fraction of ptruthT . Generally, the mean of precoT differs from ptruthT by less than a percent, independent of ptruthT and centrality. This indicates that the subtraction of the average UE contribution to the jet energy is under
good experimental control. The JER receives contributions both from the response of the calorimeter and from local UE fluctuations about the mean in the region of the jet. The latter contribution dominates at low pT with the resolution as large as 40% at pT ' 30 GeV in the most central collisions. At the same pT, the JER is only 20% in peripheral collisions, similar to that in pp collisions. At larger pT values the relative contribution of the UE fluctuations to the jet pTdiminishes, and the JER is dominated by detector effects, reaching a constant, centrality-independent value of 8% for pT> 300 GeV.
The migration in the two-dimensional (pT1, pT2) distribution is accounted for by applying a two-dimensional Bayesian unfolding to the data [34,35]. This procedure utilizes a response matrix obtained by applying the same pair selections to the truth jets in MC simulation as in the data analysis (except the trigger re-quirement) and recording the values of ptruthT
1 and p
truth
T2 and the transverse momenta of the corresponding reconstructed jets precoT
1 and p
reco
T2 . The matched reconstructed jets are not required to have the highest pT in the event, but are subject to all other requirements applied to the data and truth jets. The response matrix is populated symmetrically in both truth and reconstructed pT. The full four-dimensional response behaves similarly to the factorised product of separate single-jet response distributions, and the migration effects can be understood in terms of the above discussion. While this provides intuition for the nature of the unfolding problem, such a factorisation is not explicitly assumed, and any correlations between the response of the two jets are accounted for in the procedure.
After unfolding, the leading/sub-leading distinction is restored by reflecting the distribution over the line pT1 = pT2: for each bin with pT2 > pT1 the yield is moved to the corresponding bin with pT2 < pT1. The bins along the diagonal, e.g. those containing pairs with pT2 = pT1, are not affected by this procedure. The two-dimensional distribution is constructed using binning along each axis such that the upper edge of the ithbin obeys,
pT i= pT 0αi, α = pT N pT 0
!1/N ,
where N is the total number of bins and pT 0and pT Nare the minimum and maximum bin edges covered by the binning, respectively. As a consequence, the bins are of the same size when plotted with loga-rithmic axes. With these choices of binning, the range of xJ values in any given (pT1, pT2) bin is fully contained within two adjacent xJbins, which have boundaries at xJ i = αi−N. In this analysis, half of the yield in each (pT1, pT2) bin is apportioned to each of the xJbins. The exceptions are the bins along the diagonal. These bins contribute solely to the xJbin with bin edges (α−1, 1). The effects of such a mapping on the xJdistribution are studied and found to not significantly distort the shape of the distribution for a variety of input xJdistributions.
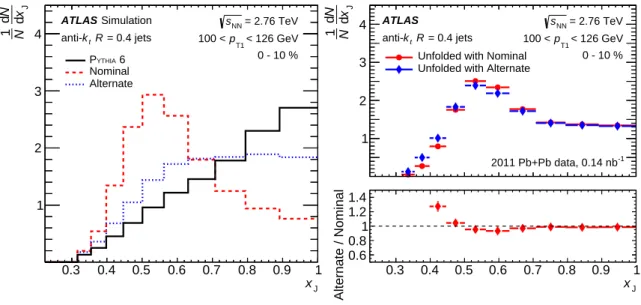
The Bayesian unfolding method is an iterative procedure that requires both a choice in a number of iterations, niter, and assumption of a prior for the underlying true distribution. An increase in niterreduces sensitivity to the choice of prior but may amplify statistical fluctuations that are already present in the input distribution. As Pythia does not include the effects of jet quenching, the xJdistributions obtained from the MC sample are not expected to be optimal choices for the prior. In particular, the xJdistributions in Pythia increase monotonically with xJ, whereas the distributions in the data become flatter and develop a peak near xJ∼ 0.5 in lower pT1 intervals and in the most central collisions. The (pT1, pT2) distributions from Pythia are reweighted in a centrality-dependent way to obtain features that qualitatively match those present in the data.
The effects of the reweighting procedure are shown in the left panel of Figure 3 in the 100 < pT1 < 126 GeV range and 0–10% centrality interval, where the largest difference between the data and Pythia is observed. The “nominal” distribution, or the reweighted distribution, is used as the prior in the unfolding
J x 0.3 0.4 0.5 0.6 0.7 0.8 0.9 1 J x d N d N 1 1 2 3 4 6 YTHIA P Nominal Alternate Simulation ATLAS = 0.4 jets R t k anti- < 126 GeV T1 p 100 < 0 - 10 % = 2.76 TeV NN s J x J x d N d N 1 1 2 3 4 -1 2011 Pb+Pb data, 0.14 nb ATLAS = 0.4 jets R t k anti- < 126 GeV T1 p 100 < 0 - 10 % = 2.76 TeV NN s
Unfolded with Nominal Unfolded with Alternate
J x 0.3 0.4 0.5 0.6 0.7 0.8 0.9 1 Alternate / Nominal 0.6 0.8 1 1.2 1.4
Figure 3: Left: the (1/N)dN/dxJ distributions used as priors in the unfolding of the R= 0.4 jets for the nominal (dashed red) and alternate variation (dotted blue) for the 100 < pT1 < 126 GeV and 0–10% centrality interval.
The same distribution obtained from the Pythia MC sample is shown in solid black. Right: unfolded (1/N)dN/dxJ distributions from data for the same pT1 and centrality ranges using the nominal (red circles) and alternate (blue
diamonds) priors shown in the left panel. The ratio of nominal to alternate is shown in the bottom panel. In the bottom panel on the right the first two bins are off scale with bins centers of xJ=0.34 and 0.38 and bins contents of 2.49 and 1.82, respectively. Statistical errors are not shown.
of the data. An “alternate” reweighting is also shown, which has a shape significantly different from the nominal, but does not increase as much as the Pythia distribution. The features in the data are observed to be robust with respect to the choice of prior for a broad set of reweighting functions. The systematic uncertainty due to the choice of prior is estimated by comparing the results of the unfoldings using the “nominal" and “alternate” xJdistributions. The results of applying unfoldings with these two choices of priors are shown in the right panels of Figure3for the same pT1 and centrality selection.
An alternative study is performed in the MC sample to validate the estimation of this uncertainty. The “alternate" reweighting is applied to obtain input truth and reconstructed distributions in which no peak structure is present. The reconstructed distribution is then unfolded using the nominal prior. The unfolded distribution does not develop the strong peak present in the nominal prior. The differences between the unfolded result and the input truth distribution are similar to the uncertainty obtained by varying the prior used to unfold the data.
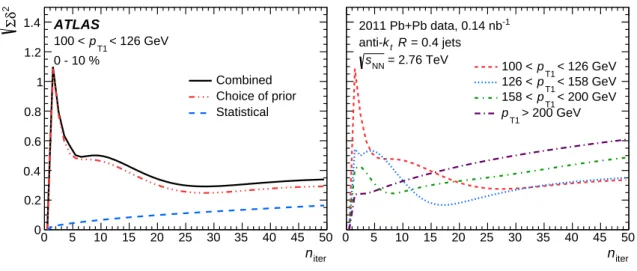
The value of niteris selected separately in each centrality interval by examining the uncertainty, √
Σδ2, in (1/N)dN/dxJafter unfolding considering statistical uncertainties and systematic uncertainties attributed to the unfolding procedure,
δ2 = δ2
stat+ δ2prior,
and summing over all xJ bins. Here δprior is the uncertainty due to the choice of prior, obtained using the procedure described above. The statistical uncertainties are evaluated using a pseudo-experiment technique. Stochastic variations of the data are generated based on its statistical uncertainty and each variation is unfolded and projected into xJ. The statistical covariance of the set is taken as the statistical
iter n 0 5 10 15 20 25 30 35 40 45 50 2 δΣ 0 0.2 0.4 0.6 0.8 1 1.2 1.4 Combined Choice of prior Statistical ATLAS < 126 GeV T1 p 100 < 0 - 10 % iter n 0 5 10 15 20 25 30 35 40 45 50 < 126 GeV T1 p 100 < < 158 GeV T1 p 126 < < 200 GeV T1 p 158 < > 200 GeV T1 p -1 2011 Pb+Pb data, 0.14 nb = 0.4 jets R t k = 2.76 TeV NN s
Figure 4: Uncertainties sensitive to the number of iterations in the unfolding procedure as a function of niterfor the 0–10% centrality interval for R= 0.4 jets. Left: The combination (solid black) of the unfolding (dashed red) and statistical (dotted blue) uncertainty,
√
Σδ2for the 100 < p
T1< 126 GeV interval. Right: The combined uncertainty
for each pT1interval considered in the measurement.
uncertainty. An additional covariance is obtained from applying the pseudo-experiment procedure to the response matrix and combined with that obtained from applying the procedure to the data. The δ2stat for each xJ bin is taken to be the diagonal element of the resulting covariance matrix. The statistical covariance matrices exhibit similar trends across all pT1 and centrality ranges. Nearby xJ bins show a strong positive correlation that diminishes for bins separated in xJ, and is expected from the effects of the procedures for unfolding and mapping to xJ. Bins well separated in xJshow an anti-correlation attributable to the normalisation of (1/N)dN/dxJ.
The left panel of Figure4shows √
Σδ2 as a function of n
iter along with its various contributions for the 100 < pT1 < 126 GeV range and 0–10% centrality interval. Since the unfolding is performed in two dimensions, the value of nitercannot be chosen separately for each range of pT1. At higher values of pT1 the effects of the unfolding are smaller while the effects of the statistical fluctuations can be more severe. The right panel of Figure4shows the total
√
Σδ2 for each range of p
T1 considered in the measurement along with the total combined over all pT1 ranges. The value of niterfor each centrality bin and R value is chosen by considering the niterdependence of
√
Σδ2for each p
T1 bin and selecting a value that maintains comparable uncertainties across all pT1 ranges. The more central bins require the most iterations, resulting from the larger jet energy resolution in these events. The number of iterations for R= 0.4 jets is at most 20 for 0–10% centrality and at the least 6 for 60-80% centrality. The √Σδ2distributions for R= 0.3 jets show behaviour similar to those for R= 0.4 jets in the same centrality bin.
It is possible for a third jet present in the event to be reconstructed as the jet with the second highest pT through the experimental resolution. As a check to study the impact of such effects on the measurement, an alternative response matrix is constructed where no∆R matching is required between the truth and reconstructed jets. A weighting is applied such that the pT distribution of the reconstructed third jet matches that observed in the data. Differences between the unfolded distributions obtained with this response matrix and the nominal one are observed to be small and well within the systematic uncertainty associated with the unfolding procedure.
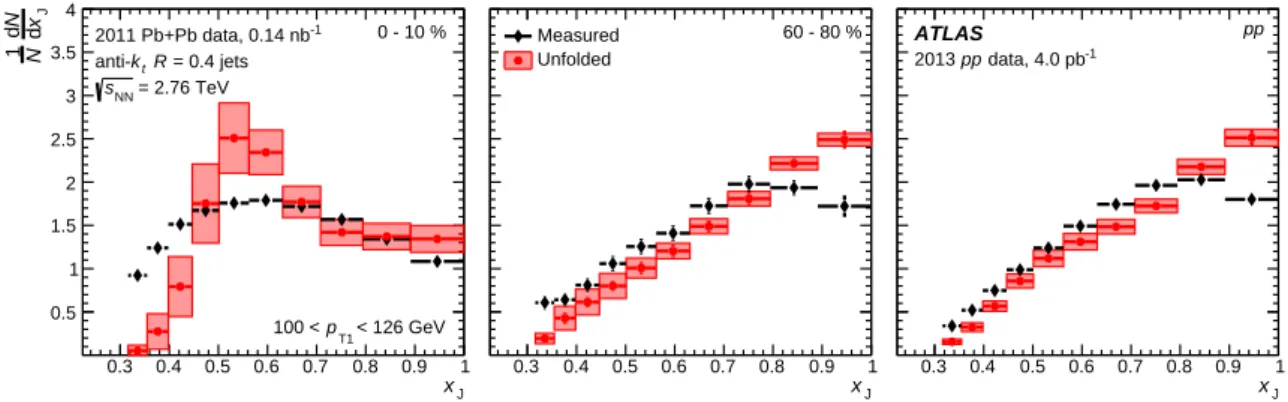
J x 0.3 0.4 0.5 0.6 0.7 0.8 0.9 1 J x d N d N 1 0.5 1 1.5 2 2.5 3 3.5 4 0 - 10 % < 126 GeV T1 p 100 < -1 2011 Pb+Pb data, 0.14 nb = 0.4 jets R t k = 2.76 TeV NN s J x 0.3 0.4 0.5 0.6 0.7 0.8 0.9 1 60 - 80 % Measured Unfolded J x 0.3 0.4 0.5 0.6 0.7 0.8 0.9 1 pp ATLAS -1 data, 4.0 pb pp 2013
Figure 5: The (1/N)dN/dxJ distributions for R = 0.4 jets before (black) and after (red) unfolding for the 100 < pT1 < 126 GeV interval for the Pb+Pb 0–10% (left) and Pb+Pb 60–80% (middle) centrality ranges and for pp
collisions (right). Statistical uncertainties are indicated by vertical error bars (not visible in most cases). Systematic uncertainties in the unfolded result are indicated by the red shaded boxes.
Pb+Pb collisions and for pp collisions for jet pairs with 100 < pT1 < 126 GeV. The systematic uncertain-ties indicated contain all of the contributions to the total systematic uncertainty described in Section7. In the pp and 60–80% centrality interval, the resolution effects before unfolding reduce the sharpness of the peak near xJ∼ 1. In the case of the 0–10% centrality interval, the effect is to smear out the peak near xJ∼ 0.5. The lowest xJbins exhibit instability in the unfolding procedure due to the MC sample having too few events in this region. However, including this range in the unfolding improves the stability of the adjacent xJbins. Thus, after unfolding, only the range 0.32 < xJ< 1 is reported in the results even though pairs with pT2 > 25 GeV are included in the measurement.
7 Systematic uncertainties
Systematic uncertainties attributed to the response matrix used in the unfolding arise due to uncertainties in the JES and JER. To account for these effects, new response matrices are constructed with a systemat-ically varied relationship between the truth and reconstructed jet kinematics. The data are then unfolded using the new response and the result is compared with the nominal.
In the pp data analysis, the JES uncertainty is described by a set of 11 independent nuisance parameters; these include effects from uncertainties derived through the in situ calibration [32]. In the MC sample used to determine the calibration, the calorimetric response to jets initiated by the fragmentation of quarks and gluons is observed to differ. Potential inaccuracies in the MC sample describing both this flavour-dependent response and the relative abundances of quark and gluon jets are accounted for using separate nuisance parameters. A source of uncertainty related to the adaptation of the in situ calibration derived at √
s= 8 TeV to 2.76 TeV data is also included.
In the Pb+Pb data analysis, two additional uncertainties in the JES are considered. The first accounts for differences between the detector operating conditions in the Pb+Pb and pp data, which were recorded in 2011 and 2013, respectively. This is derived by using charged-particle tracks reconstructed in the inner detector to provide an independent check on the JES, which only uses information from the calorimeter. For each jet, all reconstructed tracks within∆R < 0.4 and having ptrkT > 2 GeV, are matched to the jet and the scalar sum of the track transverse momenta is evaluated. The ratio of this sum to the jet’s pT is
evaluated both in data and in the MC sample, and a double ratio of the two quantities is formed. The double ratio obtained in peripheral Pb+Pb data is compared with that in pp data. The precision of the comparison is limited by having too few events in the peripheral Pb+Pb data and at high jet pT, and a pT -and η-independent uncertainty of 1.46% is assigned to account for potential differences.
The second additional uncertainty is a centrality-dependent JES uncertainty to account for potential dif-ferences in the detector response to quenched jets. This is estimated by comparing the detector response evaluated in the Pythia and Pyquen MC samples. This estimate is checked in data using a track-based study similar to the one described above, but comparing central and peripheral Pb+Pb collisions and ac-counting for the measured variation of the fragmentation function with centrality [11–13]. An uncertainty of up to 1% in the most central collisions and decreasing linearly with centrality percentile to 0% in the 60–80% centrality class is assigned.
The uncertainty attributed to the JER is obtained by adding Gaussian fluctuations to each reconstructed jet pTvalue when populating the response matrix. The magnitude of this uncertainty is fixed by a compari-son of the data and MC descriptions of the JER in 8 TeV data [36]. Since the MC sample is constructed using the data overlay procedure, it is expected that the centrality dependence of the JER should be well described in the MC sample. This is checked by studying the distribution of UE fluctuations using ran-dom, jet-sized groups of calorimeter towers in Pb+Pb data. The standard deviations of these distributions describe the typical UE contribution beneath a jet. The centrality dependence of the UE fluctuations is compared to that of the JER in the MC sample, and a systematic uncertainty is included to account for the observed differences. As expected, these differences are much smaller than the centrality-independent contribution to the JER uncertainty.
The data-driven estimates of the JES and JER uncertainties described above are derived using R= 0.4 jets. Additional uncertainties are included in the R= 0.3 jet measurement to account for potential differences between data and the MC sample in the relative energy scale of R = 0.3 jets with respect to R = 0.4 jets. These uncertainties are estimated from a study that matched jets reconstructed with the two R values and compared the means of the pRT=0.3/pRT=0.4distributions in data and the MC sample. Differences may arise between the data and MC sample from differences in the calorimetric response or because the jets in the two samples have different internal structure. The contribution of the latter is constrained by using existing jet shape measurements [37]. An uncertainty in the energy scale is applied to account for residual differences, which are 1.5% at the lowest pTand decrease sharply as a function of pTto a limiting value of 0.3% at high pT. A similar study comparing the variances of the pRT=0.3/pRT=0.4distributions is used to constrain the uncertainty in the relative resolution. This uncertainty is applied in the R= 0.3 jet measurement in the same fashion as the other JER uncertainties described above. Although larger than the centrality-dependent contribution, it is also much smaller than the centrality-independent contribution. As the response matrix is sparsely populated (containing 404bins), statistical fluctuations could introduce instabilities in the unfolding. To evaluate the sensitivity to such effects, along with any other defects in the response, a new response matrix is constructed as a factorised product of single-jet response distributions, i.e. assuming the responses in pT1and pT2are independent. The data are unfolded using this new response and the differences between the unfolded distributions are taken as a systematic uncertainty. Systematic uncertainties in the unfolding due to the choice of prior are estimated as described in the previous section and are also included.
Uncertainties due to the correction for the combinatoric effects described in Section5affect the number of
jet pairs before the unfolding and are thus included as additional contributions to the previously described statistical uncertainties in the data. These include statistical uncertainties in ε and the uncertainties in the
J x 0.4 0.5 0.6 0.7 0.8 0.9 1 J x d N d N 1 Relative error in 0 0.1 0.2 0.3 0.4 0.5 0.6 0 - 10 % -1 2011 Pb+Pb data, 0.14 nb < 126 GeV T 1 p 100 < Total JES JER Unfolding Combinatoric J x 0.4 0.5 0.6 0.7 0.8 0.9 1 pp -1 data, 4.0 pb pp 2013 = 0.4 jets R t k = 2.76 TeV NN s ATLAS
Figure 6: The total systematic uncertainty and its various components for 100 < pT1 < 126 GeV for R = 0.4 jets in
Pb+Pb collisions with 0–10% centrality (left) and pp collisions (right). In the figure on the left the first two bins are off scale with bins centers of xJ=0.34 and 0.38 and bins contents of 1.25 and 0.75, respectively.
values of the fit parameters c3and c4, accounting for their covariance. Uncertainties in the normalisation are estimated by varying the region of∆φ used to estimate Y from 1.0–1.4 to 1.1–1.5. The uncertainty due to this correction is smaller than the other uncertainties in all pT and centrality bins, and is only greater than 5% at values of xJ< 0.4. This correction was not applied to the pp data so there is no corresponding systematic uncertainty.
The breakdown of different contributions to the total systematic uncertainty is shown in the 100 < pT1 < 126 GeV range for the 0–10% centrality interval and for pp collisions in Figure6. Each contribution to the uncertainty, and thus the total uncertainty, tends to decrease with increasing xJ. The total uncertainty at xJ ∼ 1 reaches approximately 12% in most pT1 and centrality bins in the Pb+Pb data. For xJ < 0.4, the relative uncertainty becomes large, but this region represents only a small contribution to the total (1/N)dN/dxJdistribution. The JER uncertainty is the largest contribution. In the Pb+Pb data it reaches values of approximately 10% and 15% at xJ ∼ 1 and xJ = 0.5, respectively. The JES contributions are the second largest contribution to the uncertainties, typically between 5% and 10%. In the most central bins the unfolding uncertainty can become as large as the JES contribution. The contributions to the uncertainty in the other centrality intervals and in the pp data follow trends similar to those described for the 0–10% centrality interval, but the magnitudes are smaller in more peripheral collisions. In the pp data they are typically smaller by a factor of two compared to the 0–10% Pb+Pb data. The uncertainties for the R= 0.3 result follow the same trends as those for the R = 0.4 result but are slightly larger due to the two additional sources included in that measurement to describe the relative energy scale and resolution between the two R values.
J
x
d
N
d
N
1
0
1
2
3
4
< 126 GeV
T1p
100 <
ATLAS
= 0.4 jets
R
tk
= 2.76 TeV
NNs
-1data, 4.0 pb
pp
2013
6
YTHIAP
Pythia 8
Herwig++
Powheg+Pythia 8
Jx
0.3
0.4
0.5
0.6
0.7
0.8
0.9
1
MC/Data
0.6
0.8
1
1.2
1.4
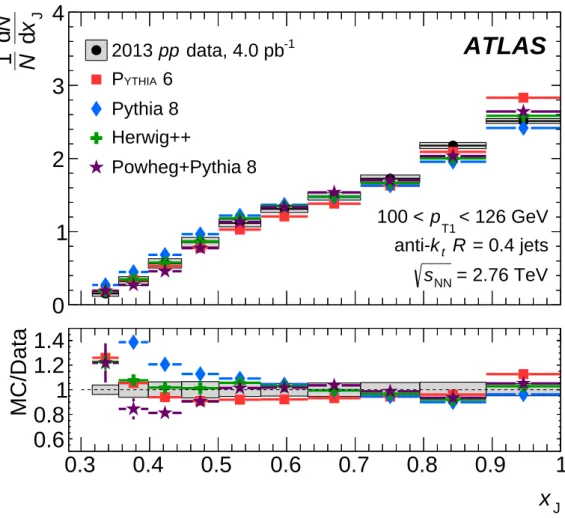
Figure 7: The (1/N)dN/dxJdistribution for R= 0.4 jets in pp collisions for the 100 < pT1 < 126 GeV interval is
shown in black points with the grey shaded boxes indicating the systematic uncertainties. Also shown are results obtained from various MC event generators: Pythia 6 (red squares), Pythia 8 (blue diamonds), Herwig++ (green crosses) and Powheg+Pythia 8 (purple stars). The ratio of each MC result to the data is shown in the bottom panel where the systematic uncertainties of the data are indicated by a shaded band centred at unity.
8 Results
The unfolded (1/N)dN/dxJdistribution in pp collisions for 100 < pT1 < 126 GeV is shown in Figure7. Also shown are the corresponding distributions obtained from the Pythia 6 sample used in the MC stud-ies and also from Pythia 8 using the AU2 tune and Herwig++ [38] with the UE-EE-3 [39] tune. An additional sample, referred to as Powheg+Pythia 8 is generated using Powheg-Box 2.0 [40–42], which is accurate to next-to-leading order in perturbative QCD, and interfaced with Pythia 8 to provide a descrip-tion of the parton shower and hadronisadescrip-tion. All samples used the CTEQ6L1 PDF set [26] except the Powheg+Pythia 8, which used the CT10 PDF set [29]. All four models describe the data fairly well with the Herwig++ and Powheg+Pythia 8 showing the best agreement over the full xJrange.
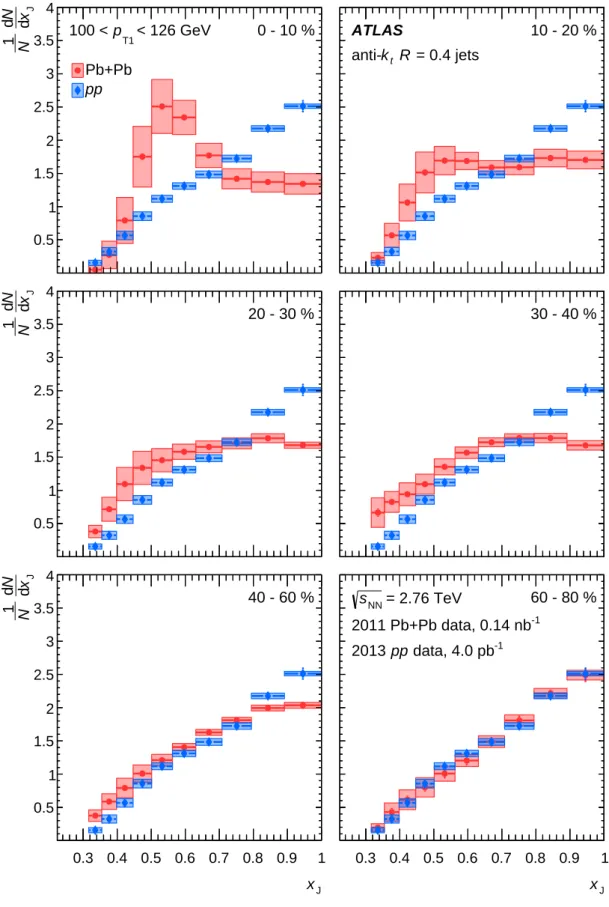
J x d N d N 1 0.5 1 1.5 2 2.5 3 3.5 4 < 126 GeV T1 p 100 < 0 - 10 % Pb+Pb pp 10 - 20 % ATLAS = 0.4 jets R t k anti-J x d N d N 1 0.5 1 1.5 2 2.5 3 3.5 4 20 - 30 % 30 - 40 % J x 0.3 0.4 0.5 0.6 0.7 0.8 0.9 1 J x d N d N 1 0.5 1 1.5 2 2.5 3 3.5 4 40 - 60 % J x 0.3 0.4 0.5 0.6 0.7 0.8 0.9 1 60 - 80 % = 2.76 TeV NN s -1 data, 4.0 pb pp 2013 -1 2011 Pb+Pb data, 0.14 nb
Figure 8: The (1/N)dN/dxJdistributions for jet pairs with 100 < pT1 < 126 GeV for different collision centralities
J x d N d N 1 0.5 1 1.5 2 2.5 3 3.5 4 < 126 GeV T1 p 100 < 0 - 10 % Pb+Pb pp < 158 GeV T1 p 126 < ATLAS = 0.4 jets R t k anti-J x 0.3 0.4 0.5 0.6 0.7 0.8 0.9 1 J x d N d N 1 0.5 1 1.5 2 2.5 3 3.5 4 < 200 GeV T1 p 158 < J x 0.3 0.4 0.5 0.6 0.7 0.8 0.9 1 > 200 GeV T1 p = 2.76 TeV NN s -1 data, 4.0 pb pp 2013 -1 2011 Pb+Pb data, 0.14 nb
Figure 9: The (1/N)dN/dxJ distributions for R = 0.4 jets with different selections on pT1, shown for the 0–10%
centrality bin (red circles) and for pp (blue diamonds). Statistical uncertainties are indicated by the error bars while systematic uncertainties are shown with shaded boxes.
The unfolded (1/N)dN/dxJ distributions in Pb+Pb collisions are shown in Figure 8, for jet pairs with 100 < pT1 < 126 GeV for different centrality intervals. The distribution in pp collisions is shown on each panel for comparison. In the 60–80% centrality bin, where the effects of quenching are expected to be the smallest, the Pb+Pb data are consistent with the pp data. In more central Pb+Pb collisions, the distributions become significantly broader than that in pp collisions and the peak at xJ∼ 1, corresponding to nearly symmetric dijet events, is reduced. At lower centrality percentiles the distribution becomes almost constant over the range 0.6 . xJ . 1, and develops a peak at xJ ∼ 0.5 in the 0–10% centrality interval.
Figure9 shows the (1/N)dN/dxJ distributions for 0–10% centrality Pb+Pb collisions and pp collisions for different selections on pT1. In pp collisions, the xJ distribution becomes increasingly narrow with increasing pT1, indicating that higher-pTdijets tend to be better balanced in momentum (fractionally). At higher pT1, the xJdistribution begins to fall more steeply from xJ∼ 1, but appears to flatten at intermediate values of xJ. The modifications observed in the Pb+Pb data lessen with increasing pT1 and for jet pairs with pT1 > 200 GeV the maximum at xJ∼ 1 is restored.
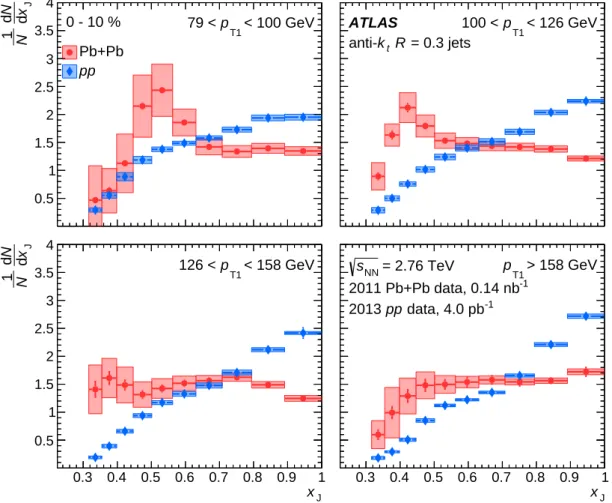
J x d N d N 1 0.5 1 1.5 2 2.5 3 3.5 4 < 100 GeV T1 p 79 < 0 - 10 % Pb+Pb pp < 126 GeV T1 p 100 < ATLAS = 0.3 jets R t k anti-J x 0.3 0.4 0.5 0.6 0.7 0.8 0.9 1 J x d N d N 1 0.5 1 1.5 2 2.5 3 3.5 4 < 158 GeV T1 p 126 < J x 0.3 0.4 0.5 0.6 0.7 0.8 0.9 1 > 158 GeV T1 p = 2.76 TeV NN s -1 data, 4.0 pb pp 2013 -1 2011 Pb+Pb data, 0.14 nb
Figure 10: The (1/N)dN/dxJdistributions for R= 0.3 jets with different selections on pT1, shown for the 0–10%
centrality bin (red circles) and for pp (blue diamonds). Statistical uncertainties are indicated by the error bars while systematic uncertainties are shown with shaded boxes.
for different pT1 ranges in Figure10. The pT of an R= 0.3 jet is generally lower than that of an R = 0.4 jet originating from the same hard scattering, and thus features observed in the (1/N)dN/dxJdistributions for R= 0.4 jets are expected to appear at lower values of pT1 for R= 0.3 jets. To facilitate a comparison between results obtained with the two R values, the R = 0.3 jet results include an additional pT1 inter-val, 79 < pT1 < 100 GeV. The differences between the Pb+Pb and pp (1/N)dN/dxJ distributions are qualitatively similar to those observed for R = 0.4 jets. Figure11shows the (1/N)dN/dxJdistributions for 79 < pT1 < 100 GeV for different collision centralities but for jets reconstructed with R = 0.3. This indicates that the trends present in pT1 and centrality are robust with respect to the UE and that UE effects are properly accounted for by the combinatoric subtraction and unfolding procedures applied in the data analysis. The distributions are flatter for R= 0.3 jets in all pT and centrality bins, including in pp colli-sions. This is consistent with the expectation that the (pT1, pT2) correlation is weaker for smaller-R jets due to the effects of parton radiation outside the nominal jet cone.
J x d N d N 1 0.5 1 1.5 2 2.5 3 3.5 4 < 100 GeV T1 p 79 < 0 - 10 % Pb+Pb pp 10 - 20 % ATLAS = 0.3 jets R t k anti-J x d N d N 1 0.5 1 1.5 2 2.5 3 3.5 4 20 - 30 % 30 - 40 % J x 0.3 0.4 0.5 0.6 0.7 0.8 0.9 1 J x d N d N 1 0.5 1 1.5 2 2.5 3 3.5 4 40 - 60 % J x 0.3 0.4 0.5 0.6 0.7 0.8 0.9 1 60 - 80 % = 2.76 TeV NN s -1 data, 4.0 pb pp 2013 -1 2011 Pb+Pb data, 0.14 nb
Figure 11: The (1/N)dN/dxJdistributions for jet pairs with 79 < pT1 < 100 GeV for different collision centralities
9 Conclusion
This Letter presents a measurement of dijet xJdistributions in 4.0 pb−1 of pp and 0.14 nb−1 of Pb+Pb collisions at √sNN = 2.76 TeV. The measurement is performed differentially in leading-jet transverse momentum, pT1, and in collision centrality using data from the ATLAS detector at the LHC. The mea-sured distributions are unfolded to account for the effects of experimental resolution and inefficiencies on the two-dimensional (pT1, pT2) distributions and then projected into bins of fixed ratio xJ= pT2/pT1. The distributions show a larger contribution of asymmetric dijets in Pb+Pb data compared to that in pp data, a feature that becomes more pronounced in more central collisions and is consistent with expectations of medium-induced energy loss due to jet quenching. In the 0–10% centrality bin for 100 < pT1 < 126 GeV, the xJdistribution develops a significant peak at xJ ∼ 0.5 indicating that the most probable configuration for dijets is for them to be highly unbalanced. This is in sharp contrast to the situation in the pp data where the most probable values are near xJ∼ 1. The centrality-dependent modifications evolve smoothly from central to peripheral collisions, and the results in the 60–80% centrality bin and the pp data are con-sistent. At larger values of pT1 the xJdistributions are observed to narrow and the differences between the distributions in central Pb+Pb and pp collisions lessen. This is qualitatively consistent with a picture in which the fractional energy loss decreases with increasing jet pT. The features in the data are com-patible with those observed in previous measurements of dijets in Pb+Pb collisions by the ATLAS and CMS collaborations, however, the trends in this measurement are more prominent due to the application of the unfolding procedure. This result constitutes an important benchmark for theoretical models of jet quenching and the dynamics of relativistic heavy-ion collisions.
Acknowledgements
We thank CERN for the very successful operation of the LHC, as well as the support staff from our institutions without whom ATLAS could not be operated efficiently.
We acknowledge the support of ANPCyT, Argentina; YerPhI, Armenia; ARC, Australia; BMWFW and FWF, Austria; ANAS, Azerbaijan; SSTC, Belarus; CNPq and FAPESP, Brazil; NSERC, NRC and CFI, Canada; CERN; CONICYT, Chile; CAS, MOST and NSFC, China; COLCIENCIAS, Colombia; MSMT CR, MPO CR and VSC CR, Czech Republic; DNRF and DNSRC, Denmark; IN2P3-CNRS, CEA-DSM/IRFU, France; SRNSF, Georgia; BMBF, HGF, and MPG, Germany; GSRT, Greece; RGC, Hong Kong SAR, China; ISF, I-CORE and Benoziyo Center, Israel; INFN, Italy; MEXT and JSPS, Japan; CNRST, Morocco; NWO, Netherlands; RCN, Norway; MNiSW and NCN, Poland; FCT, Portugal; MNE/IFA, Romania; MES of Russia and NRC KI, Russian Federation; JINR; MESTD, Serbia; MSSR, Slovakia; ARRS and MIZŠ, Slovenia; DST/NRF, South Africa; MINECO, Spain; SRC and Wallen-berg Foundation, Sweden; SERI, SNSF and Cantons of Bern and Geneva, Switzerland; MOST, Taiwan; TAEK, Turkey; STFC, United Kingdom; DOE and NSF, United States of America. In addition, indi-vidual groups and members have received support from BCKDF, the Canada Council, CANARIE, CRC, Compute Canada, FQRNT, and the Ontario Innovation Trust, Canada; EPLANET, ERC, ERDF, FP7, Horizon 2020 and Marie Skłodowska-Curie Actions, European Union; Investissements d’Avenir Labex and Idex, ANR, Région Auvergne and Fondation Partager le Savoir, France; DFG and AvH Foundation, Germany; Herakleitos, Thales and Aristeia programmes co-financed by EU-ESF and the Greek NSRF; BSF, GIF and Minerva, Israel; BRF, Norway; CERCA Programme Generalitat de Catalunya, Generalitat Valenciana, Spain; the Royal Society and Leverhulme Trust, United Kingdom.
The crucial computing support from all WLCG partners is acknowledged gratefully, in particular from CERN, the ATLAS Tier-1 facilities at TRIUMF (Canada), NDGF (Denmark, Norway, Sweden), CC-IN2P3 (France), KIT/GridKA (Germany), INFN-CNAF (Italy), NL-T1 (Netherlands), PIC (Spain), ASGC (Taiwan), RAL (UK) and BNL (USA), the Tier-2 facilities worldwide and large non-WLCG resource providers. Major contributors of computing resources are listed in Ref. [43].
References
[1] PHENIX Collaboration, K. Adcox et al, Formation of dense partonic matter in relativistic nucleus nucleus collisions at RHIC: Experimental evaluation by the PHENIX collaboration,
Nucl. Phys. A 757 (2005) 184, arXiv:nucl-ex/0410003. [2] STAR Collaboration, J. Adams et al.,
Experimental and theoretical challenges in the search for the quark gluon plasma: The STAR collaboration’s critical assessment of the evidence from RHIC collisions,
Nucl. Phys. A 757 (2005) 102, arXiv:nucl-ex/0501009.
[3] ATLAS Collaboration, Observation of a Centrality-Dependent Dijet Asymmetry in Lead–Lead Collisions at √sNN = 2.76 TeV with the ATLAS Detector at the LHC,
Phys. Rev. Lett. 105 (2010) 252303, arXiv:1011.6182 [hep-ex].
[4] Bjorken, J. D., Energy loss of energetic partons in quark-gluon plasma: possible extinction of high pT jets in hadron-hadron collisions.FERMILAB-PUB-82-059-THY (1982).
[5] ATLAS Collaboration, Measurement of the jet radius and transverse momentum dependence of inclusive jet suppression in lead–lead collisions at √sNN = 2.76 TeV with the ATLAS detector, Phys. Lett. B 719 (2013) 220, arXiv:1208.1967 [hep-ex].
[6] ATLAS Collaboration, Measurements of the Nuclear Modification Factor for Jets in Pb+Pb Collisions at √sNN = 2.76 TeV with the ATLAS Detector,Phys. Rev. Lett. 114 (2015) 072302, arXiv:1411.2357 [hep-ex].
[7] ATLAS Collaboration, Measurement of the Azimuthal Angle Dependence of Inclusive Jet Yields in Pb+Pb Collisions at √sNN= 2.76 TeV with the ATLAS detector,
Phys. Rev. Lett. 111 (2013) 152301, arXiv:1306.6469 [hep-ex]. [8] CMS Collaboration,
Observation and studies of jet quenching in PbPb collisions at √sNN = 2.76 TeV,
Phys. Rev. C 84 (2011) 024906, arXiv:1102.1957 [hep-ex]. [9] CMS Collaboration,
Jet momentum dependence of jet quenching in PbPb collisions at √sNN= 2.76 TeV, Phys. Lett. B 712 (2012) 176, arXiv:1202.5022 [hep-ex].
[10] CMS Collaboration, Studies of jet quenching using isolated-photon+jet correlations in PbPb and pp collisions at √sNN = 2.76 TeV,Phys. Lett. B 718 (2013) 773, arXiv:1205.0206 [hep-ex]. [11] ATLAS Collaboration, Measurement of inclusive jet charged-particle fragmentation functions in Pb+Pb collisions at √sNN = 2.76 TeV with the ATLAS detector,Phys. Lett. B 739 (2014) 320, arXiv:1406.2979 [hep-ex].
[12] CMS Collaboration, Measurement of jet fragmentation into charged particles in pp and PbPb collisions at √sNN = 2.76 TeV,JHEP 10 (2012) 087, arXiv:1205.5872 [hep-ex].
[13] CMS Collaboration,
Measurement of jet fragmentation in PbPb and pp collisions at √sNN = 2.76 TeV, Phys. Rev. C 90 (2014) 024908, arXiv:1406.0932 [hep-ex].
[14] ALICE Collaboration, B. Abelev et al.,
Measurement of charged jet suppression in Pb-Pb collisions at √sNN= 2.76 TeV, JHEP 03 (2014) 013, arXiv:1311.0633 [nucl-ex].
[15] M. Cacciari, G. P. Salam, and G. Soyez, The anti-kt jet clustering algorithm,JHEP 04 (2008) 063, arXiv:0802.1189 [hep-ph].
[16] ATLAS Collaboration, The ATLAS Experiment at the CERN Large Hadron Collider,
JINST 3 (2008) S08003. [17] ATLAS Collaboration,
Measurement of the pseudorapidity and transverse momentum dependence of the elliptic flow of charged particles in lead–lead collisions at √sNN= 2.76 TeV with the ATLAS detector,
Phys. Lett. B 707 (2012) 330, arXiv:1108.6018 [hep-ex]. [18] ATLAS Collaboration,
The performance of the jet trigger for the ATLAS detector during 2011 data taking,
Eur. Phys. J. C 76 (2016) 526, arXiv:1606.07759 [hep-ex]. [19] ATLAS Collaboration,
Jet energy measurement with the ATLAS detector in proton–proton collisions at √s= 7 TeV,
Eur. Phys. J. C 73 (2013) 2304, arXiv:1112.6426 [hep-ex].
[20] M. L. Miller et al., Glauber modeling in high energy nuclear collisions,
Ann. Rev. Nucl. Part. Sci. 57 (2007) 205, arXiv:nucl-ex/0701025.
[21] B. Alver et al., The PHOBOS Glauber Monte Carlo, (2008), arXiv:0805.4411 [nucl-ex]. [22] S. Agostinelli et al., GEANT4: A simulation toolkit,Nucl. Instrum. Meth. A 506 (2003) 250. [23] ATLAS Collaboration, The ATLAS Simulation Infrastructure,Eur. Phys. J. C 70 (2010) 823,
arXiv:1005.4568 [hep-ex].
[24] T. Sjöstrand, S. Mrenna and P. Z. Skands, PYTHIA 6.4 Physics and Manual,
JHEP 05 (2006) 026, arXiv:hep-ph/0603175.
[25] ATLAS Collaboration, ATLAS tunes of PYTHIA 6 and Pythia 8 for MC11,
ATL-PHYS-PUB-2011-009 (2011), url:http://cdsweb.cern.ch/record/1363300. [26] J. Pumplin et al.,
New generation of parton distributions with uncertainties from global QCD analysis,
JHEP 07 (2002) 012, arXiv:hep-ph/0201195 [hep-ph].
[27] T. Sjöstrand, S. Mrenna and P. Z. Skands, A Brief Introduction to PYTHIA 8.1,
Comput. Phys. Commun. 178 (2008) 852, arXiv:0710.3820 [hep-ph].
[28] ATLAS Collaboration, Summary of ATLAS Pythia 8 tunes, ATL-PHYS-PUB-2012-003 (2012), url:https://cds.cern.ch/record/1474107.
[29] H.-L. Lai et al., New parton distributions for collider physics,Phys. Rev. D 82 (2010) 074024, arXiv:1007.2241 [hep-ph].
[30] I. Lokhtin and A. Snigirev, A Model of jet quenching in ultrarelativistic heavy ion collisions and high-p(T) hadron spectra at RHIC,Eur. Phys. J. C 45 (2006) 211, arXiv:hep-ph/0506189.
[31] M. Cacciari, G. P. Salam, and G. Soyez, FastJet User Manual,Eur. Phys. J. C 72 (2012) 1896, arXiv:1111.6097 [hep-ph].
[32] ATLAS Collaboration, Jet energy measurement and its systematic uncertainty in proton–proton collisions at √s= 7 TeV with the ATLAS detector,Eur. Phys. J. C 75 (2015) 17,
arXiv:1406.0076 [hep-ex].
[33] ATLAS Collaboration, Measurement of the azimuthal anisotropy for charged particle production in √sNN= 2.76 TeV lead–lead collisions with the ATLAS detector,
Phys. Rev. C 86 (2012) 014907, arXiv:1203.3087 [hep-ex].
[34] G. D’Agostini, A Multidimensional unfolding method based on Bayes’ theorem,
Nucl. Instrum. Meth. A 362 (1995) 487.
[35] T. Adye, Unfolding algorithms and tests using RooUnfold, (2011), arXiv:1105.1160 [physics.data-an].
[36] ATLAS Collaboration, Jet energy resolution in proton–proton collisions at √s= 7 TeV recorded in 2010 with the ATLAS detector,Eur. Phys. J. C 73 (2013) 2306, arXiv:1210.6210 [hep-ex]. [37] ATLAS Collaboration, Study of jet shapes in inclusive jet production in pp collisions at
√
s= 7 TeV using the ATLAS detector,Phys. Rev. D 83 (2011) 052003, arXiv:1101.0070 [hep-ex].
[38] M. Bahr et al., Herwig++ Physics and Manual,Eur. Phys. J. C 58 (2008) 639, arXiv:0803.0883 [hep-ph].
[39] S. Gieseke, C. Rohr, and A. Siodmok, Colour reconnections in Herwig++,
Eur. Phys. J. C 72 (2012) 2225, arXiv:1206.0041 [hep-ph].
[40] P. Nason, A New method for combining NLO QCD with shower Monte Carlo algorithms,
JHEP 11 (2004) 040, arXiv:hep-ph/0409146 [hep-ph]. [41] S. Frixione, P. Nason, and C. Oleari,
Matching NLO QCD computations with Parton Shower simulations: the POWHEG method,
JHEP 11 (2007) 070, arXiv:0709.2092 [hep-ph].
[42] S. Alioli et al., A general framework for implementing NLO calculations in shower Monte Carlo programs: the POWHEG BOX,JHEP 06 (2010) 043, arXiv:1002.2581 [hep-ph].
[43] ATLAS Collaboration, ATLAS Computing Acknowledgements 2016-2017,
The ATLAS Collaboration
M. Aaboud137d, G. Aad88, B. Abbott115, J. Abdallah8, O. Abdinov12, B. Abeloos119, S.H. Abidi161, O.S. AbouZeid139, N.L. Abraham151, H. Abramowicz155, H. Abreu154, R. Abreu118, Y. Abulaiti148a,148b, B.S. Acharya167a,167b,a, S. Adachi157, L. Adamczyk41a, D.L. Adams27, J. Adelman110,
M. Adersberger102, T. Adye133, A.A. Affolder139, T. Agatonovic-Jovin14, C. Agheorghiesei28b, J.A. Aguilar-Saavedra128a,128f, S.P. Ahlen24, F. Ahmadov68,b, G. Aielli135a,135b, S. Akatsuka71, H. Akerstedt148a,148b, T.P.A. Åkesson84, A.V. Akimov98, G.L. Alberghi22a,22b, J. Albert172, M.J. Alconada Verzini74, M. Aleksa32, I.N. Aleksandrov68, C. Alexa28b, G. Alexander155,
T. Alexopoulos10, M. Alhroob115, B. Ali130, M. Aliev76a,76b, G. Alimonti94a, J. Alison33, S.P. Alkire38, B.M.M. Allbrooke151, B.W. Allen118, P.P. Allport19, A. Aloisio106a,106b, A. Alonso39, F. Alonso74, C. Alpigiani140, A.A. Alshehri56, M. Alstaty88, B. Alvarez Gonzalez32, D. Álvarez Piqueras170, M.G. Alviggi106a,106b, B.T. Amadio16, Y. Amaral Coutinho26a, C. Amelung25, D. Amidei92,
S.P. Amor Dos Santos128a,128c, A. Amorim128a,128b, S. Amoroso32, G. Amundsen25, C. Anastopoulos141, L.S. Ancu52, N. Andari19, T. Andeen11, C.F. Anders60b, J.K. Anders77, K.J. Anderson33,
A. Andreazza94a,94b, V. Andrei60a, S. Angelidakis9, I. Angelozzi109, A. Angerami38, F. Anghinolfi32, A.V. Anisenkov111,c, N. Anjos13, A. Annovi126a,126b, C. Antel60a, M. Antonelli50, A. Antonov100,∗, D.J. Antrim166, F. Anulli134a, M. Aoki69, L. Aperio Bella32, G. Arabidze93, Y. Arai69, J.P. Araque128a, V. Araujo Ferraz26a, A.T.H. Arce48, R.E. Ardell80, F.A. Arduh74, J-F. Arguin97, S. Argyropoulos66, M. Arik20a, A.J. Armbruster145, L.J. Armitage79, O. Arnaez32, H. Arnold51, M. Arratia30, O. Arslan23, A. Artamonov99, G. Artoni122, S. Artz86, S. Asai157, N. Asbah45, A. Ashkenazi155, L. Asquith151, K. Assamagan27, R. Astalos146a, M. Atkinson169, N.B. Atlay143, K. Augsten130, G. Avolio32, B. Axen16, M.K. Ayoub119, G. Azuelos97,d, A.E. Baas60a, M.J. Baca19, H. Bachacou138, K. Bachas76a,76b,
M. Backes122, M. Backhaus32, P. Bagiacchi134a,134b, P. Bagnaia134a,134b, J.T. Baines133, M. Bajic39, O.K. Baker179, E.M. Baldin111,c, P. Balek175, T. Balestri150, F. Balli138, W.K. Balunas124, E. Banas42, Sw. Banerjee176,e, A.A.E. Bannoura178, L. Barak32, E.L. Barberio91, D. Barberis53a,53b, M. Barbero88, T. Barillari103, M-S Barisits32, T. Barklow145, N. Barlow30, S.L. Barnes36c, B.M. Barnett133,
R.M. Barnett16, Z. Barnovska-Blenessy36a, A. Baroncelli136a, G. Barone25, A.J. Barr122, L. Barranco Navarro170, F. Barreiro85, J. Barreiro Guimarães da Costa35a, R. Bartoldus145,
A.E. Barton75, P. Bartos146a, A. Basalaev125, A. Bassalat119, f, R.L. Bates56, S.J. Batista161, J.R. Batley30, M. Battaglia139, M. Bauce134a,134b, F. Bauer138, H.S. Bawa145,g, J.B. Beacham113, M.D. Beattie75, T. Beau83, P.H. Beauchemin165, P. Bechtle23, H.P. Beck18,h, K. Becker122, M. Becker86,
M. Beckingham173, C. Becot112, A.J. Beddall20e, A. Beddall20b, V.A. Bednyakov68, M. Bedognetti109, C.P. Bee150, T.A. Beermann32, M. Begalli26a, M. Begel27, J.K. Behr45, A.S. Bell81, G. Bella155, L. Bellagamba22a, A. Bellerive31, M. Bellomo89, K. Belotskiy100, O. Beltramello32, N.L. Belyaev100, O. Benary155,∗, D. Benchekroun137a, M. Bender102, K. Bendtz148a,148b, N. Benekos10, Y. Benhammou155, E. Benhar Noccioli179, J. Benitez66, D.P. Benjamin48, M. Benoit52, J.R. Bensinger25, S. Bentvelsen109, L. Beresford122, M. Beretta50, D. Berge109, E. Bergeaas Kuutmann168, N. Berger5, J. Beringer16, S. Berlendis58, N.R. Bernard89, G. Bernardi83, C. Bernius112, F.U. Bernlochner23, T. Berry80, P. Berta131, C. Bertella86, G. Bertoli148a,148b, F. Bertolucci126a,126b, I.A. Bertram75, C. Bertsche45, D. Bertsche115, G.J. Besjes39, O. Bessidskaia Bylund148a,148b, M. Bessner45, N. Besson138,
C. Betancourt51, A. Bethani87, S. Bethke103, A.J. Bevan79, R.M. Bianchi127, M. Bianco32, O. Biebel102, D. Biedermann17, R. Bielski87, N.V. Biesuz126a,126b, M. Biglietti136a, J. Bilbao De Mendizabal52, T.R.V. Billoud97, H. Bilokon50, M. Bindi57, A. Bingul20b, C. Bini134a,134b, S. Biondi22a,22b, T. Bisanz57, C. Bittrich47, D.M. Bjergaard48, C.W. Black152, J.E. Black145, K.M. Black24, D. Blackburn140,