Publisher’s version / Version de l'éditeur:
Vous avez des questions? Nous pouvons vous aider. Pour communiquer directement avec un auteur, consultez la première page de la revue dans laquelle son article a été publié afin de trouver ses coordonnées. Si vous n’arrivez pas à les repérer, communiquez avec nous à PublicationsArchive-ArchivesPublications@nrc-cnrc.gc.ca.
Questions? Contact the NRC Publications Archive team at
PublicationsArchive-ArchivesPublications@nrc-cnrc.gc.ca. If you wish to email the authors directly, please see the first page of the publication for their contact information.
https://publications-cnrc.canada.ca/fra/droits
L’accès à ce site Web et l’utilisation de son contenu sont assujettis aux conditions présentées dans le site LISEZ CES CONDITIONS ATTENTIVEMENT AVANT D’UTILISER CE SITE WEB.
Sensors and Smart Structures Technologies for Civil, Mechanical, and Aerospace
Systems 2008, pp. 69321J-1-69321J-9, 2008
READ THESE TERMS AND CONDITIONS CAREFULLY BEFORE USING THIS WEBSITE.
https://nrc-publications.canada.ca/eng/copyright
NRC Publications Archive Record / Notice des Archives des publications du CNRC :
https://nrc-publications.canada.ca/eng/view/object/?id=392427cb-fadb-448a-8f0b-5ceceb6ca975 https://publications-cnrc.canada.ca/fra/voir/objet/?id=392427cb-fadb-448a-8f0b-5ceceb6ca975
NRC Publications Archive
Archives des publications du CNRC
This publication could be one of several versions: author’s original, accepted manuscript or the publisher’s version. / La version de cette publication peut être l’une des suivantes : la version prépublication de l’auteur, la version acceptée du manuscrit ou la version de l’éditeur.
For the publisher’s version, please access the DOI link below./ Pour consulter la version de l’éditeur, utilisez le lien DOI ci-dessous.
https://doi.org/10.1117/12.776570
Access and use of this website and the material on it are subject to the Terms and Conditions set forth at
Non-contact local and global damage detection with integrated
ultrasonic transducers
Non-Contact Local and Global Damage Detection
with Integrated Ultrasonic Transducers
K.-T. Wu
a, C.-K. Jen*
band N. Mrad
c aDepartment of Electrical and Computer Engineering, McGill University, 3480 University Street,
Montreal, Quebec H3A 2A7, Canada;
b
Industrial Materials Institute, National Research Council of Canada, 75 Blvd. de Mortagne,
Boucherville, Quebec J4B 6Y4, Canada;
c
Department of National Defence, Defence R&D Canada, Air Vehicles Research Section, National
Defence Headquarters, Ottawa, Ontario, K1A 0K2, Canada
ABSTRACT
Miniature and light weight thick piezoelectric films (>40µm) integrated ultrasonic transducers (IUTs) for bulk longitudinal (L) and shear (S) and plate acoustic waves (PAW) propagation are presented. The unique and distinct advantages of these IUTs are that they can be fabricated, using sol-gel based technique, directly onto sample with complex structures including curved surfaces and require no couplant for operation. Using novel mode conversion methods, the L wave generated by IUTs can be converted to S, symmetric, anti-symmetric and shear-horizontal (SH) PAW. The experimental results agreed well with those obtained by a finite difference based method which solves the 3D visco-elastic wave equations. These IUTs can operate at temperatures at least up to 150°C, at center frequencies ranging from 1 to 20 MHz, and provide damage detection range of tens of centimeters in metallic structures. An inductive coupled technique is used to achieve non-contact measurements with these IUTs.
Keywords: Longitudinal and shear waves, plate wave, integrated ultrasonic transducer, high temperature ultrasonic
measurement, nondestructive testing, and mode conversion
1. INTRODUCTION
The continued requirement for increased air safety, life extension of aging aircraft fleets, increased aircraft availability and reduced operational costs, suggests the adoption of structural health monitoring (SHM)1,2 or real-time nondestructive evaluation (NDE) technologies3,4 within maintenance programs by the aerospace industry. The ultimate objective of such technologies is to employ structurally integrated sensors with associated advanced signal processing capabilities to perform local and global in-service component inspection; thus increasing platform availability and reducing associated maintenance costs. In this investigation we present and demonstrate the development of miniaturized light weight thick (>40µm) piezoelectric films integrated ultrasonic transducers (IUTs) made by sol-gel based spray technique for local and global damage detection.
The sol-gel based sensor fabrication process5,6 consists of six main steps: (1) preparing high dielectric constant lead-zirconate-titanate (PZT) solution, (2) ball milling of piezoelectric PZT powders to submicron size, (3) sensor spraying using slurries from steps (1) and (2) to produce a layer of ceramic film, (4) heat treatment to produce a solid composite ceramic film, (5) corona poling to obtain piezoelectricity, and (6) electrode painting or spraying for electrical connections. Steps (3) and (4) are used multiple times to produce proper film (IUT) thickness for optimal ultrasonic operating frequencies. Silver paste was used to fabricate top electrodes. Such electrode fabrication approach enables to achieve desired array configurations easily and economically.
The thick PZT film IUT can be directly deposited onto metallic planar and curved surfaces as longitudinal (L) wave UT. Using mode conversion methods7,8 the L wave can be used to excite and receive efficiently and simultaneously L and shear (S) waves. The L and S waves can be used for localized damage detection through component thickness. In this
*cheng-kuei.jen@cnrc-nrc.gc.ca; phone 1 450 641-5085; fax 1 450 641-5106
Sensors and Smart Structures Technologies for Civil, Mechanical, and Aerospace Systems 2008, edited by Masayoshi Tomizuka, Proc. of SPIE Vol. 6932, 69321J, (2008)
0277-786X/08/$18 · doi: 10.1117/12.776570 Proc. of SPIE Vol. 6932 69321J-1
paper a smart screw concept using L and S waves is introduced. The experimental results will be also compared with those obtained by a finite difference based method which solves the 3D visco-elastic wave equations. The numerical simulation will enhance the ability to evaluate the sensitivity and resolution of defect detection without making many samples and tests.
It is known that plate acoustic waves (PAW) 9,10 can propagate in a distance of more than tens or hundreds of cm in metal plates. PAWs can be excited and received by bulk wave transducers with a wedge3,4 and interdigital transducers10. They are excellent candidates for global damage monitoring of metallic plates. Here IUTs will be deposited at the end edges of metallic plates with proper mode conversion angles and directions to efficiently generate and receive symmetric and shear-horizontal (SH) PAWs for line crack detection demonstration. The experimental results will be compared with those obtained by the 3D finite difference based method.
For SHM and NDE, an induction11 based non-contact approached has been developed to generate and receive all the above discussed L, S and PAW to eliminate the need for direct electrical connections. Preliminary results will be presented.
2. IUT as L and S Wave Probe
Various efforts have been devoted to developing L wave high temperature UTs of large bandwidth and high efficiency, which are supplied by several companies. However, it is understood that S waves may be advantageous over L waves for the NDE & characterization of materials, because liquid and gas media do not support S waves. For instance, the higher sensitivity to detect cracks or gaps filled with liquids could be expected using S waves than L waves in a pulse/echo technique since reflection coefficients of S waves at solid/liquid interfaces are unity, namely total reflection, while that of L waves are less than unity. Also, for the evaluation of material properties, it is sometimes important to measure shear modulus and viscoelastic properties3,4 for which knowledge of S wave properties is a prerequisite. Furthermore, an ultrasonic probe which can generate and receive both L and S waves simultaneously at the same probe location is also desirable.
2.1. Comparison Between Theoretical Calculations and Experimental Results
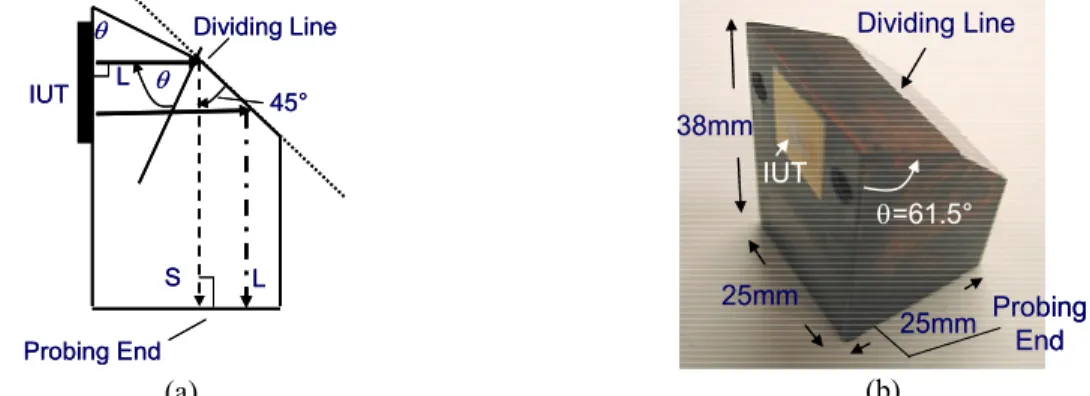
The mode conversion from L waves to S waves by reflection at a solid/air interface was reported using an IUT7,8. It has been demonstrated that IUTs can be used to excite and detect both L and S waves simultaneously using mode conversion and reflection. Firstly a 100µm thick piezoelectric PZT composite film as IUT was deposited onto a mild steel block as shown in Fig.1. This mild steel has a L wave velocity of Vl = 5900 m/s and a S wave velocity of Vs = 3200 m/s at room temperature. The calculated energy reflection coefficients at solid (mild steel)/air interface7,8 indicates that the maximum energy conversion rate from the incident Lwave to the reflected S wave is 97.5% at θ = 67.2°, and the reduction of the energy conversion rate is within 1% in the range of θ between 60.8 and 72.9°. In this investigation a unique approach was taken to fabricate the L wave IUT in a plane parallel to the propagation direction of the mode converted S waves as shown in Figs.1a and 1b, which show a schematic and an actual probe, respectively. By considering this criterion, θ is 61.5° and the reduction of energy conversion rate at this angle is only 0.8% smaller than the maximum conversion rate at θ = 67.2°. This approach could reduce the machining time of the probe and IUT fabrication difficulty.
IUT L 45° S L θ θ Probing End Dividing Line IUT L 45° S L θ θ Probing End Dividing Line (a) Probing End IUT 38mm 25mm 25mm θ=61.5° Dividing Line Probing End IUT 38mm 25mm 25mm θ=61.5° Dividing Line (b)
Fig. 1. A probe which can generate both L and S waves simultaneously with an IUT located in a plane parallel to the direction of mode converted S wave where θ = 61.5°. (a) Schematic diagram and (b) actual probe.
For L wave simply a 45° reflecting surface as shown in Fig.1 is used. In Fig.1a the part of the IUT is lower than the dividing line between the plane with θ is 61.5° and that of 45° is used for the generation and receiving of L waves. Therefore for such probe configuration the area size above or below the dividing line provides a flexibility to adjust the amplitude ratio between the L and S waves.
Fig.2a shows the measured ultrasonic signal at room temperature in time domain. The center frequencies and 6 dB bandwidth of the L and S waves are 7.8 and 8.1 MHz and 6.0 and 6.2 MHz, respectively. The signals to noise ratios (SNRs) of the L and S waves are above 20 dB. The numerically simulated result in time domain using commercial available software package (Wave3000 Pro, CyberLogic Inc., New York, NY) based on a finite difference method which solves the 3D visco-elastic wave equations is given in Fig.2b. Comparing Figs.2a and 2b a good agreement between the experimental obtained and numerically calculated signals in signal bandwidth and time delay has been achieved for the L wave. For S wave the bandwidth and arrival time of the numerically calculated signal are narrower and longer, respectively, than the experimental one. It is speculated that the input parameters such as the bandwidth and shape of the excitation pulse and IUT, and the grid size used in the finite difference method of which all may increase the computation time significantly do affect the simulation results. .
10 15 20 25 30 A m pl it ude (a rb . uni t) Time Delay (µs)
L
1S
1 10 15 20 25 30 A m pl it ude (a rb . uni t) Time Delay (µs)L
1S
1 (a) 10 15 20 25 30Amplitude (arb. unit)
Time Delay (µs)
L
1S
110 15 20 25 30
Amplitude (arb. unit)
Time Delay (µs)
L
1S
1(b)
Fig. 2. (a) Measured and (b) numerically calculated ultrasonic signal in time domain at room temperature in the probe as shown in Fig.1b.
2.2. Smart Screws
Structural parts which are held together by screws (bolts, rivets or fasteners) under tensile stress must be designed and assembled so that these screws are sufficiently loaded to prevent the parts from separating while the structure is in service. Therefore a reliable measurement of the axial load or preload in such screws is essential to secure structural safety and a precise control of the fastening force is required. Several ultrasonic methods have been studied. The most promising ones are measuring the time delays of both L and S wave along the screw direction12-14. In the most recent paper14 the use of L and S waves allowed the elimination of time-of-flight measurement of both waves in the unstressed state. Thus the tightening tension can be evaluated without loosening the assemblies bolted. All the previous works using conventional UT which needs ultrasonic couplants and cannot be operated at elevated temperatures. In this study, IUT will be used to excite and receive both L and S waves propagating along the screw axial direction in an aluminum alloy (Al) screw using the mode conversion method mentioned above and operated up to 150°C without any couplant. Figs.3a and 3b show the schematic and this Al screw, respectively.
This Al screw used has a L wave velocity of Vl = 6420 m/s and a S wave velocity of Vs = 3007 m/s at room temperature. The calculated energy reflection coefficients at solid (mild steel)/air interface7,8 provides that the maximum energy conversion rate from the incident Lwave to the reflected S wave is 73.1% at θ = 63.3°, and the reduction of the energy conversion rate is 1% when θ = 64.9°. Figs.4a and 4b show the measured ultrasonic signal at room temperature and 150°C, respectively, in time domain. Ln and Sn are the nth round trip L and S echoes, respectively, from IUT to the end of the screw. The center frequencies and 6 dB bandwidth of the measured L1 and S1 waves are 15.4 and 12.0 MHz and 12.3 and 8.5 MHz, respectively at room temperature and 150°C. In Figs.4a and 4b the SNR of the L and S waves are above 11.2 dB and 11.5 dB, respectively. The SNRs in Fig.4a is lower than that in Fig.2a is due to the small diameter and thread of this Al screw15.
IUT
64.9° 135.0° (a)21.5
mm
64.9° 135.0°IUT
21.5
mm
64.9° 135.0°IUT
(b)Fig. 3. An Al screw which can generate both L and S waves simultaneously with an IUT located in a plane parallel to the direction of mode converted S wave where θ = 64.9°. (a) Schematic diagram and (b) actual probe.
5 10 15 20
Amplitude (arb. unit)
Time Delay (µs)
L
1S
15 10 15 20
Amplitude (arb. unit)
Time Delay (µs)
L
1S
1 (a) 5 10 15 20 Amplitude (arb. unit) Time Delay (µs)L
1S
1 5 10 15 20 Amplitude (arb. unit) Time Delay (µs)L
1S
1 (b)Fig. 4. Measured ultrasonic signal in the Al screw shown in Fig.3b in time domain at (a) room temperature and (c) 150°C.
3. IUT as PAW Probes
IUTs have been directly deposited onto the edges of Al plates of 6mm thick to excite and detect the symmetric, anti-symmetric and SH PAWs and operated up to 150°C16. It is noted that IUT using bismuth titanium ceramics can operate up to 500°C17. In this study Al plates of 2 mm thick are used. For demonstration purposes only the experimental and numerical calculation results for symmetric and SH PAW will be demonstrated. Line defect detection illustration will be given in the next section.
3.1. Symmetric PAW
Fig.5 shows a schematic diagram of an IUT deposited at the end edge of a 2 mm thick Al plate with a length of 406.4mm and a width of 50.8 mm. The thickness of the IUT was 88 µm. The top rectangular electrode has a length of 46 mm and width of 1.2 mm, which define the IUT active area. This IUT generates and receive particle displacements predominantly oriented along the length direction of the plate. Due to the thin thickness of this plate symmetric PAW is mainly generated and detected. Figs.6a and 6b show the numerically calculated and measured symmetric PAW signal in time domain. For symmetric PAW the arrival time of the numerically calculated signal is longer, than the experimental one. Again it is speculated that the input parameters such as the bandwidth and shape of the excitation pulse and IUT, and the grid size used in the finite difference method of which all may increase the computation time significantly do affect the simulation results.
Fig.7 shows the theoretical calculated phase and group velocities versus the product of PAW frequency, f, and plate thickness, h, curves for the first few symmetrical (S) and anti-symmetrical (
a
) PAW modes of the Al plate shown in Fig.5. Since the group velocities of the first several symmetric PAW modes vary widely in the range of IUT excitation frequency with PAW particle displacements predominantly oriented along the length direction and 2mm plate thickness product, the pulse width of the SL,1 is wider than that of the SH PAW to be shown later. SL,1 is the first round trip echofrom the IUT to the end of the plate as shown in Fig.5.
50.8 mm 406.4 mm
IUT
Aluminum Plate (2mm thick) SSL,1L,1
Fig. 5. Schematic diagram of an IUT coated directly onto the end edge of a 2 mm thick Al plate to generate and receive symmetric PAW. 100 150 200 250 300 A m pl it u de ( a rb. uni t) Time Delay (µs)
S
L,1 100 150 200 250 300 A m pl it u de ( a rb. uni t) Time Delay (µs)S
L,1 (a) 100 150 200 250 300 A m plit ud e (ar b . u n it ) Time Delay (µs)S
L,1 100 150 200 250 300 A m plit ud e (ar b . u n it ) Time Delay (µs)S
L,1 (b)Fig.6. (a) Measured and (b) numerically calculated symmetric PAW signal in time domain at room temperature in the Al plate as shown in Fig.5.
0
5
10
15
0
1000
2000
3000
4000
5000
6000
7000
8000
9000
10000
Velocity (m/s)
fh (MHz-mm)
a
0a
1a
2a
3 S0 S1S2 S3a
4 S4a
1a
2a
0 S1 S2 S3 S4 S0a
4Solid lines represent phase velocity Dashed lines represent group velocity
a
30
5
10
15
0
1000
2000
3000
4000
5000
6000
7000
8000
9000
10000
Velocity (m/s)
fh (MHz-mm)
a
0a
1a
2a
3 S0 S1S2 S3a
4 S4a
1a
2a
0 S1 S2 S3 S4 S0a
4Solid lines represent phase velocity Dashed lines represent group velocity
a
3Fig. 7. Theoretical calculated phase and group velocities versus the product of PAW frequency, f, and plate thickness, h, curves for the first few symmetrical (S) and anti-symmetrical (
a
) PAW modes of the Al plate shown in Fig.5.3.2. SH PAW
Fig.8 shows an IUT deposited at the side edge near the end of a 2 mm thick Al plate with a length of 406.4 mm and a width of 50.8 mm. Using mode conversion SH PAW can be excited and received16. The thickness of the IUT was 90 µm. The top rectangular electrode has a length of 20 mm and width of 1.6 mm, which define the IUT active area. For this configuration symmetrical PAW echo traveled nearly 25.4 mm and then converted to shear horizontal PAW modes and vice versa. For this configuration the chosen mode conversion angle using the analogy of L to Swave was 61.7° which was calculated using the phase matching between measured extension mode velocity9,10 and the S wave velocity of the Al plate.
61.7°
50.8 mm 406.4 mm
IUT
Aluminum Plate (2mm thick) SH,1
61.7°
50.8 mm 406.4 mm
IUT
Aluminum Plate (2mm thick) SH,1
Fig. 8. Schematic diagram of an IUT coated directly onto the side edge of a 2 mm thick Al plate to generate and receive SH PAW
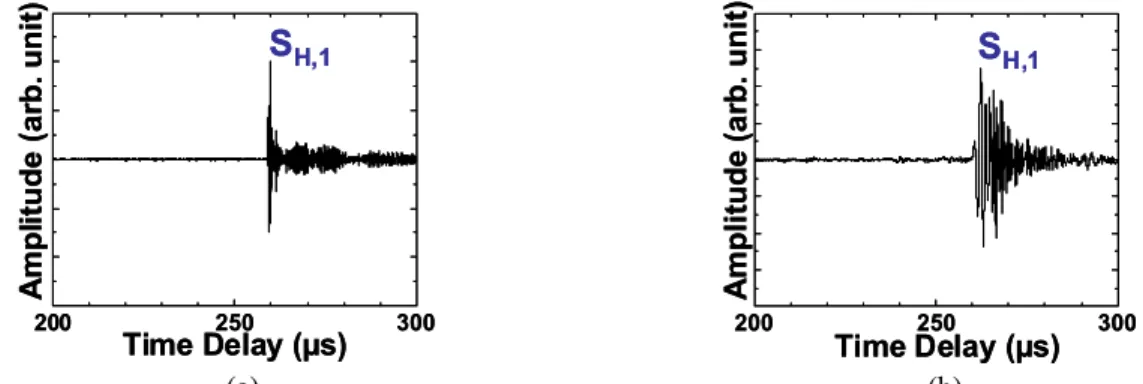
Figs.9a and 9b show the numerically calculated and measured SH PAW signal in time domain. It can be observed that again the bandwidth and arrival time of the numerically calculated SH PAW signal are narrower and longer, respectively, than the experimental one. We will investigate the effects of the input parameters such as the bandwidth and shape of the excitation pulse and IUT, and the grid size used in the finite difference method.
200 250 300 A m pl it u de ( a rb. uni t) Time Delay (µs)
S
H,1 200 250 300 A m pl it u de ( a rb. uni t) Time Delay (µs)S
H,1 (a) 200 250 300 A m pl it ude (a rb . u n it ) Time Delay (µs)S
H,1 200 250 300 A m pl it ude (a rb . u n it ) Time Delay (µs)S
H,1 (b)Fig. 9. (a) Measured and numerically calculated SH PAW signal in time domain at room temperature in the Al plate as shown in Fig.8.
Fig.10 shows the theoretical calculated phase and group velocities versus the product of PAW frequency and plate thickness curves for the first few SH PAW modes of the Al plate shown in Fig.8. Since the group velocities of the first several SH PAW modes are close to the S wave velocity of the Al plate in the range of IUT excitation frequency with the PAW particle displacement predominately oriented along the width direction of the plate and 2mm plate thickness product, the pulse width of the SH,1 is narrower than that of the symmetric PAW SL,1 signal
shown in Fig.6a. SH,1 is the first round trip echo from the IUT to the end of the plate as shown in Fig.8.
0
5
10
15
0
1000
2000
3000
4000
5000
6000
7000
8000
9000
10000
Velocity (m/s)
fh (MHz-mm)
SH0Solid lines represent phase velocity Dashed lines represent group velocity
SH1 SH2 SH3 SH4 SH5 SH6 SH7 SH8 SH1 SH2 SH3 SH4 SH5 SH6 SH7 SH8
0
5
10
15
0
1000
2000
3000
4000
5000
6000
7000
8000
9000
10000
Velocity (m/s)
fh (MHz-mm)
SH0Solid lines represent phase velocity Dashed lines represent group velocity
SH1 SH2 SH3 SH4 SH5 SH6 SH7 SH8
SH1 SH2 SH3 SH4 SH5 SH6 SH7 SH8
Fig. 10. Theoretical calculated phase and group velocities versus the product of PAW frequency, f, and plate thickness, h, curves for the first few SH PAW modes of the Al plate shown in Fig.8.
4. Non-Contact Detection of Cracks
In order to achieve fast NDE and NDE of rotating components non-contact ultrasonic measurements approaches are desired. Here an induction based method11 is used.
4.1. L Wave
L wave IUTs have been reported to be used for NDT and real-time non-invasive industrial process diagnostic tool5,6. Fig.11 shows an IUT deposited onto a 12.7 mm thick steel plate and measured by a commercial handheld pulser/receiver. The diameter of the top electrode of this IUT is 5mm. Ln is the nth round trip L echo through the plate thickness. In this measurement only 5 dB out of the available 100 dB gain was used and it indicates that this L wave IUT is very efficient. Such IUT is then used for the non-contact measurement and a schematic diagram is shown in Fig.12. First a flat coil made of thin lacquer wire is connected between the top electrode of the IUT and the steel substrate which serves as the bottom electrode of the IUT. Directly on top of such coil connected to the IUT there is the other coil surrounding a ferrite and this coil is connected to the pulser/receiver. Our preliminary results indicated that comparing with the direct contact configuration as shown in Fig.11 the additional gains required for the non-contact configuration were 15 dB, 19 dB and 29 dB, respectively for the gap distance of 1mm, 3mm and 5mm. The signal quality such as SNR and bandwidith changes only a little between these two configurations.
12.7 mm thick steel
Ln: nth round trip echo
through the thickness
L1
L2
L3
L4
Fig.11. An IUT deposited onto a 12.7 mm thick steel plate measured by a contact configuration using a commercial handheld pulser/receiver.
Gap
IUT with
Coil
Non-Contact
Ultrasonic Electronics
With Ferrite & Coil
12.7mm thick steel
Fig.12 A schematic diagram of a non-contact ultrasonic measurement configuration.
4.2. Symmetrical PAW
In order to demonstrate the global NDT and non-contact capability of the symmetric PAW two artificial line defects, D1 and D2 with 1mm depth and 1mm width were made onto the Al plate shown in Fig.5. D1 and D2 as shown in Fig.13 had a width of 25.4 mm and 50.8 mm, respectively. At room temperature the measured symmetric PAW signals in the Al plate using contact and non-contact configurations are shown in Figs.14a and 14b, respectively. The receiver gain used was 26 dB higher in non-contact than contact configuration. Figs.14a and 14b cleanly confirm that symmetric PAW can be used to perform NDT of defects in long distance. In the present case the defects were 146.3 mm and 223.5 mm away from the IUT and this IUT can operate at 150°C.
IUT D1, D2: Depth: 1mm; Width: 1mm 25.4 mm 50.8 mm 406.4 mm 146.3mm 223.5mm Al Plate (Thickness 2mm) D1 D2 IUT D1, D2: Depth: 1mm; Width: 1mm 25.4 mm 50.8 mm 406.4 mm 146.3mm 223.5mm Al Plate (Thickness 2mm) D1 D2 SL,D1 SL,D2
Fig.13. Two artificial line defects, D1 and D2 were made onto a 2mm thick Al plate for the demonstration of global NDT capability of symmetric PAW.
50 100 150 200 250 300 A m pl it u d e ( a rb . uni t) Time Delay (µs) SL,D1SL,D2 50 100 150 200 250 300 A m pl it u d e ( a rb . uni t) Time Delay (µs) SL,D1SL,D2 (a) 50 100 150 200 250 300 A m p li tu d e ( a rb . un it) Time Delay (µs) SL,D1SL,D2 50 100 150 200 250 300 A m p li tu d e ( a rb . un it) Time Delay (µs) SL,D1SL,D2 (b)
Fig.14. Ultrasonic symmetric PAW signal in time domain obtained using an IUT shown in Fig.13 with the (a) contact and (b) non-contact configuration at room temperature.
4.3. SH PAW
Two artificial line defects, D1 and D2 with 0.95 mm depth and 1 mm width were made onto the Al plate shown in Fig.15 for the demonstration of the ability of SH PAW to detect such defects in a long distance. D1 and D2 had width of 25.4 mm and 50.8 mm, respectively. At room temperature the measured SH PAW signals in the Al plate using contact and non-contact configurations are shown in Figs.16a and 16b, respectively. The receiver gain used was 24 dB higher in non-contact than contact configuration. Figs.16a and 16b cleanly confirm that SH PAW can be used to perform NDT of defects in a distance of about 223.5 mm away from the IUT. This IUT can operate also at 150°C. IUT D1, D2: Depth: 0.95mm; Width: 1mm 25.4 mm mm50.8 406.4 mm 146.3mm 223.5mm Al plate (Thickness 2mm) D1 D2 SH,D1 SH,D2 SH,1
Fig.15. Two artificial line defects, D1 and D2 were made onto a 2mm thick Al plate for the demonstration of global NDT capability of SH PAW. 50 100 150 200 250 300 A m pl it ude (a rb . uni t) Time Delay (µs) SH,D1
S
H,D2S
H,1 50 100 150 200 250 300 A m pl it ude (a rb . uni t) Time Delay (µs) SH,D1S
H,D2S
H,1 (a) 50 100 150 200 250 300 A m plit ud e ( a rb . un it ) Time Delay (µs) SH,D1S
H,D2S
H,1 50 100 150 200 250 300 A m plit ud e ( a rb . un it ) Time Delay (µs) SH,D1S
H,D2S
H,1 (b)Fig.16. Ultrasonic SH PAW signal in time domain obtained using an IUT shown in Fig.15 with the (a) contact and (b) non-contact configuration at room temperature.
5. Conclusions
Miniature and light weight thick piezoelectric films (>40µm) IUTs have been developed to generate and detect L and S and PAW propagation for local and global (propagation distance up to more than 0.8 m) NDT applications. The unique and distinct advantages of these IUTs are that they can be fabricated, using sol-gel based technique, directly onto desired UT locations and require no couplant for operation. In this investigation, using mode conversion methods, the L wave generated by IUTs can be converted to S, symmetric and SH PAW. The experimental results agreed well with those obtained by a finite difference based method which solves the 3D visco-elastic wave equations. These IUTs can operate at temperatures at least up to 150°C, at center frequencies ranging from 1 to 20 MHz. An inductive coupled technique is used to achieve non-contact measurements with these IUTs. In 2 mm thick Al plates line defects of ~1mm depth and 1mm width were clearly detected at room temperature using contact and non-contact techniques. The waveform of SH PAW is fairly short comparing to that of symmetrical PAW. In the other studies17 IUTs operated up to 700°C have been demonstrated.
ACKNOWLEDGMENT
The authors are grateful to M. Kobayashi and J.-F. Moisan for their technical assistance. Financial support from the Natural Sciences and Engineering Research Council of Canada is acknowledged.
[1] M.V. Gandhi and B.S. Thompson, B.S., [Smart Materials and Structures], Chapman & Hall, New York (1992). [2] V. Giurgiutiu, [Structural Health Monitoring with Piezoelectric Wafer Active Sensors], Elsevier, New York (2007). [3] J. B. Ihn and F.-K. Chang, [Ultrasonic Nondestructive Evaluation Engineering and Biological Material
Characterization], edited by T. Kundu, Chap.9, CRC Press, New York (2004).
[4] A.S. Birks, R.E. Green, Jr. and P. McIntire, P. ed., [Nondestructive Testing Handbook], 2nd Ed., vol.7, Ultrasonic Testing, ASNT (1991).
[5] M. Kobayashi and C.-K. Jen, “Piezoelectric thick bismuth titanate/PZT composite film transducers for smart NDE of metals”, Smart Materials and Structures, vol.13, 951-956 (2004).
[6] M. Kobayashi, C.-K. Jen, Y. Ono and J.-F. Moisan, “Integrated high temperature ultrasonic transducers for NDT of metals and industrial process monitoring”, CINDE Journal, vol.26, 5-10 (2005).
[7] C.-K. Jen, Y. Ono and M. Kobayashi, “High temperature integrated ultrasonic shear wave probes”, Applied Phys.
Lett., vol.89, 183506_1-3 (2006).
[8] Y. Ono, C.-K. Jen and M. Kobayashi, “High temperature integrated ultrasonic shear and longitudinal wave probes”,
Review of Scientific Instruments, vol.78, 024903_1-5 (2007).
[9] I.A. Viktorov, [Rayleigh and Lamb waves], Plenum, New York (1967).
[10] G.S. Kino, [Acoustic Waves, Devices, Imaging & Analog Signal Processing], Prentice-Hall, New Jersey (1987). [11] D.W. Greve, H. Sohn, C.P. Yue and I.J. Oppenheim, “An inductively coupled lamb wave transducer”, IEEE Sensors
J., vol.7, 295-301 (2007).
[12] G.C. Johnson, A.C. Holt and B. Cunningham, “An ultrasonic method for determining axial stress in bolts”, J. Test.
and Evaluation, vol.14, 253-259 (1986).
[13] H. Yasui and K. Kawashima, “Acoustoelastic measurement of bolt axial load with velocity ratio method”, Proc.
WCNDT, Rome, Italy, Oct.16-21 (2000).
[14] S. Chaki, G. Corneloup, I. Lillamand and H. Walaszek, “Combination of longitudinal and transverse ultrasonic waves for in situ control of the tightening of bolts”, J. Pressure Vessel Tech., vol.129, 383-390 (2007).
[15] C.-K. Jen, L. Piche and J.F. Bussiere, "Long isotropic buffer rods", J. Acoust. Soc. Am., vol.88, 23-25 (1990). [16] C.-K. Jen, K.-T. Wu, M. Kobayashi, J.-H. Kuo and N. Mrad, “Integrated surface and plate acoustic sensors for
health monitoring”, Proc. SPIE on Smart Materials and Structures, NDT and Health Monitoring, vol.6532, 653206_1-8 (2007).
[17] M. Kobayashi, H. Nagata, Y. Hiruma, T. Tokutsu, T. Takenaka and C.-K. Jen, “Integrated ultrasonic transducers above 500°C”, Proc. IEEE Ultrasonics Symp., 92-95 (2007).