Publisher’s version / Version de l'éditeur:
First International Conference on Laser Plasma Applications in Materials Science
: LAPAMS’08, 2008-06-23
READ THESE TERMS AND CONDITIONS CAREFULLY BEFORE USING THIS WEBSITE.
https://nrc-publications.canada.ca/eng/copyright
Questions? Contact the NRC Publications Archive team at
[email protected]. If you wish to email the authors directly, please see the first page of the publication for their contact information.
NRC Publications Archive
Archives des publications du CNRC
This publication could be one of several versions: author’s original, accepted manuscript or the publisher’s version. / La version de cette publication peut être l’une des suivantes : la version prépublication de l’auteur, la version acceptée du manuscrit ou la version de l’éditeur.
For the publisher’s version, please access the DOI link below./ Pour consulter la version de l’éditeur, utilisez le lien DOI ci-dessous.
https://doi.org/10.1063/1.2999951
Access and use of this website and the material on it are subject to the Terms and Conditions set forth at
Enhanced laser-induced breakdown spectroscopy by second-pulse
selective wavelength excitation
Vidal, F; Chaker, M.; Goueguel, C.; Laville, S.; Loudyi, H.; Rifai, K.; Sabsabi,
M.
https://publications-cnrc.canada.ca/fra/droits
L’accès à ce site Web et l’utilisation de son contenu sont assujettis aux conditions présentées dans le site LISEZ CES CONDITIONS ATTENTIVEMENT AVANT D’UTILISER CE SITE WEB.
NRC Publications Record / Notice d'Archives des publications de CNRC:
https://nrc-publications.canada.ca/eng/view/object/?id=26b91b40-9289-45b8-81ab-18abc7322656
https://publications-cnrc.canada.ca/fra/voir/objet/?id=26b91b40-9289-45b8-81ab-18abc7322656
Enhanced Laser-Induced Breakdown Spectroscopy By
Second-Pulse Selective Wavelength Excitation
F. Vidal\ M. Chaker\ C. Goueguel\ S. Laville^ H. Loudyi\ K. Rifai\ and M.
Sabsabi^
^ Institut National de la Recherche Scientifique - Energie, Materiaux et Telecommunications, 1650 Boulevard. Lionel-Boulet, Varennes, Quebec, J3X1S2 Canada
^ Conseil National de Recherches du Canada, Institut des Materiaux Industriels, 75 Boulevard de Mortagne, Boucherville, Quebec, J4B 6Y4 Canada
Abstract. We investigate the use of a second laser with a selected wavelength to improve the limit of detection (LoD) of trace elements in the Laser-Induced Breakdown Spectroscopy (LIBS) technique. We consider the combination of LIBS with Laser-Induced Fluorescence (LIF), in which the second laser is used to excite trace elements in the plasma. The influence of the main experimental parameters on the trace elements LIF signal, namely the ablation fluence, the excitation energy, and the inter-pulse delay, was studied experimentally and a physical interpretation of the results was presented. For illustrative purpose we considered detection of Pb in brass samples and in water. The plasma was produced by a Q-switched Nd: YAG laser and then re-excited by a nanosecond optical parametric oscillator laser. We found out that the optimal conditions for our experimental set-up were obtained for relatively weak ablation fluence of 2-3 J/cm and inter-pulse delay of 5-10 |^s. Using the LIBS-LIFS technique, a single-shot LoD for detection of lead of about 1.5 part per million (ppm) was obtained for solids and 0.5 ppm for liquids. These LoDs represent an improvement of about two orders of magnitude with respect to LIBS. We also discuss resonance-enhanced LIBS (RELIBS), in which the second laser excites the main plasma component instead of the impurities. For the set of parameters used the RELIBS, Pb signal does not differ significantly from the LIBS signal except at low ablation fluence.
INTRODUCTION
Laser-Induced Breakdown Spectroscopy (LIBS) is a powerful spectrochemical tool for the analysis of a wide variety of materials [1]. The main advantages of LIBS over the other existing analytical techniques include no sample preparation, stand-off and in situ real-time analysis, multi-element measurements on solids, liquids and gases, and minimal damage to the samples, since only a few micrograms of the sample is required for the analysis. On the other side, the LIBS technique shows a poorer sensitivity in comparison with other consolidated analytical techniques such as, for instance, LA-ICP-MS [2] or ICP-OES [3]. Indeed, the typical limit of detection (LoD) obtained by LIBS,
which is element dependent, ranges from a few hundreds part per billion (ppb) to hundreds of part per million (ppm) on solids [1]. For comparison, LoDs in the ppb, and even in the part per trillion (ppt), can be reached on solids using more conventional techniques [2,3]. This limitation on sensitivity prevents sometimes the LIBS technique from being considered in several important applications.
LIBS-LIFS (LIBS combined with Laser-Induced Fluorescence Spectroscopy), is a variant of the LIBS technique which has been shown to be a promising way for improving the LoD of trace and even ultra trace elements. The technique consists to generate a plasma using a first laser pulse, as in LIBS, and then to excite a trace element in the plasma by using a second laser pulse with a specific wavelength. Thus, apart
from a greater complexity, the LIBS-LIFS technique displays the same advantages as the single-pulse LIBS. The LIBS-LIFS approach has been applied successfully to the detection of various trace elements in liquids [4,5], aerosols [6] and solids [7-15] in ambient air or under controlled atmosphere. In LIBS-LIFS, the second laser is launched once the plasma has cooled down so that the background emission due to electron-ion recombination and Bremsstrahlung is minimized and thus the signal-to-noise level is improved.
Alternatively, the second laser can be used to excite selectively the main component of the plasma instead of the trace elements. In this scheme, called Resonant-Enhanced LIBS (RELIBS), which has been investigated mainly in N. H. Cheung's group [16-18], the impurities are excited through collisions with particles that have gained kinetic energy through superelastic collisions with the excited species. The main advantage of RELIBS over conventional LIBS seems to appear in applications involving low laser fluence, i.e., when a very small amount of matter is ablated [18]. Otherwise, LIBS can match nearly the LoD obtained in RELIBS by tuning the laser parameters. Although the investigations on LIBS-LIFS and RELIBS clearly demonstrate the great potential of the second pulse selective wavelength excitation techniques for reducing the LoD, the majority of the published works was devoted to optimizing the LoD for a dedicated application and too little was done to understanding the laser parameters and plasma
conditions to be achieved to optimize the trace element signal of the re-excited atoms.
The general objective of our research is to characterize the trace element signal as a function of the main experimental parameters and to elucidate the leading physical mechanisms involved in the re-excitation processes. In this paper we present some of our recent experimental results pertaining to the detection of Pb in solid and liquid samples. Most of the results presented here are related to LIBS-LIFS detection of Pb in brass samples. Complementary LIBS-LIFS results for the detection of Pb in water, and RELIBS results for the detection of Pb in brass will also be discussed.
EXPERIMENTAL
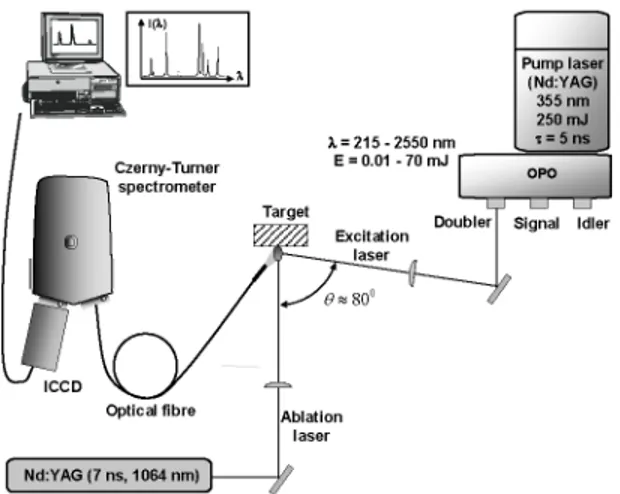
A schematic of our experimental set-up is shown in Fig. 1. The ablation was carried out using a Q-switched Nd:YAG laser (Continuum, Surelite II) that can deliver up to 600 mJ per pulse at a wavelength of 1064 nm. The pulse duration was 7 ns at FWHM (full width half maximum). The ablation beam was focused onto the target by a plano-convex BK7 lens (25.4-mm diameter, / = 25 cm focal length) at normal incidence to the target. The spot diameter onto the surface of the samples was about 2 mm. The ablation was performed in air at atmospheric pressure. Finally, the ablation fluence (F^SL) was varied from 1.5 J/cm^ to 5 J/cm^.
jJL^I
iUlii,,
NdiYAG (7 ns, 1064 nm) I
The 2" laser pulse was delivered by an Optical Parametric Oscillator (OPO) laser (Continuum, Panther). The pulse duration was 7 ns and the repetition rate was 10 Hz. The OPO was pumped by a 355 nm frequency tripled Q-switched Nd:YAG laser with energy limited to about 250 mJ per pulse. At the various outputs of the OPO (doubled signal or idler, signal and idler - see Fig. 1), the wavelength of the laser pulse (A-opo) can be tuned from 215 nm to 2.7 ]im and the corresponding energy (Eopo) ranges from 10 |jJ (at about 320 nm) to 70 mJ (at about 450 nm).
The light emitted by the plasma was collected by an optical fiber positioned next to the plasma plume and connected to the entrance slit of a Czemy-Turner spectrometer (VM 504, Acton Research). Its focal length is 0.39 m while its f-number is 5.4. It was equipped with a 1200 lines/mm (blazed at 150 nm) grating that leads to a linear dispersion of about 4.2
nm/mm. The spectrometer was coupled with an ICCD detector (Istar DH720-25H-05, Andor) containing
1024x256 pixels of dimensions 26 [xm^. The width of the intensified acquisition window was about 52 nm and the spectral resolution was about 0.12 nm. A long wave pass filter was positioned at the input of the spectrometer to filter the scattered laser radiation delivered by the OPO.
Since the OPO spot (rectangle of 8x15 mm) was much larger than the plasma plume (typically a few mm), we focused the beam using a plano-convex fused silica lens (25.4-mm d i a m e t e r , / = 20 cm focal length) to achieve a reasonable spatial overlap. The OPO spot was measured to be about 2 mm^. The OPO energy was varied from a few ]iJ to a few hundreds of ]iJ, corresponding to a maximum fluence of a few tens of mJ/cm , which is much lower than the damage threshold of metals for nanosecond pulses [19].
35287.24 c m gm = 3 6s2 6p(2P%.5) 7s SP"! 283.31 nm Amo = 0.58x10⁸ s-'' 6s2 6 p 2 3 p ^ 405.78 nm 10650.47 cm-1 gn = 5 6s2 6p2 3p„ 90 = 1
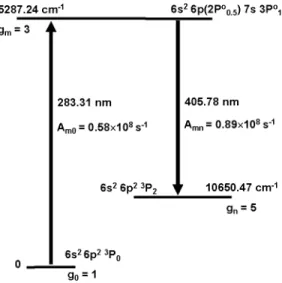
FIGURE 2. Energy level diagram of Pb for the states used in this study.
This set-up was used to probe small proportions of Pb in brass samples. In our experiments with solid samples, 200 spectra were acquired at each of 4 positions with a 1 mm inter-site distance in order to get a representative sampling and account for any eventual lack of spatial homogeneity. Also, 300 cleaning shots were performed prior any acquisition to avoid the contribution of surface contaminants. The repetition rate was 2 Hz to prevent any interaction between the laser and aerosols The samples were translated using a
double axis motorized stage (Newport, UTM 100 mm) controlled by a programmable controller (Newport, model ESP 300).
In our investigations of liquid samples, the set-up was practically the same as in Fig. 1 except that the optical fiber was moved away from the target to avoid splashes and a lens was used to focus the plasma radiation onto the fiber. The liquid samples used were composed of 96 % pure water, 4 % of HNO3, and small amounts of Pb. We used a simple recipient containing
the liquid to analyze, without any fluid circulation. For that reason, the laser repetition rate was kept at 0.25 Hz to avoid aerosols, bubbles and waves at the liquid surface, which spoils the reproducibility of measurements. 30 spectra were acquired for each set of parameters. Measurement of the noise was carried out by exposing the ICCD detector without ablation and without OPO lasers.
RESULTS AND DISCUSSION
The laser excitation and fluorescence decay scheme used in this study for the detection of lead is illustrated in Fig. 2. Lead atoms were excited by the OPO laser, tuned at 283.31 nm, from the ground level 6 PQ (denoted 0) to the 7s 3P°i level (denoted m) located at 35287.24 cm'\ The subsequent fluorescence signal associated to the spontaneous decay from the 7s 3P°i level to the 6 ^Pz level (denoted n) at 10650.47 cm"^ was then observed at 405.78 nm.LIBS-LIFS With Solid Targets
The LIF signal emitted by the excited Pb atoms depends essentially on: i) the wavelength (^opo), ii) the excitation energy (Eopo), iii) the ablation fluence (FABL), iv) the angle between the normal to the surface of the sample and the excitation pulse (0), v) the delay between the ablation and excitation pulses or inter-pulse delay (A//p), the acquisition delay (/), and finally vi) the integration window width (At).The angle of incidence of the OPO laser was set to 0 = 80° as shown in Fig. 1. The influence of this parameter was not studied here due to geometrical constraints in our set-up. The influence of the angle was discussed in [15], where it is mentioned that the best signal-to-noise ratio was obtained for angles 0 in the range of 80-90°, justifying our choice in the present study. • • 1 1 1 1 LIF Pb(l) 405,78 nm b . /
*^
c r . r ..
-360 380 +00 Wavelength (nm) 420
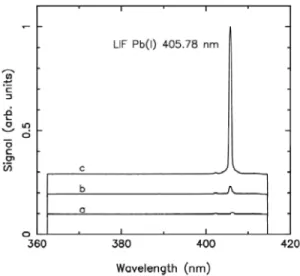
FIGURE 3. LIBS-LIFS spectra averaged over 100 shots obtained in different experimental conditions, a: without OPO, b: when the OPO is tuned slightly off-resonance (X = 282.85 nm) and finally c: when the OPO is on-resonance (X = 283.31 nm). The spectra a, b and c were shifted vertically for better readability.
Concerning the temporal gate width of the LIF signal, we found out experimentally that the LIF signal was observable from the arrival of the excitation beam into the plasma and typically lasted over the fluorescence decay time ~l/A„„, which is about 3.7 ns for the Pb(I) 405.78 nm line. Therefore, the delay and the temporal gate width were set to / = Atp and Z^ ~ 40 ns, respectively. (Actually, the acquisition was
performed a few ns prior to the OPO pulse to avoid any jitter.) Finally, the LIF signal was maximized for an entrance slit width of 350 ]im. It is worth pointing out that the spectral resolution is generally not a critical issue in LIBS-LIFS since the LIF signal lasts sufficiently little so that the signal of any neighbor strong line is negligible compared to the LIF signal. This specificity is of great interest for line-rich spectra
where spectral interferences limit sometimes the performances of LIBS.
In the following we investigate the influence of the remaining experimental parameters XQPO, F^BL, EQPO, and /Stip on the LIF signal emitted by Pb atoms. The influence of the major experimental parameters on the LIF signal emitted by Pb was mainly investigated using a brass sample containing 99.7207 % of Cu and 290 ppm of Pb.
Influence Of The OPO Wavelength
Figure 3 shows LIBS-LIFS spectra that were obtained in different experimental conditions: (a) without OPO, (b) when the OPO is tuned slightly off-resonance, and, finally, (c) when the OPO is on-resonance. The other parameters are FJIBL = 3.2 J/cm^, Eopo = 200 |jJ and A//p = 5 |js.
1
§ si a•^
1
?2
1
1000-100: 10- •• fii i - r'
, *
,* +
-f-^
*
A
290 ppm • • • * 0 « * * 30 ppm 1 • •:.
* ' ^ •-1 0.01 0.1 10 100 1000
Excitation energy, E^^ (|jJ)
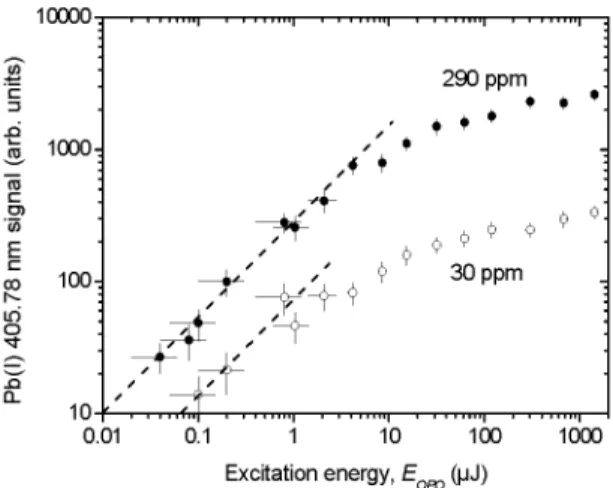
FIGURE 4. LIF signal of the Pb(I) 405.78 nm line as a function of the normalized OPO excitation energy.
One observes in Fig. 3 that without the OPO laser the Pb(I) 405.78 nm line is hardly discernible from the background emission. When getting closer to resonance, this line is clearly observable until it reaches a maximum at the resonance. This behaviour demonstrates that a coupling between the OPO laser and the plasma plume was achieved, leading to the settlement of the excited level of the fluorescence located at 35287.24 cm'^ (see Fig. 2). In principle the OPO pulse should be absorbed in the plasma both by the free electrons through inverse Bremsstrahlung, and by Pb impurities through resonant absorption. However, our measurements do not indicate any noticeable change of the background level with and without OPO laser indicating a negligible influence of the OPO pulse on the plasma properties.
Influence Of The Excitation (Opo) Energy Figure 4 shows the LIF signal of the Pb(I) 405.78 nm line as a function of the excitation energy EQPO-The energy delivered by the OPO laser was adjusted using a low energy pyroelectric detector (Ophir, PEIO)
and a set of neutral density filters. The results are presented for samples containing 30 ppm and 290 ppm of Pb. The other parameters used here are F^^/, = 2.4 J/cm^ and Istip = 5 [xs. Two distinct regimes can be observed in Fig. 4. For weak excitation energies, the LIF signal evolves linearly with the excitation energy, with a slope of 1 on the log-log scale. For much higher excitation energies, the LIF signal nearly saturates. This situation corresponds to the so-called optical saturation regime. One observes from Fig. 4, that the ratio of the saturation LIF signals for the two targets is about 10, i.e., the same as the Pb concentration ratio between the two samples. However, this ratio is smaller below saturation. When the excitation fluence Fexc (ie., laser energy per unit surface) is much smaller than the saturation fluence Fsat, the excitation probability of a single Pb atom in the ground state is just:
P., ^OmFexc IhVQl (1)
where obm is the absorption cross section for a transition from the ground state and the 35287.24 cm'^
excited state shown in Fig. 2, and h Vom is the excitation photon energy. The LIF signal is proportional to Pexc^Npb and thus to Fexc, as seen in Fig. 4. Saturation fluence occurs when P^, l,i.e.:
'^^Om/^Ow (2)
Estimation of cjom using the standard expressions [20] yield cJom ~ 2x10'^'^ cm^ and thus F^at ~ 20 |LiJ/cm^, or Eopo - 0 . 4 |iJ, which is not in contradiction with the saturation energy observed in Fig. 4 in the 30 ppm sample, as deviation from the linear regime seems to occur below 1 |LIJ. However, the saturation energy is obviously higher than 0.4 |LIJ in the 290 ppm case. The reason for this discrepancy is likely that Eq. (1) lies on the assumption that the Pb atoms are highly diluted in the plasma, a condition which is not verified in that case. Indeed, low coherence interferometry (LCI) measurements of the ablation craters indicates that a volume of about 6x10'^ cm^, or ~ 0.5 |ig of the brass sample, is ablated per laser shot. This means that a number of Pb atoms Np^ - 1 . 5 x 10^^ is ablated per laser shot in the 290 ppm case. The total Pb cross section is thus cTom^Pb ~ 3 mm^, which is comparable to the area of the side projection of the plasma, estimated
as a few mm . Therefore, the conditions underlying Eq. (1) are not respected in the 290 ppm case.
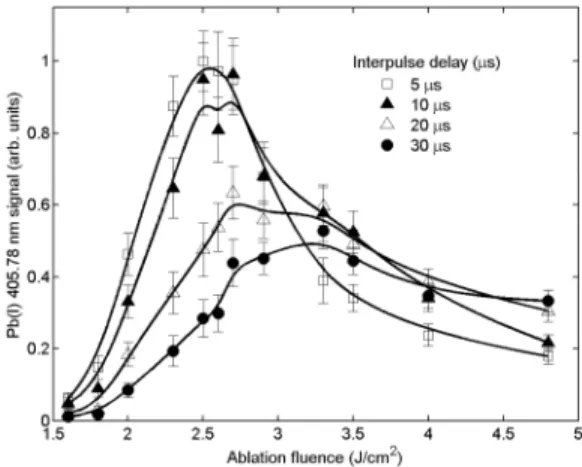
Influence Of Ablation Fluence And Inter-Pulse Delay Figure 5 shows the intensity of the Pb(I) 405.78 nm line as a function of the ablation fluence for several inter-pulse delays A//p. One observes that the Pb(I) 405.78 nm line signal reaches a maximum at ablation fluences which depend on the inter-pulse delay A//p. The maximum observed in Fig. 5 can be explained in the following way. When the ablation fluence is weak, i.e., below or close to the ablation threshold (about 1.5 J/cm^ here), the amount of ablated matter is negligible. Consequently, the LIF signal, which depends on the number of ablated Pb atoms, is very weak. As the ablation fluence increases, the amount of Pb atoms that can be excited by the OPO laser increases, so the LIF signal. However, for a given inter-pulse delay A//p, the plasma temperature increases as the fluence increases, so that fewer Pb atoms are available in the ground state. Thus, the maximum LIF signal is obtained when the number of Pb atoms ablated is large enough and when the temperature is low enough to keep a significant fraction of them in the ground state.
2.5 3 3.5 4 Ablation fluence (J/cm )
FIGURE 5. LIF signal of the Pb(I) 405.78 nm line as a function of the ablation fluence for several inter-pulse delays.
Figure 5 also shows that the maximum LIF signal appears for higher ablation fluences when the inter-pulse delay increases. This can be explained by the fact that higher fluences produce higher initial temperatures and thus longer times are required to reach a temperature value for which the number of Pb atoms in
the ground state is maximized. The decrease of the maximum LIF signal as the delay increases is due to plasma expansion, which decreases the amount of emitters in the collection volume of the optical fiber, and possibly the number of Pb atoms excited by the OPO.
The conclusion to be drawn from Fig. 5 is that, in our conditions, the Pb(I) 405.78 nm line intensity was maximum when the excitation laser pulse arrived about /Stip ~ 8 |js after the ablation laser pulse and the ablation fluence was about 2.7 J/cm^. These figures would however, be different for a different light collection geometry and possibly for a different overlap between the plasma and the excitation pulse. In the ideal case where all the emitters could be excited by the OPO laser and their LIF signal collected, the optimum LIF signal would be obtained for very high ablation fluence and very long inter-pulse delays.
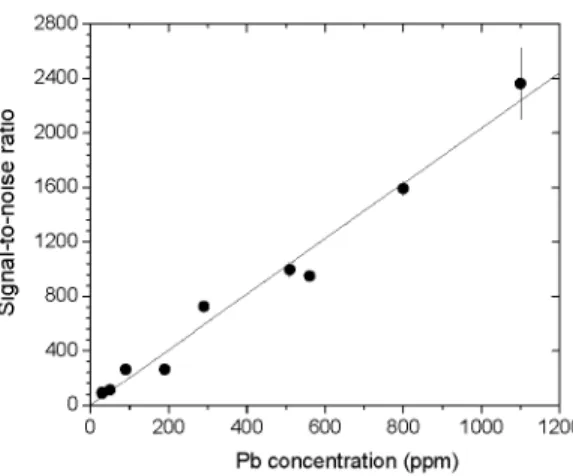
Libs-LIFS Limit Of Detection In Solids Figure 6 shows the intensity of the Pb(I) 405.78 nm line as a function of Pb concentration for a set of 10 calibration samples of brass whose Pb concentration ranged from 30 ppm to 1100 ppm. The ablation fluence, inter-pulse delay and OPO energy used for the measurements shown in Fig. 6 were the values found to maximize the LIF signal, as discussed above,
200
namely: FABL 2.7 J/cm , A//P = 8 |js, and Ec
2800 2400 = 2000 1600 •V 1200 .2) 800 400 400 600 800 1000 Pb concentration (ppm) 1200
FIGURE 6. Intensity of the Pb(I) 405.78 nm line as a function of Pb concentration for a set of 10 calibration samples.
The data shown in Fig. 6 exhibit a good linearity as the regression line (calibration curve) passing through the origin (0,0) is characterized by a correlation factor r^ = 0.986. The single-shot limit of detection resulting from Fig. 6 is about 1.5 ppm while accumulation over 100 shots leads to a LoD of about 200 ppb. These values were calculated on the basis of the usual 3a-convention, where a is the standard deviation of the background noise.
For comparison, we have also performed conventional LIBS measurements. The ablation fluence was about 41 J/cm^. The acquisition delay was / = 0.8 |js and the gate was A/ =15 |js. The slit width was 50 |jm and 100 acquisition shots were performed over 3 positions. Using the same 3a-convention, one obtains a single-shot LoD of about 200 ppm, i.e., about two orders of magnitude higher than the value measured using LIBS-LIFS.
LIBS-LIFS In Liquids
As mentioned above, our experiments in liquids were performed using almost the same set-up and similar laser parameters as for solid targets (see Fig. 1). A major difference is however that in liquids the ablation wavelength is critical in the reproducibility of the measurements. We found in particular that working at 266 nm provided more reproducible results than at 1064 nm in water. The reason is likely that the nonlinear absorption of the ablation laser in water is more efficient at shorter wavelengths. At 266 nm, only 3 photons are necessary to ionize water (ionization potential of 10.56 eV) while 10 photons are necessary at 1064 nm. The resulting electrons subsequently gain energy and induce ionization through the inverse Bremsstrahlung mechanism. Since the photo ionization
process is less efficient at 1064 nm, the ablation process will be more sensitive to the presence of seed electrons in the area of the laser focal spot.
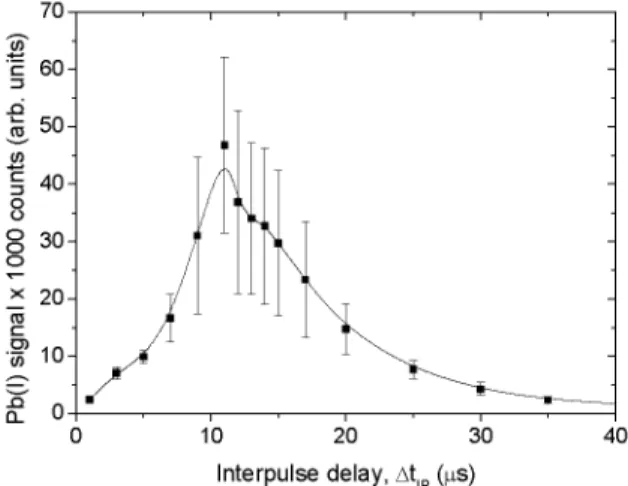
The LIF signal obtained as a function of the inter-pulse delay is shown in Fig. 7. In this experiment, the ablation fluence energy was about 4 J/cm^. One observes that the optimum LIF signal is obtained for a delay of about 11 ]is, which is very similar to the result obtained for brass samples, in Fig. 5. The large error bars are typical of liquids and reflect the lower reproducibility of the measurements than in solids. It is likely that a flowing liquid and a better control of the
aerosols produced by the ablation would improve the reproducibility.
In liquids, only rough estimates of the limit of detection have been made. Based on the number of counts obtained using our liquid sample containing 1000 ppm of Pb, we obtained a single shot LoD of about 0.5 ppm, which is four time better than in the solid samples. Note that the same reasoning applied to the solid samples containing 1100 ppm of Pb yield a LoD of 1.8 ppm, a value which is very close to the one obtained from the calibration curve.
10 20 30 Interpulse delay, At (^s)
40
FIGURE 7. Intensity of the Pb(I) 405.78 nm line as a function of the inter-pulse delay (Atjp) in water containing 1000 ppm of Pb.
RELIBS
The great selectivity of the LIBS-LIFS technique can be a shortcoming in some circumstances. Detecting more than one trace element in the plasma using LIBS-LIFS would require changing the wavelength of the OPO laser, which is usually a rather cumbersome operation. In RELIBS the main element in the plasma is excited instead of a trace element. The energy absorbed by a selected atomic state is then distributed over all elements in the plasma through
particle-particle collisions. Ideally, as in LIBS-LIFS, the second pulse is launched as late as possible to minimize background radiation due to Bremsstrahlung and recombination emission. However, this delay should not be too long since the particle-particle collision rate decreases as the plasma expands and cools down. Therefore an optimum inter-pulse delay for a given ablation fluence must be identified to optimize the LoD.
2p0 2<^ ^ 1 2 p 0 3 p 3p0 2p2 Cu(I) Pb(I)
FIGURE 8. Selective excitation of Cu(I), and subsequent collisional excitation and fluorescence of Pb(I).
8000 00 iri o 6000 4000 2000 324 325 326 327 OPO wavelength (nm) 328
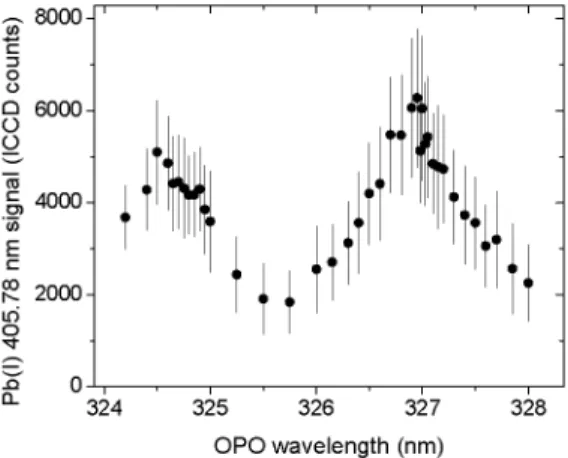
FIGURE 9. Pb(I) signal in a Cu matrix as a function of the OPO wavelength.
In the case of interest, the detection of Pb traces in brass samples, the RELIBS process can be schematized by Fig. 8. The OPO laser excites the Cu atoms in the ground state ^Si/2 to the state ^P° (either Pj/2 or
P3/2 ). Then the free electrons in the plasma undergo superelastic collisions with the excited atoms, in which the incident electrons de-excite the Cu atoms and gain the excitation energy. These electrons can thus excite the higher ^Pi/2 level of Pb (dashed lines in Fig. 8), which is then detected by the fluorescence processes discussed previously (Fig. 2).
Figure 9 shows the Pb fluorescence signal at 405.78 nm as a function of the OPO wavelength. The ablation pulse fluence was 1.8 J/cm^, the OPO pulse energy was
1.13 mJ and delay between the ablation pulse and the OPO pulse was 700 ns. The emission was integrated 600 ns after the ablation pulse over 5 ]is.
One can see that Pb signal shows two peaks corresponding to the Cu(I) 324.75 nm and 327.40 nm transitions, as schematized in Fig. 8. The spectral width of the peaks, seen in Fig. 9, result from the broadening of both the Cu states and the Pb states. Figure 9 clearly shows that the Pb emission is strongly enhanced when tuning the plasma resonances. Such an enhancement is generally not achieved in the common "double pulse" approach [21] in which the excitation wavelength is simply a harmonic of the available laser system.
4000- 3000- 2000- 100 0-• ' ^ ^ ^ RELIBS LIBS y 4 • ^ ^
/y~'
y^^X
" ^ ^
5 " * ^ ^ •^
•— "
• ^
'/
^ p -y"T^'
•
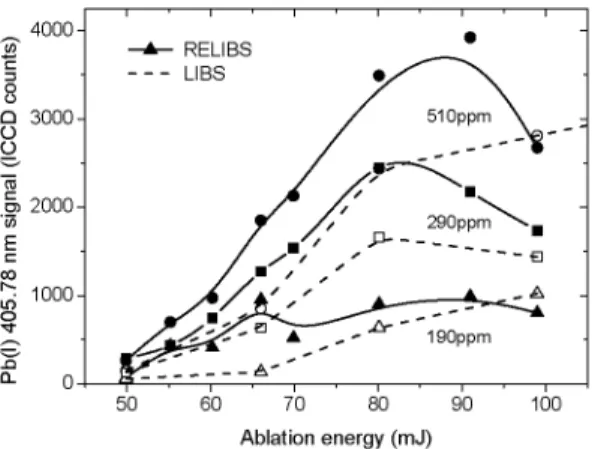
510ppm \ -• 2 9 0 p p m ^ \ _ ~ a A ^. A 190ppm 50 60 70 80 90 100 Ablation energy (mJ)FIGURE 10. Selective excitation of Cu(I) and subsequent coUisional excitation of Pb(I) for samples containing various concentrations of Pb : 510 ppm (circles), 290 ppm (squares), and 190 ppm (triangles).
Using the 327.4 nm transition in Cu(I) to excite the plasma, we have investigated the dependence of the Pb(I) 405.78 nm signal as a function of the ablation laser energy for different samples. The delay between the ablation pulse and the OPO pulse was fixed to 500 ns and the excitation energy was 1.38 mJ. The results are shown in Fig. 10. One observes that the RELIBS signal decreases for ablation energies higher than 80-90 mJ. This can be explained by the plasma expanding outside the collection volume, as in Fig. 5. Moreover, the RELIBS signal is generally not much greater than the LIBS signal except for the lowest ablation laser energy. This result is consistent with the general conclusion reached by Cheung et al. [18] that the advantage of RELIBS over LIBS appear mostly when a small amount of matter is ablated, i.e., for minimally destructive analysis.
SUMMARY AND CONCLUSION
The main objectives of this paper were: (i) to study the influence of the main experimental parameters on the LIF signal in solid and liquid samples, and (ii) to compare the Pb signals obtained using LIBS-LIFS and RELIBS to LIBS. In this paper, the detection of Pb traces in a brass matrix and in water was chosen as an illustrative purpose. However, the general conclusions drawn from this work could likely be also applied tothe detection of other trace elements in the framework of the LIBS-LIFS and RELIBS techniques.
A parametric study was first conducted to investigate the influence of the main experimental parameters on the LIF signal of Pb in brass samples. These parameters are: the excitation energy, the ablation fluence and the inter-pulse delay. Using a sample containing 290 ppm of lead, an optimum set of experimental parameters was identified. For our particular set-up, an ablation fluence of 2.7 J/cm^, an excitation energy greater than about 100 |jJ and an inter-pulse delay in the range 5-8 |js provided the optimum LIF signal. The same optimum delay was obtained for the detection of Pb in water.
Using the optimum parameters found, a calibration curve for lead in brass was produced using a set of 10 certified samples containing from 30 to 1100 ppm of lead. A single-shot limit of detection of about 1.5 ppm was achieved and this value was reduced to about 0.2 ppm after accumulation over 100 laser shots. This value can be estimated to be about 2 orders of magnitude lower than obtained from usual LIBS. A first estimation of the single-shot LoD in water samples gave about 0.5 ppm.
RELIBS was also investigated for brass samples and compared to LIBS in similar conditions. The Pb signal was not much different in the two cases except at lower ablation energy, which is consistent with the general conclusions found in literature. It was also shown that the Pb signal depends strongly on the
excitation w a v e l e n g t h , thus p r o v i n g that the p l a s m a excitation w a s n o t only a global reheating effect, as in the " d o u b l e - p u l s e " approach.
Further i m p r o v e m e n t s in the experimental arrangement, that w e r e b e y o n d the scope of this paper, could be performed to r e a c h lower L o D s w i t h o u t a c c u m u l a t i n g over a larger n u m b e r of shots. T h e L o D d e p e n d s critically on the optical collection system a n d the b a c k g r o u n d noise of the detector. In this context, it is likely that the s p e c t r o m e t e r / I C C D c o m b i n a t i o n could be replaced by an interferential filter and a photomultiplier ( P M T ) to reduce light losses a n d increase the p h o t o n c o n v e r s i o n efficiency.
REFERENCES
1. D. A. Rusak, B. C. Castle, B. W. Smith, and J. D. Winefordner, Crit. Review in Anal. Chem. 27, 257-290 (1997).
2. K. Meissner, T. Lippert, A. Wokaun and D. Guenther,
Thin Solids Films 453-454, 316-322 (2004).
3. P. Fichet, M. Tabarant, B. Salle and C. Gauthier, Anal
Bioanal Chem. 385, 338-344 (2006).
4. M. Nakane, A. Kuwako, K. Nishizawa, H. Kimura, C. Konagai and T. Okamura, Analysis of trace metal elements in water using laser-induced fluorescence for laser-breakdown spectroscopy, Faser Plasma Generation and Diagnostics, Proceedings of SPIF Vol. 3935, 122-131(2000).
5. S. Koch, W. Garen, W. Neu, R. Renter, Anal. Bioanal. C/zem. 385, 312-315(2006).
6. R.F. Neuhauser, U. Panne, R. Niessner, G.A. Petrucci, P. Cavalli and N. Omenetto, ^raa/. Chim. Acta 346, 37-48.(1977)
7. J. B. Gomushkin, J. F. Kim, B. W. Smith, S. A. Baker and J. D. Winefordner, ^/ip/. Spectro. 51, 1055-1059 (1997).
8. 1. B. Gomushkin, S. A. Baker, B. W. Smith, J. D. Winefordner, Spectro. Acta Part B 52, 1653-1662 (1997).
9. F. H.-Kortenbruck, R. Noll, P. Wintjens, H. Falk and C. Becker, Spectro. ActaB 56, 933-945 (2001).
10. W. Sdorra, A. Quentmeier and K. Niemax, Basic investigations for Faser Micranalysis: 11. Faser-lnduced Fluorescence in Faser-Produced Sample Plumes, Mikrochim. Acta [Wien] 1989,11, 201-218. 11. S. C. Snyder, J. D. Grandy and J. K. Partin, An
Investigation of laser-Induced Breakdown Spectroscopy Augmented by Faser-lnduced Fluorescence,
Proceedings of the ICAFFO'98, Section C, 254-261 (1998).
12. H. H. Felle, D. C. S. Beddows, G. W. Morris and O. Samek, Spectro. Acta B 56, 947-960 (2001). 13. B. W. Smith, 1. B. Gomushkin, F. A. King, J. D.
Winefordner, Spectro. ActaPartB 53, 1131-1138 (1998).
14. B. W. Smith, A. Quentmeier, M. Bolshov, K. Niemax,
Spectro. ActaPartB 54, 943-958 (1999).
15. O. Samek, M. Fiska, J. Kaiser and V. Krzyzanek, Faser ablation for mineral analysis in the human body: integration of FIFS with FIBS, Part of the FUROPTO Conference on Biomedical Optical Systems and Faser-Assisted Biotechnology, SPIF Vol. 3570, 263-271 (1998).
16. S. K. Ho and N. H. Cheung, Appl Phys Lett. 87, 264104(2005).
17. S. K. Ho andN. H. Cheung,^raa/. Chem. 11, 193-199 (2005).
18. S. F. Fui a n d N . H. Cheung,^raa/. Chem. 11, HiVI-liil'i (2005).
19. F. M. Cabalin and J. J. Fasema, Spectro. Acta. B 53, 723-730 (1998).
20. Ya. B. Zel'dovich and Yu. P. Raizer, Physics of shock waves and high-temperature hydrodynamic phenomena (Dover, New York, 2002) Chap. V.
21. F. St-Onge, V. Detalle, and M. Sabsabi, Spectro. ActaB 57, 121-135 (2002).