Publisher’s version / Version de l'éditeur:
Technical Report, 2010-08-01
READ THESE TERMS AND CONDITIONS CAREFULLY BEFORE USING THIS WEBSITE.
https://nrc-publications.canada.ca/eng/copyright
Vous avez des questions? Nous pouvons vous aider. Pour communiquer directement avec un auteur, consultez la
première page de la revue dans laquelle son article a été publié afin de trouver ses coordonnées. Si vous n’arrivez pas à les repérer, communiquez avec nous à PublicationsArchive-ArchivesPublications@nrc-cnrc.gc.ca.
Questions? Contact the NRC Publications Archive team at
PublicationsArchive-ArchivesPublications@nrc-cnrc.gc.ca. If you wish to email the authors directly, please see the first page of the publication for their contact information.
Archives des publications du CNRC
For the publisher’s version, please access the DOI link below./ Pour consulter la version de l’éditeur, utilisez le lien DOI ci-dessous.
https://doi.org/10.4224/17210696
Access and use of this website and the material on it are subject to the Terms and Conditions set forth at
Assessment of Thermal Protection and Microclimate In SOLAS Approved Lifeboats
Mak, L.; Kuczora, A.; Farnworth, B.; Brown, R.; Ducharme, M.
https://publications-cnrc.canada.ca/fra/droits
L’accès à ce site Web et l’utilisation de son contenu sont assujettis aux conditions présentées dans le site LISEZ CES CONDITIONS ATTENTIVEMENT AVANT D’UTILISER CE SITE WEB.
NRC Publications Record / Notice d'Archives des publications de CNRC: https://nrc-publications.canada.ca/eng/view/object/?id=38d52443-f092-4759-9e80-e53104dc2d0e https://publications-cnrc.canada.ca/fra/voir/objet/?id=38d52443-f092-4759-9e80-e53104dc2d0e
REPORT NUMBER
TR-2010-05
NRC REPORT NUMBER DATE
March 2010
REPORT SECURITY CLASSIFICATION
UNCLASSIFIED
DISTRIBUTION
UNLIMITED
TITLE
ASSESSMENT OF THERMAL PROTECTION AND MICROCLIMATE IN SOLAS APPROVED LIFEBOATS
AUTHOR(S)
Mak, L.1, Kuczora, A.1, Farnworth, B.2, Brown, R.3 and DuCharme, M.B.4
CORPORATE AUTHOR(S)/PERFORMING AGENCY(S)
1
National Research Council Canada, Institute for Ocean Technology
2
Helly Hansen Canada
3
Marine Institute, Offshore Safety and Survival Center
4
Defence R&D Canada
PUBLICATION
-
SPONSORING AGENCY(S)
Transport Canada
IOT PROJECT NUMBER
PJ2331
NRC FILE NUMBER KEY WORDS
Lifeboats, evacuation, Arctic, ventilation, microclimate, thermal protection, heat stress, cold stress, thermal manikin,
mathematical model PAGES 24 + App. A FIGS. 11 TABLES 4 SUMMARY
The objective of the present study was to assess the thermal protection and ventilation rate of lifeboats for the Arctic environment. Two SOLAS approved lifeboats were used for model
development: a 72-person lifeboat with engine off and a 20-person lifeboat with engine on operating at 6 knots and 3 knots.
The dilution experiments (where the rate of reduction of concentration in injected carbon dioxide was estimated, to determine ventilation rate) with the 72-person lifeboat found that the lifeboat had a ventilation rate of 2 l/s with vents open, which is inadequate to maintain carbon dioxide level below 5000 ppm. The 20-person lifeboat had 11.6 l/s at full engine power and 7.8 l/s at half power; both being inadequate ventilation rates.
A thermal manikin and a mathematical model were used to assess heat and cold stress of lifeboat occupants under various lifeboat, occupancy and ventilation conditions in the Arctic summer
environment. In a lifeboat with the engine running, the occupants are likely to suffer heat stress unless a ventilation rate of several hundred litres per second can be achieved.
In conclusion, the use of a thermal manikin supported by a simple heat loss model helped define the adequate ventilation rates in lifeboats under simulated Arctic summer conditions and showed that the current risks are mainly carbon dioxide toxicity and heat stress.
ADDRESS National Research Council
Institute for Ocean Technology Arctic Avenue, P. O. Box 12093
Institute for Ocean Institut des technologies Technology océaniques
ASSESSMENT OF THERMAL PROTECTION AND MICROCLIMATE IN SOLAS APPROVED LIFEBOATS
TR-2010-05
Mak, L.1, Kuczora, A.1, Farnworth, B.2, Brown, R.3 and DuCharme, M.B.4
March 2010
1National Research Council Canada, Institute for Ocean Technology 2
Helly Hansen Canada
3
Executive Summary
Lifeboats are used as a means of evacuation from offshore structures and marine vehicles. Currently, the International Maritime Organization (IMO) Lifesaving Appliances (LSA) Code does not specify thermal protection and ventilation criteria for lifeboats.
The objective of the present study was to assess the thermal protection and ventilation rate of lifeboats for the Arctic environment. Two SOLAS approved lifeboats were used for model development: a 72-person lifeboat with engine off and a 20-person lifeboat with engine on operating at 6 knots and 3 knots.
The dilution experiments (where the rate of reduction of concentration in injected carbon dioxide was estimated, to determine ventilation rate) with the 72-person lifeboat found that the lifeboat had a ventilation rate of 2 l/s with vents open, which is inadequate to maintain carbon dioxide level below 5000 ppm. The 20-person lifeboat had 11.6 l/s at full engine power and 7.8 l/s at half power; both being inadequate ventilation rates.
A thermal manikin and a mathematical model were used to assess heat and cold stress of lifeboat occupants under various lifeboat, occupancy and ventilation conditions in the Arctic summer environment. In a lifeboat with the engine running, the occupants are likely to suffer heat stress unless a ventilation rate of several hundred litres per second can be achieved.
The effect of occupant heat loss with ventilation was also assessed in the 72-person lifeboat with the engine off. When the lifeboat is carrying half the number of people for which it is rated and when these occupants are wearing dry reference clothing and lifejacket, the ventilation rate could be increased to 100 litres per second (minimum ventilation to keep carbon dioxide below 5000 ppm is 27 l/s) to achieve thermoneutral heat loss (51.7 W/m2). When the lifeboat is fully loaded, the ventilation rate can be increased to 300 l/s to achieve a similar microclimate (minimum ventilation rate to keep carbon dioxide level below 5000 ppm is 54 l/s). A higher ventilation rate is required if the engine is on. This suggests that an increase in ventilation rate needs to be implemented to avoid heat stress and provide adequate ventilation.
In conclusion, the use of a thermal manikin supported by a simple heat loss model helped define the adequate ventilation rates in lifeboats under simulated Arctic summer conditions and showed that the current risks are mainly carbon dioxide toxicity and heat stress.
Table of Contents
List of Figures ...iv
List of Tables...iv
1.0 INTRODUCTION...1
2.0 PROJECT OBJECTIVES...3
3.0 TEST PROGRAM ...4
3.1 TESTS WITH A 72-PERSON LIFEBOAT...4
3.2 TESTS WITH A 20-PERSON LIFEBOAT...5
4.0 TEST SETUP ...6
4.1 TESTS WITH A 72-PERSON LIFEBOAT...6
4.2 TESTS WITH A 20-PERSON LIFEBOAT...8
5.0 MANIKIN ...9
6.0 RESULTS AND DISCUSSION ...11
6.1 VENTILATION RATE...11
6.1.1 Ventilation Rate in 72-person Lifeboat...11
6.1.2 Ventilation rate in 20-person lifeboat...15
6.2 THERMAL INSULATION VALUES...16
7.0 MODELLING ...18
7.1 HEAT AND COLD STRESS IN 72-PERSON LIFEBOAT WITH NO ENGINE HEAT...18
7.2 HEAT AND COLD STRESS IN 72-PERSON LIFEBOAT WITH ENGINE HEAT...20
7.3 THE EFFECT OF VENTILATION ON OCCUPANT HEAT LOSS...21
8.0 CONCLUSIONS AND RECOMMENDATIONS...22
9.0 ACKNOWLEDGMENTS ...23
10.0 REFERENCES... 23
List of Figures
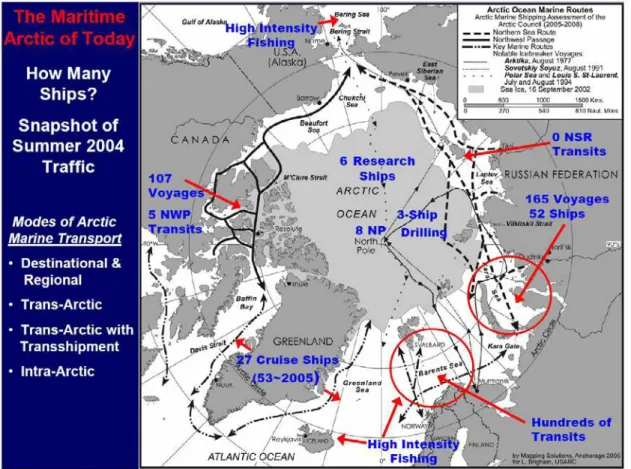
Figure 1. Snapshot of Summer 2004 Marine Traffic...1
Figure 2. Incident summary tables, 1995-2004 (AMSA, 2009)...2
Figure 3. Experimental setup of a 72-person SOLAS lifeboat ...6
Figure 4. Measured lifeboat wind profile...7
Figure 5. NRC-IOT 20-person lifeboat during sea trial ...9
Figure 6. NEMO submersible thermal manikin...10
Figure 7. Carbon dioxide dilution tests to estimate the ventilation rate of three passive ventilation conditions inside a 72-person lifeboat ...13
Figure 8. Carbon dioxide concentration with 21 human subjects in lifeboat ...14
Figure 9. Repeatability of carbon dioxide dilution tests ...15
Figure 10. Model prediction of occupant cold or heat stress (coverall, 50% occupancy, engine off) ...19
Figure 11. Model prediction of occupant cold or heat stress (coverall, 50% occupancy, engine on) ...20
List of Tables Table 1. Measured ventilation rates for different conditions in litres per second (72-person lifeboat) ...12
Table 2. Measured ventilation rates for different conditions in litres per second (20-person lifeboat) ...16
Table 3. Clothing thermal insulation values measured by NEMO thermal manikin inside lifeboat ...17
ASSESSMENT OF THERMAL PROTECTION AND MICROCLIMATE IN SOLAS APPROVED LIFEBOATS
1.0 INTRODUCTION
In recent years, the amount of sea ice in the Canadian Arctic has declined, opening new opportunities for shipping and offshore activities. Several economic forces, including mining developments, increased Arctic cruise ship tourism, and the growth of Arctic communities all point towards increased shipping activity in the Arctic (NRC, 2007). In addition, once the Aboriginal Pipeline Group builds a gas pipeline to the Mackenzie Delta, the offshore oil and gas activity in the Canadian Beaufort Sea will likely pick-up (Brigham, 2004).
Canada, Finland and USA led the Arctic Marine Shipping Assessment (AMSA). Its progress report pointed out that 10% of Canadian flagged Arctic vessel traffic are passenger vessels and cruise ships (PAME, 2006). Figure 1 provides a snapshot of the amount and types of traffic in the Arctic (Brigham, 2007). In Davis Strait alone, which lies between Greenland and Baffin Island, the Canadian territory of Nunavut, there were 27 and 53 cruise ship transits in 2004 and 2005 respectively.
The types of vessels that service the marine-based tourism industry range from relatively small expedition style vessels that has less than 200 passengers, to large luxury cruise liners that can hold 1,000 passengers or more (AMSA, 2009)
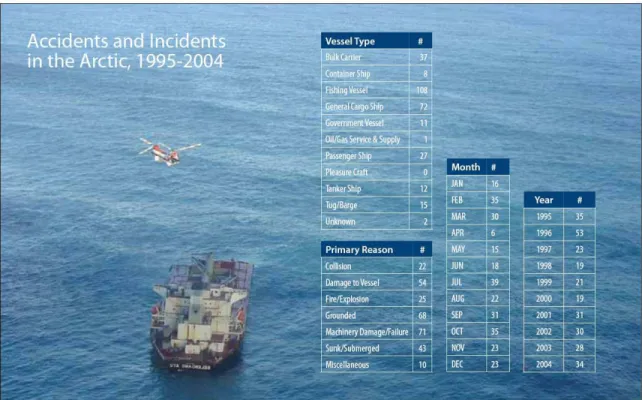
Icebergs, pack ice and multi-year ice will continue present major hazard to shipping, even for ships with reinforced or double hulls. In Antarctica, the recent sinking of the MS Explorer, a Canadian owned vessel, specifically designed with a reinforced hull to sail the icy waters, dispelled the myth and over expectation of cruise ship safety. It does not only reminded us of the danger of sailing in ice infested waters but also the importance of life saving appliances, both group and personal, in ensuring survival of occupants in the prevailing weather conditions. In its report, the commissioner has recommended that Liberian flag passenger vessels traveling to Polar Regions carry immersion suits for all passengers and crew (The Bureau of Maritime Affairs, 2009). The types of accidents in the Arctic between 1995 and 2004 are summarized in Figure 2 (AMSA, 2009).
Figure 2. Incident summary tables, 1995-2004 (AMSA, 2009)
Recognizing that ships are now traveling to remote locations and search and rescue resources are limited, the IMO Sub-Committee on Radiocommunications and Search and Rescue (COMSAR) has proposed to extend the “time to recover” period to 5 days, which is the length of time beginning with the completion of the ship abandonment and ending when all persons have been recovered from survival craft into a 'place of safety' or a 'temporary place of safety' (IMO, 2006).
In Canada, assuming the location of the sea disaster can be immediately identified and good weather conditions, it will take Canadian Forces 6 to 8 hours by plane and
Canadian Coast Guard 3.5 days by icebreaker to reach the site from port, even though an icebreaker is present in the Arctic during the summer months. Such limitations highlight the importance of survivors to be able to rely on their personal and group survival equipment to sustain themselves for days. Although, under a trilateral agreement, United States and Russia will also deploy their search and rescue resources in the event of a major maritime disaster.
Under Canadian and international law, all large commercial vessels and passenger vessels are required to provide survival craft for the evacuation of passengers and crew should vessel abandonment be required. Survival Craft on Canadian ships comply with the Life Saving Regulations of the Canada Shipping Act and are generally certified to the requirements of the International Convention of the Safety of Life at Sea (SOLAS). The SOLAS standards for survival craft are set out by the International Maritime
Organization (IMO) in the International Life-Saving Appliances (LSA) Code (Resolution MSC.48[66]) and Testing and Evaluation of Life-Saving Appliances (Resolution
MSC.81[70]).
Enclosed lifeboats carried on large commercial vessels and partially enclosed lifeboats carried on passenger vessels are therefore designed and constructed to meet the performance goals identified in the LSA Code and related documents. Some of these performance goals address the protection of lifeboat occupants after evacuation as identified in the general requirement that such survival craft “…provide protection for its complement against wind, rain and spray, adequate ventilation and protection for its complement at all ambient temperatures between -15 ºC and +30 ºC” (IMO, 1983).
Unfortunately, no specific performance criteria are identified to support these general requirements. Therefore, in the testing of survival craft, there is no meaningful assessment of thermal protection or ventilation. The survival challenge is further complicated by unpredictable ventilation performance.
In particular, with a fully enclosed lifeboat, low ventilation rates quickly result in
unacceptable air quality inside the lifeboat but, at higher ventilation rates, the heat lost from the lifeboat can be unacceptable. All survival craft nominally provide some thermal protection and have some means for ventilation but are these levels of protection
adequate?
2.0 PROJECT OBJECTIVES
The objectives of this project are to assess the thermal protection and microclimate of a SOLAS approved lifeboat in a cruise ship abandonment situation in the Arctic. The results will allow us to establish realistic criteria for lifeboat thermal protection and ventilation performance. This new work extends the methods developed in the thermal
protection in liferaft study (Mak et al., 2009) and applies them to the thermal protection and ventilation performance of enclosed and partially enclosed lifeboats.
This is to help Transport Canada address current shortcomings in International Maritime Organization (IMO) regulations where there is a lack of performance criteria in thermal protection and ventilation for lifeboats, while enhancing the emergency survival, health and safety, and operational performance of lifeboat occupants.
3.0 TEST PROGRAM
The test program was divided into two phases with two different lifeboats. First, experiments were conducted using a 72-person SOLAS approved lifeboat for model development with engine off. Then, a sea trial was conducted using a 20-person lifeboat to assess the engine heat input into the cabin for model development with engine on.
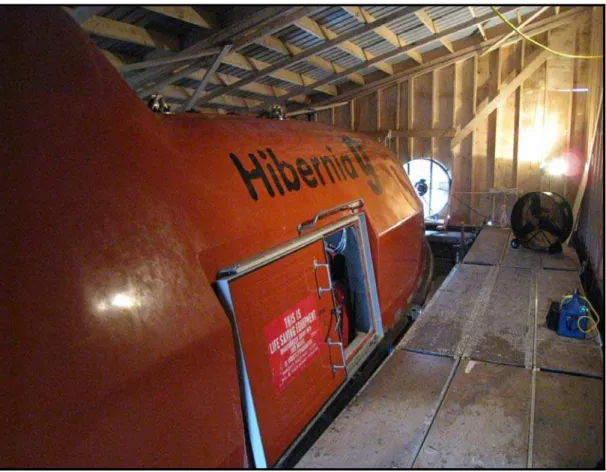
3.1 Tests with a 72-person Lifeboat
With the 72-person lifeboat, experiments were conducted in an outdoor tank. A wooden shelter was built around the tank to reduce the solar, rain, wind and snow effects on the controlled experiments. Four types of experiments were conducted without the engine running:
• Ventilation rate tests
• Human subject tests to study the microclimate of the lifeboat
• Manikin tests to determine the thermal insulation of occupants with different clothing systems inside the lifeboat
• Tests to determine the heat transfer coefficients of different areas in the lifeboat The ventilation rate was studied in the following conditions:
• Passive ventilation
o Closed side hatches, closed vents o Closed side hatches, open vents
o Open side hatches, open vents (This case simulates partially enclosed lifeboats)
• Active ventilation
o Closed side hatches, open vents, active ventilation.
Active ventilation was implemented to simulate a dedicated system that continuously sucks air out of the passenger cabin, creating a vacuum so fresh air could enter through the vents. It was implemented using a blower that vented cabin air to the outside. A valve was used to adjust how much cabin air was vented to the outside and thus control the ventilation rate.
The reference clothing ensemble include a cotton t-shirt, cotton briefs, cotton socks, one-piece cotton coverall (model Big Bill 414; Codet Inc., Magog, QC). Thermal resistance values were evaluated using the following clothing ensembles:
• Dry reference clothing plus SOLAS life jacket (model MD8000; Mustang Survival Ltd., Richmond, BC)
• Wet reference clothing plus SOLAS life jacket
• Dry reference clothing plus thermal protective aid (TPA) with reflective inner liner and SOLAS life jacket
• Wet reference clothing plus thermal protective aid (TPA) with reflective inner liner and SOLAS life jacket
• Dry reference clothing plus marine abandonment suit • Wet reference clothing plus marine abandonment suit • Dry reference clothing plus parka
• Dry reference clothing plus parka and snow pants
• Dry reference clothing plus TPA without reflective inner liner • Wet reference clothing plus TPA without reflective inner liner • Wet reference clothing plus wet fleece
• Wet reference clothing plus wet fleece and TPA
3.2 Tests with a 20-person Lifeboat
The tests with a 20-person lifeboat were conducted at sea in Holyrood, Newfoundland. During the test, two technical officers were onboard to operate the boat and the data acquisition equipment. Two types of experiments were conducted without the engine running:
• Ventilation rate tests
• Tests to determine the heat transfer coefficients of different areas in the lifeboat The ventilation rate was studied in the following conditions:
• Passive ventilation
o Closed side hatches, closed vents, full engine power o Closed side hatches, closed vents, half engine power
o Open side hatches, closed vents, full engine power (This case simulates partially enclosed lifeboats)
o Open side hatches, closed vents, half engine power (This case simulates partially enclosed lifeboats)
• Active ventilation
o Closed side hatches, closed vents, active ventilation, full engine power. o Closed side hatches, closed vents, active ventilation, half engine power.
4.0 TEST SETUP
4.1 Tests with a 72-person Lifeboat
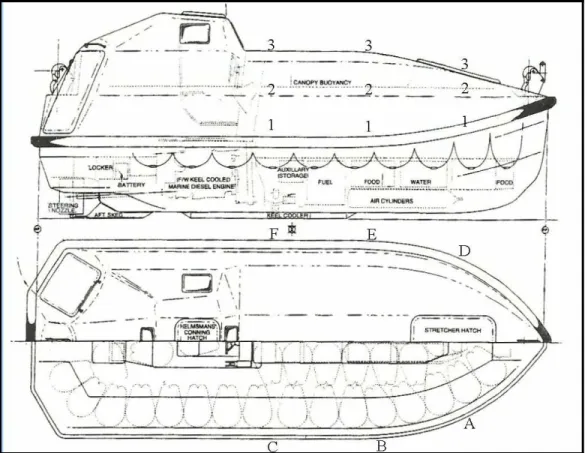
The test setup is shown in Figure 3. The 72-person lifeboat, with engine turned off, was moored to the sheltered outdoor tank. Four fans blew wind towards the bow of the lifeboat and a pump circulated water around the hull, to reduce boundary layer and to simulate the lifeboat sailing into the wind. The measured wind profile around the lifeboat is shown in Figure 4. It shows that the average wind velocity up to the middle of the lifeboat was around 2.5 meters per second.
Wind Velocity [m/s] Elevation Location 1 2 3 A 2.8 2.8 2.0 B 2.2 2.5 2.3 C 2.0 1.9 1.8 D 3.0 2.8 2.5 E 2.9 2.7 2.4 F 2.7 2.4 2.1
Figure 4. Measured lifeboat wind profile
The 72-person lifeboat was equipped with the following sensors:
• 10 Heat flow sensors, each with two channels to measure heat flux and temperature (Model F-025-TH44033-F6 and F-002-4-TH44033-F20; Concept Engineering, Old Saybrook, CT)
• 11 Temperature sensors (Model ON-401-PP; OMEGA Engineering, inc., Stamford, CT)
• 2 Carbon dioxide sensors, one with a range from 0 to 50,000 ppm1
(Model T-1047 CO2 Transmitter 4-20mA, Conspec, Toronto, ON) and another with a range from 0 to 10,000 ppm (Model 6123780K, Nova, Hamilton, ON)
• 2 Wind velocity sensors (Model 1405-PK-040; Gill Instruments Ltd., Lymington, Hampshire)
• 1 Humidity sensor (Model HMP50, Vaisala, Helsinki, Finland)
Outside of the lifeboat, the following sensors were installed to record the environmental conditions
• 1 Air temperature sensor (Model ON-401-PP; OMEGA Engineering, inc., Stamford, CT)
• 2 Water temperature sensors (Model ON-401-PP; OMEGA Engineering, inc., Stamford, CT)
• 1 Humidity sensor (Model HMP50, Vaisala, Helsinki, Finland)
• 1 Wind velocity sensor (Model 1405-PK-040; Gill Instruments Ltd., Lymington, Hampshire)
Data were acquired at 1 Hz using GDAC, a data acquisition system designed in-house by National Research Council Canada.
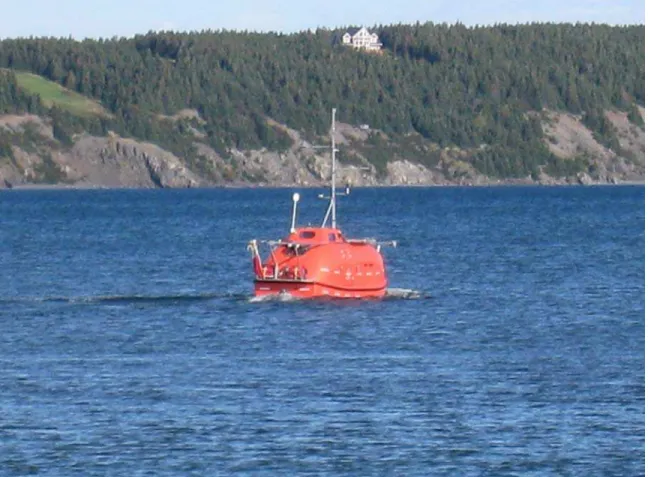
4.2 Tests with a 20-person Lifeboat
The sea trial with NRC-IOT 20-person lifeboat is shown in Figure 5. The test was conducted in Holyrood, Newfoundland in late September to early October 2009. During that time period, the water temperature averaged 11ºC and air temperature averaged 15ºC. Wind was between 10-15 knots. Average wave height was between 0.3 m to 0.6 meter. For full engine power and half engine power tests, the lifeboat sailed at 6 knots (or 3.1 m/s) and 3 knots (or 1.5 m/s) respectively.
The 20-person lifeboat was equipped with the following sensors:
• 10 Heat flow sensors, each with two channels to measure heat flux and temperature (Model F-025-TH44033-F6 and F-002-4-TH44033-F20; Concept Engineering, Old Saybrook, CT)
• 12 Temperature sensors (Model ON-401-PP; OMEGA Engineering, inc., Stamford, CT)
• 1 Humidity sensor (Model HMP50, Vaisala, Helsinki, Finland) • 2 Carbon dioxide sensors, one with a range from 0 to 50,000 ppm2
(Model T-1047 CO2 Transmitter 4-20mA, Conspec, Toronto, ON) and another with a range from 0 to 10,000 ppm (Model 6123780K, Nova, Hamilton, ON)
• 2 Wind velocity sensors (Model 1405-PK-040; Gill Instruments Ltd., Lymington, Hampshire)
Data were acquired at 1 Hz using GDAC, a data acquisition system designed in-house by National Research Council Canada.
Figure 5. NRC-IOT 20-person lifeboat during sea trial
5.0 MANIKIN
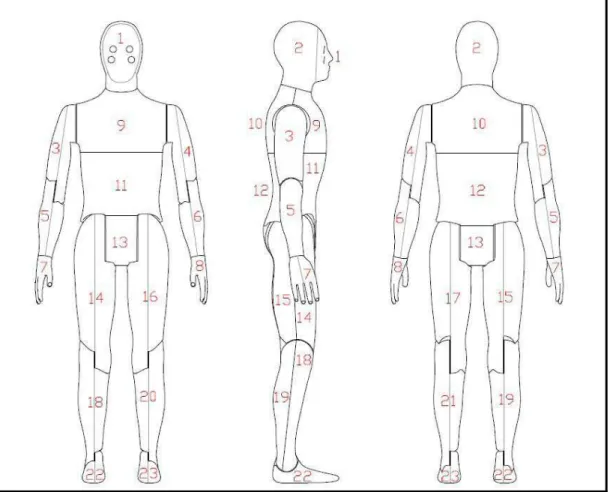
A Measurement Technology Northwest (Seattle, Washington, USA) NEMO 23-zone submersible thermal manikin was used in this study (Figure 6). Its stature represents a 50th percentile adult North American male, weighting 71 kg. The manikin shell is made of aluminum. Each thermal zone is equipped with heaters to generate uniform heating of the aluminum shell and two precision thermistors to measure skin temperature. The thermal manikin operates on 60Hz AC electrical power, 200-250 VAC with a maximum current of 20 Amps.
Figure 6. NEMO submersible thermal manikin
The main components of the thermal manikin include:
• Thermal manikin with heaters, sensors and internal controllers for regulation and monitoring
• Power supply enclosure which includes the heater power supply, ground isolation meter, serial data converter module, master zone controller, and an air pressure regulator.
• Ambient sensors (2 temperature, 1 relative humidity and 1 wind speed) • Interconnect cabling and air pressure supply hose
• Laptop with ThermDAC control software.
The ThermDAC control software is a 32-bit Windows based program that controls, records and displays real-time zone information numerically and graphically. Each thermal zone is individually controlled using either a temperature control, constant heat flux or comfort equation output. For this project, constant temperature control mode was used.
Experiments generated comma delimited (*.CSV) data files suitable for directly
setpoint, and logging interval. The data consists of a time stamp, followed by, in order, all zone temperatures, all zone heat fluxes, area weighted average temperature, area weighted heat flux, area weighted thermal resistance, ambient temperature, and relative humidity.
6.0 RESULTS AND DISCUSSION 6.1 Ventilation Rate
Passive ventilation rates were determined by dilution method, with the following equation. e i t C C D V Q= ln where
Q = Ventilation rate into and out of the lifeboat [m3/s] V = Volume of the lifeboat [m3]
Dt = Elapsed time [s]
Ci = Initial concentration of carbon dioxide in lifeboat [ppm]
Ce = Final reduced concentration of carbon dioxide in lifeboat [ppm]
Active ventilation rate was determined by two methods, with a handheld hot wire anemometer (Omega HHF42) and dilution method.
6.1.1 Ventilation Rate in 72-person Lifeboat
The inside volume of the 72-person lifeboat was estimated to be 42.83 m3. The ventilation rate, which was measured using a handheld hot wire anemometer and dilution method, is shown in Table 1.
Table 1. Measured ventilation rates for different conditions in litres per second (72-person lifeboat) Condition Target ventilation rate for 30 person experiment [l/s] Hot wire anemometer [l/s] Dilution method [l/s]
Closed side hatches, close vents
1
Closed side hatches, open vents
2
Open side hatches, open vents
95
High rate active ventilation (for 30 occupants, assuming 1 MET physical activity, safety factor3 = 2). Closed side hatches, open vents.
45 47 42
424
75% of high rate active ventilation (for 30 occupants, assuming 1 MET physical activity, safety factor = 2). Closed side hatches, open vents.
35 35 31
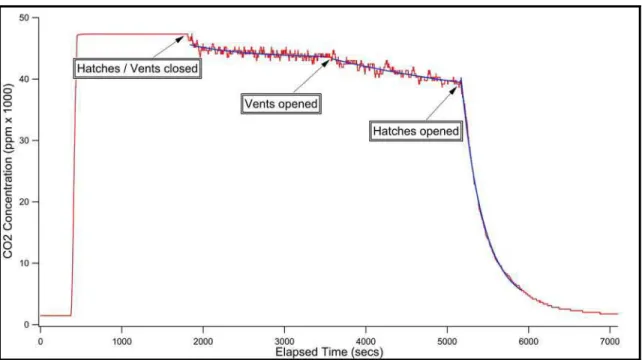
Figure 7 shows a dilution test used to establish the ventilation rate of three passive ventilation conditions – fully sealed lifeboat, lifeboat with only vents open and lifeboat with vents and side hatches open. The data collected is shown in red and the fitted curve is shown in blue. Throughout the test, fans were blowing 2.5 meters per second head wind at the lifeboat.
3
Assuming 1 MET physical activity and RER of 0.85, a ventilation rate of 0.75 litres per second is required to keep carbon dioxide concentration below the 5000 ppm safety limit. We used a safety factor of 2 to account for uncertainty with the 1 MET
Figure 7. Carbon dioxide dilution tests to estimate the ventilation rate of three passive ventilation conditions inside a 72-person lifeboat
Between 0 and 1900 seconds, carbon dioxide was injected into the lifeboat through an open hatch. All other hatches and vents were closed. Initially, the carbon dioxide level rose above the sensor range of 50,000 ppm. When the carbon dioxide level dropped within range of the sensor at around 1900 seconds, the hatch was closed and the lifeboat was completely sealed between 1900 and 3800 seconds. There was very little leakage, with ventilation rate estimated at 1 litre per second. Vents were opened between 3800 and 5200 seconds. The ventilation rate from open vent only was
estimated to be 2 litres per second. At 5200 seconds, the side hatches were opened till the end of the test. The ventilation rate with side hatches and vents open was estimated to be 95 litres per second (Table 1).
Assuming lifeboat occupants have 1 Metabolic Equivalent (MET) physical activity
(similar to someone sitting down watching TV), each person will consume approximately 3.5 ml/min/kg of oxygen (VO2 resting). If the respiratory exchange ratio, RER, is assumed
to be 0.85 (Tikuisis, 1999), the rate of carbon dioxide production for a 75 kg person (50th percentile North American male) can be estimated to be 3.8 milliliters per second carbon dioxide. To keep carbon dioxide concentration below the 5000 ppm safety limit (ACGIH, 2004)5, each person needs a ventilation rate of 0.75 litres per second. For a 72-person lifeboat, the minimum ventilation rate required is 54 litres per second, yet the ventilation rate with only vents open is 2 litres per second. The 1 MET metabolic rate is very conservative. It is possible that occupants may be stressed or may have exerted themselves carrying out survival tasks. If lifeboat occupants have 2 MET physical
5
The American Conference of Governmental Industrial Hygienists (ACGIH) has recommended carbon dioxide a Threshold Limit Value, Time Weighted Average (TLV-TWA)1 of 5,000 ppm.TLV-TWA (Threshold Limit Value, Time Weighted Average) is the average
activity, the minimum ventilation rate required is 108 litres per second. This ventilation rate is similar to that with side hatches open (95 litres per second), which simulates a partially enclosed lifeboat.
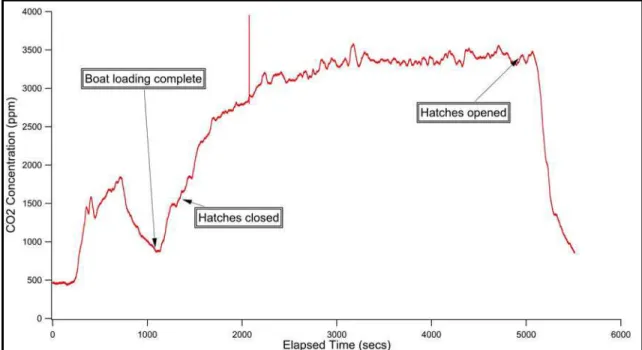
To verify that the above ventilation rate estimate is able to keep carbon dioxide concentration to below 5000 ppm, human subject tests under controlled active ventilation condition were conducted. Human subjects were free to add or remove clothing to achieve thermal neutrality, so they do not suffer from cold or heat stress during the experiment. Fans were blowing 2.5 meters per second head wind at the lifeboat. The active ventilation rate was set to 45 litres per second (0.75 litres per second x 30 person x safety factor of 2) based on 30 subjects in the lifeboat. Hatches were closed but vents were opened, so fresh air could enter with the active ventilation system operating.
We confirmed using hot wire anemometer and dilution tests that the ventilation rates achieved were 47.1 litres per second and 42 litres per second respectively (Table 1). On the day of testing, 21 persons entered the lifeboat. During the one-hour experiment, the carbon dioxide concentration increased sharply initially but stabilized at around 3500 ppm (see Figure 8). This demonstrated that the estimation method discussed above was working and that much higher ventilation rate than 2 litres per second from open vents only is required to supply adequate oxygen to the lifeboat occupants.
Figure 8. Carbon dioxide concentration with 21 human subjects in lifeboat
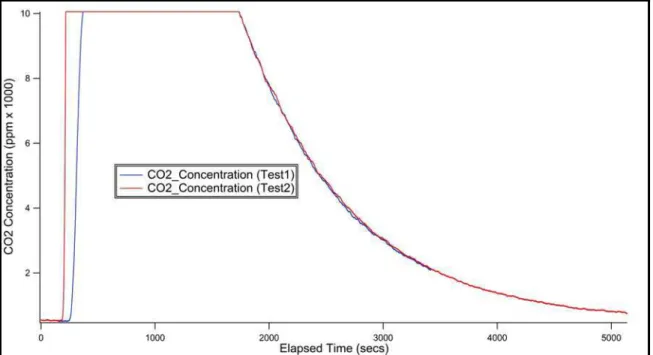
The repeatability of the dilution tests were shown in Figure 9, where the active
Figure 9. Repeatability of carbon dioxide dilution tests
6.1.2 Ventilation rate in 20-person lifeboat
The inside volume of the 20-person lifeboat was estimated to be 14.38 m3. The
ventilation rate, which was measured using the dilution method, is shown in Table 2. As discussed in the previous section, if lifeboat occupants have 1 MET physical activity, the minimum ventilation rate required to keep carbon dioxide concentration below the 5000 ppm safety limit is 15 litres per second for 20 people (0.75 litres per second x 20 person x safety factor of 1). However, the ventilation rate with open vents was only half of that (11.6 litres per second with full power and 7.8 litres per second with half power). It has already been mentioned that 1 MET physical activity is very conservative. If lifeboat occupants have 2 MET physical activity, the ventilation rate required will double to 30 litres per second. Again, this shows inadequate ventilation in the 20-person lifeboat.
Table 2. Measured ventilation rates for different conditions in litres per second (20-person lifeboat)
Condition Dilution
method [l/s]
Closed side hatches, open vents, full engine power 11.6 Closed side hatches, open vents, half engine power 7.8 Open side hatches, open vents, full engine power 183.3 Open side hatches, open vents, half engine power 179.5 Active ventilation. Closed side hatches, open vents,
full engine power.
16.4
Active ventilation. Closed side hatches, open vents, half engine power.
16.5
6.2 Thermal Insulation Values
The set point temperature of each zone of the thermal manikin was specified at 25ºC. The thermal manikin test was terminated when it reached a steady state, with average surface temperatures of all zones steady within 0.002 ºC of the set point temperature and constant average heat flux with standard deviation of less than 1 W/m2 for 30 consecutive minutes. The zone thermal resistance was computed using Equation 1 and the overall thermal resistance was calculated using the parallel method in Equations 2. In Table 3, the thermal insulation values measured by NEMO thermal manikin inside the 72-person lifeboat are compiled. Hands and feet were covered with neoprene gloves and boots, and were excluded in Equation 2 when computing thermal resistance values. In most cases, the manikin measurements were very repeatable and thermal resistance values decreased with active ventilation and open hatch cases. The most noticeable decreases in thermal resistance were observed when clothing was wet.
Rct = (Tskin - Tamb) / (Q/A)
Equation 1
where
Rct = Zone thermal resistance
Tskin = Zone average temperature
Tamb = Temperature inside lifeboat
Q/A = Area weighted heat flux
Rwtd (parallel) = 1 / Σ (Ai / (Atot * Ri))
Equation 2 where
Rwtd = Thermal resistance calculated using the parallel method
Ri = Zone resistance
Table 3. Clothing thermal insulation values measured by NEMO thermal manikin inside lifeboat
Thermal Resistance [(m2°C)/W]
Passive ventilation, closed hatches, open vents Active low ventilation, closed hatches, open vents Active high ventilation, closed hatches, open vents Passive ventilation, open hatches, open vents
Ventilation rate (litres per second) 2 31 42 95 Clothing Ensembles
Dry reference clothing plus SOLAS life jacket
0.244 0.232
0.233 0.225 0.226
Wet reference clothing plus SOLAS life jacket
0.155 0.140 0.149
Dry reference clothing plus thermal protective aid (TPA) with reflective inner liner and SOLAS life jacket
0.441 0.429 0.389
Wet reference clothing plus thermal protective aid (TPA) with reflective inner liner and SOLAS life jacket
0.293 0.288 0.275
Dry reference clothing plus marine abandonment suit
0.378 0.385 0.371
Wet reference clothing plus marine abandonment suit
0.319 0.310
Dry reference clothing plus parka 0.385 0.381 0.410 Dry reference clothing plus parka
and snow pants
0.525 0.534
Dry reference clothing plus TPA without reflective inner liner
0.345 0.341 0.332
Wet reference clothing plus TPA without reflective inner liner
0.263 0.241 0.256
Wet reference clothing plus wet fleece
0.173
Wet reference clothing plus wet fleece and TPA
7.0 MODELLING
7.1 Heat and Cold Stress in 72-person Lifeboat with no Engine Heat
Using the experimental data collected from the 72-person lifeboat, the manikin and the ambient environment, a simple model of heat loss from the lifeboat was constructed to predict the internal air temperature for any condition of ambient environment, number of occupants, clothing systems and engine heat input. This is just a heat balance where the losses through the hull and by ventilation offset the heat input from the engine, the metabolic heat production of the occupants and change in heat energy of the system.
The areas of the various hull surfaces were calculated from measurements with a tape measure. The corresponding heat transfer coefficients were measured by temperature sensors and heat flow sensors placed on the surfaces when electric heaters with known power output heated the boat.
Under these heated conditions, it was found that the interior cabin temperature was raised 20 to 30 °C above ambient temperature whereas the bilge remained within a few degrees of water temperature. There was a variation of a few degrees from place to place within the cabin. Accordingly, the model was developed to take into account the following:
• Heat loss from the cabin through the deck to the bilge • Heat loss from the cabin to the external air through the hull • Heat loss from the cabin by ventilation
As a first order approximation, the model simply assumed constant cabin temperature throughout and bilge temperature equal to water temperature. Heat losses from the occupants to the cabin and from the cabin to the environment were treated
independently. The largest uncertainties in the model are the heat inputs. It was assumed that each occupant produces about 100W of metabolic heat, which is
dissipated into the cabin either from the skin or by respiration. If the engine is running, there will be additional heat input from convective heat transport from the engine surface through openings in the engine housing to the cabin.
The model simply takes the heat balance equation for the cabin air and solves for the cabin air temperature. The procedure was validated against the experiments with a known quantity of electrical heat input, no occupants and no ventilation. The results were:
• Measured external air temperature 10.3 °C • Measured water temperature 6.0 °C • Measured electrical heat input 2688 W • Measured cabin air temperature 31.2 °C • Predicted cabin air temperature
Hence, the model may be considered accurate to a few degrees if the heat inputs are known. Using the model, predictions can be made of cold or heat stress of lifeboat occupants under different conditions. Cold stress occurs if the heat loss from the body is greater than the heat production. In the model, the lower limit of the thermal neutral condition was taken as a metabolic rate of 100 W and a skin temperature of 30 °C. Heat stress occurs when the heat production is greater than the heat loss. The upper limit of the thermal neutral condition was taken as a metabolic rate of 100 W but a skin
temperature of 35 °C was used, as this is more reasonable for occupants who are sweating. Clothing was assumed wet from sweat in the heat.
Figure 10 shows model prediction for regions of cold or heat stress of occupants, when the lifeboat is half occupied, occupants are wearing dry reference clothing, metabolic rate is assumed to be 100 W and engine off. With a ventilation rate of 27 litres per second (0.75 litres per second per person), occupants wearing dry reference clothing would not experience cold or heat stress between 0 and 10°C. Occupants with wet clothing will begin to experience cold stress below 0°C. Below -10°C, occupants with dry clothing will experience cold stress.
7.2 Heat and Cold Stress in 72-person Lifeboat with Engine Heat
A similar calculation was performed for the case where the engine was running and putting heat into the cabin. As no direct measure of the engine heat input was available for the 72-person lifeboat, an estimate was made using data from the 20-person boat. Again, heat loss from the cabin to the ambient air and to the bilge was estimated from measured areas and heat transfer coefficients. The heat input from the engine was included in the model as an adjustable parameter and its value set to give good
agreement with the observed cabin air temperature. This gave a value of 5.5 kW. From the difference in fuel consumption rates between the engines of the 72- and 20-person boats, it was estimated that the heat input to the cabin would be about 8 kW in the 72-person boat.
Using the 8 kW figure for the engine heat input to the cabin, the same type of
calculation as for the no engine heat case was done to predict regions of cold and heat stress. Figure 11 shows model prediction for regions of cold or heat stress of occupants, when the lifeboat is half occupied, occupants are wearing dry reference clothing,
metabolic rate is assumed to be 100 W and engine running.
As can be seen, if the ventilation rate is low, such as with a safety factor for acceptable air quality of one, cold stress is never a problem but heat stress is an issue at all
ambient temperatures. Ventilation rates of several hundred litres per second are required to avoid heat stress.
Other modeled conditions with the 72-person lifeboat fully occupied and with occupants wearing thermal protective aid are shown in Appendix A.
7.3 The Effect of Ventilation on Occupant Heat Loss
The model was used to assess the effect of ventilation on occupant heat loss. Table 4 shows the effect of ventilation on occupant heat loss in the dry reference clothing plus SOLAS lifejacket case and engine off.
Table 4. Effect of ventilation on occupant heat loss in 72-person lifeboat
Ventilation Rate [litres / s] Input Clothing Insulation [(m2°C)/W ] Number of Occupants Tair
[°C] Twater[°C] Tskin[°C] Tcabin [°C] Heat Flux [W/m2 ] 1 0.244 1 0.7 8.3 30 7.13 93.8 35 0.244 1 0.7 8.3 30 5.64 100.4 95 0.244 1 0.7 8.3 30 4.2 105.7 1 0.244 36 0.7 8.3 30 22.3 31.5 10 0.244 36 0.7 8.3 30 21.7 33.8 100 0.244 36 0.7 8.3 30 17.4 51.7 300 0.244 36 0.7 8.3 30 12.1 73.3 1000 0.244 36 0.7 8.3 30 6.1 97.8 1 0.244 72 0.7 8.3 30 25.4 18.7 10 0.244 72 0.7 8.3 30 25.0 20.0 100 0.244 72 0.7 8.3 30 21.7 33.9 300 0.244 72 0.7 8.3 30 16.9 53.9 1000 0.244 72 0.7 8.3 30 9.6 83.5
It is observed that when the lifeboat is 50% occupied, ventilation rate can be increased to 100 litres per second. Under such condition, the occupant heat flux is 51.7 W/m2 (or 93.06 W for a person with 1.8m2 surface area). This is roughly equivalent to the heat loss (100 W) from a person carrying out 1 MET of physical activity. The corresponding cabin temperature is 17.4°C, creating a comfortable microclimate for the lifeboat occupants. When the lifeboat is fully occupied, the ventilation rate can be increased to 300 litres per second for similar microclimate.
8.0 CONCLUSIONS AND RECOMMENDATIONS
1. With vents open only, the 72-person SOLAS approved lifeboat had a ventilation rate of 2 litres per second. With hatches open, simulating a partially enclosed lifeboat, the ventilation rate was 95 litres per second. If lifeboat occupants have 1 MET or 2 MET physical activity, the minimum ventilation rate needed to keep carbon dioxide
concentration below 5000 ppm is 54 litres per second and 108 litres per second respectively.
2. Using the thermal manikin to measure thermal resistance, a slight decrease in
thermal resistance was observed with passive ventilation and open hatch conditions. The most noticeable decreases in thermal resistance were observed when clothing was wet.
3. Thermal manikins and mathematical models can be used to assess heat and cold stress of lifeboat occupants under different environmental conditions, number of occupants, clothing systems, metabolic rates, ventilation rates, engine heat output etc., as demonstrated in this study.
4. Thermal protection and ventilation rates are related. If the ventilation rate is too high, thermal protection will be reduced. If the ventilation rate is too low, thermal
protection will be increased but occupants may suffer from all the adverse effects of high carbon dioxide concentration. This could adversely affect their ability to carry out survival tasks. This study shows a reasonable compromise.
5. In a lifeboat with the engine running, the occupants are likely to suffer heat stress unless a ventilation rate of several hundred l/s can be achieved.
Recommendations from this study include:
1. Making operators, regulators and training providers aware that lifeboat occupants could suffer from cold or heat stress as well as high concentration of carbon dioxide, depending on environmental conditions, number of occupants, clothing systems, metablolic rates, ventilation rates, engine heat output etc. Precautions should be taken to prevent exposure of lifeboat occupants to these conditions.
2. Conducting further research to determine metabolic rates of lifeboat occupants after realistic ship abandonment and the optimum ventilation rate for short- and long-term survival ranging from 1 to 5 days.
3. Conducting further research to assess the value of active ventilation.
4. Developing thermal protection and ventilation performance criteria and objective test method for approval testing of lifeboats to enhance occupant safety.
9.0 ACKNOWLEDGMENTS
The authors would like to thank Transport Canada for their financial support on this project. We would also like to acknowledge the dedication and effort of Mr. Jim Boone in the planning and execution of this project.
10.0 REFERENCES
American Conference of Governmental Industrial Hygienists, ACGIH (2004) Threshold Limit Values for Chemical Substances and Physical Agents and Biological Exposure Indices.
Brigham, Lawson (2004), “Arctic Marine Transport Workshop”, Held at Scott Polar Research Institute, Cambridge University, UK. Sept 28-30, 2004.
Brigham, Lawson (2007), “Arctic Marine Shipping Assessment (AMSA) Report to Senior Arctic Officials, Tromso, Norway, April 12-13, 2007.
IMO (1983), “Code of practice for the evaluation, testing and acceptance of prototype novel life-saving appliances and arrangements”, International Maritime Organization, General Assembly, 13th session, annex to resolution A.520(13), November 17, 1983.
IMO (2006), “Report to the Maritime Safety Committee”, International Maritime Organization (IMO) Sub-Committee on Radio Communications and Search and Rescue, 10th session, Agenda item 16, March 27, 2006.
Mak, L. et al. (2009), “Experimental Study and Modelling of Thermal Protection in Liferafts Using a Thermal Manikin and Human Subjects”, Proceeding of the ASME 2009 28th International Conference on Ocean, Offshore and Arctic Engineering, May 2009, Honolulu, Hawaii, USA.
NRC Highlights (2007), “Safe Northern Passage”, NRC Highlights, National Research Council Canada, Jan 2007.
Protection of the Arctic Marine Environment (PAME) (2006), “Arctic Marine Shipping Assessment – The Arctic Council’s Response to Changing Marine Access”, Progress Report, October 2006.
The Bureau of Maritime Affairs (2009), “Decision of the Commissioner of Maritime Affairs, R.L. and the Report of Investigation in the Matter of Sinking of Passenger Vessel Explorer (O.N. 8495) 23 November 2007 in the Bransfield Strait near South Shetland Islands”, March 2009, Monrovia, Liberia.
Tikuisis, P (1999), “Considerations for the Measurement and Analysis of Heat Debt for Cold Exposure.
Figure A1. Model prediction of occupant cold or heat stress (coverall, 100% occupancy, engine off)
Figure A3. Model prediction of occupant cold or heat stress (coverall and TPA, 50% occupancy, engine off)
Figure A5. Model prediction of occupant cold or heat stress (coverall and TPA, 100% occupancy, engine off)
![Table 1. Measured ventilation rates for different conditions in litres per second (72-person lifeboat) Condition Target ventilation rate for 30 person experiment [l/s] Hot wire anemometer [l/s] Dilution method [l/s]](https://thumb-eu.123doks.com/thumbv2/123doknet/14142870.470694/18.918.116.745.153.598/measured-ventilation-different-conditions-condition-ventilation-experiment-anemometer.webp)