Publisher’s version / Version de l'éditeur:
Vous avez des questions? Nous pouvons vous aider. Pour communiquer directement avec un auteur, consultez la première page de la revue dans laquelle son article a été publié afin de trouver ses coordonnées. Si vous n’arrivez pas à les repérer, communiquez avec nous à PublicationsArchive-ArchivesPublications@nrc-cnrc.gc.ca.
Questions? Contact the NRC Publications Archive team at
PublicationsArchive-ArchivesPublications@nrc-cnrc.gc.ca. If you wish to email the authors directly, please see the first page of the publication for their contact information.
https://publications-cnrc.canada.ca/fra/droits
L’accès à ce site Web et l’utilisation de son contenu sont assujettis aux conditions présentées dans le site LISEZ CES CONDITIONS ATTENTIVEMENT AVANT D’UTILISER CE SITE WEB.
Laboratory Technical Report (National Research Council of Canada. Flight
Research Laboratory); no. LTR-FRL-2016-0069, 2016-06-30
READ THESE TERMS AND CONDITIONS CAREFULLY BEFORE USING THIS WEBSITE. https://nrc-publications.canada.ca/eng/copyright
NRC Publications Archive Record / Notice des Archives des publications du CNRC :
https://nrc-publications.canada.ca/eng/view/object/?id=346067f6-f07b-40fb-b614-d338ac9f6f48 https://publications-cnrc.canada.ca/fra/voir/objet/?id=346067f6-f07b-40fb-b614-d338ac9f6f48
Archives des publications du CNRC
For the publisher’s version, please access the DOI link below./ Pour consulter la version de l’éditeur, utilisez le lien DOI ci-dessous.
https://doi.org/10.4224/23000466
Access and use of this website and the material on it are subject to the Terms and Conditions set forth at
Effects of vibration level and a vibration mitigating cushion on neck
strain using a human rated shaker facility
Wright Beatty, Heather; Law, Andrew; Thomas, Russell; Yapa, Upekha
Senarath; Prigli, Antal; Ensan, Manouchehr Nejad; Wickramasinghe, Viresh
Aerospace
Effects of Vibration Level and a
Vibration Mitigating Cushion on
Neck Strain using a Human
Rated Shaker Facility
Heather Wright Beatty, Andrew Law, Russell
Thomas, Upekha Senarath Yapa, Antal Prigli,
Manouchehr Nejad Ensan, and Viresh
Wickramasinghe
June 30, 2016
CLASSIFICATION: UNLIMITED i
FLIGHT RESEARCH LABORATORY
Effects of Vibration Level and a Vibration
Mitigating Cushion on Neck Strain using a
Human Rated Shaker Facility
Report No.: LTR-FRL-2016-0069 Date: June 30, 2016
Authors: Heather Wright Beatty, Andrew Law, Russell Thomas, Upekha Senarath Yapa, Antal Prigli, Manouchehr Nejad Ensan, and Viresh Wickramasinghe
Classification : Unclassified Distribution : Unlimited For:
SIGMA ID#:
Submitted by: Stephen Parkinson Director R&D
Approved by: Jerzy Komorowski General Manager
Pages : 66 Copy No : 1
Fig. : 39 Diagrams : 0
This report may not be published wholly or in part without the written consent of the National Research Council of Canada Aerospace Portfolio.
CLASSIFICATION: UNLIMITED ii
Table of Contents
SUMMARY ... 1
INTRODUCTION ... 2
METHODS ... 4
Human Rated Shaker Platform Description ... 4
Experimental Design ... 6
Participants ... 7
Physiological Measures ... 7
Measures and Instrumentation ... 7
EMG Data Processing ... 10
Statistical Analysis ... 12
RESULTS ... 13
Electromyography (EMG) ... 13
Electrocardiography (ECG) and Respiration ... 20
Performance Measures ... 24
Subjective, Somatosensory, and Tactile Spatial Acuity Measures ... 28
Acceleration and Head Position/Rotation ... 29
Correlation of Measures ... 35
DISCUSSION ... 36
CONCLUSIONS... 37
REFERENCES ... 39
APPENDIX A: Individual Electromyography Sites ... 43
APPENDIX B: Electromography and Fatigue ... 44
APPENDIX C: Heart Rate Variability ... 45
APPENDIX D: Heart Rate Variability Percent Change ... 49
APPENDIX E: Psychomotor Vigilance Task ... 53
CLASSIFICATION: UNLIMITED iii
List of Figures
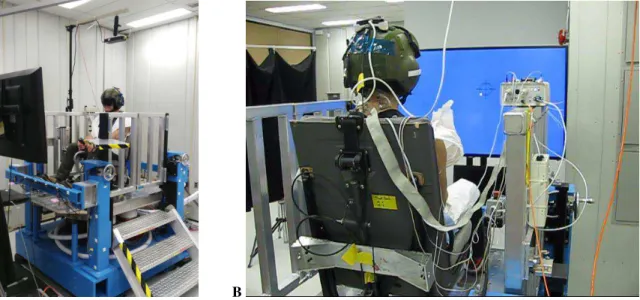
Figure 1: NRC’s Human Rated Shaker Platform ... 4
Figure 2: Aircraft Axes of Vibration – Vertical axis (z, Red, yaw rotations), Fore/Aft axis (x, Green, roll rotations), and Lateral axis (y, White, pitch rotations) ... 5
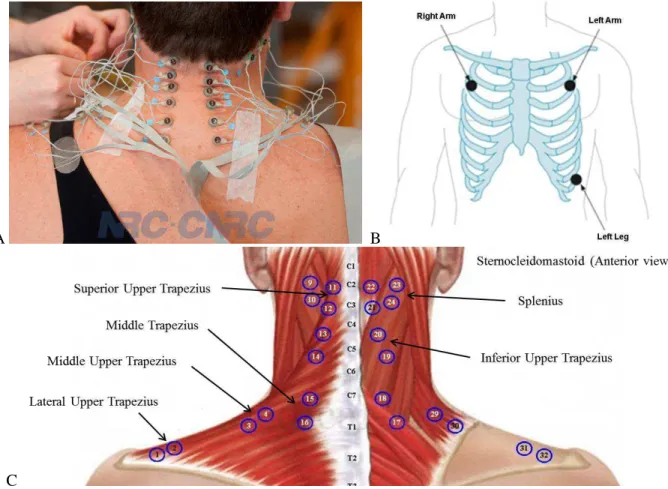
Figure 3: Participant instrumented with electromyography (EMG) electrodes (A), and placement of the 3 Electrocardiography (B) and 32 EMG (C) electrodes ... 8
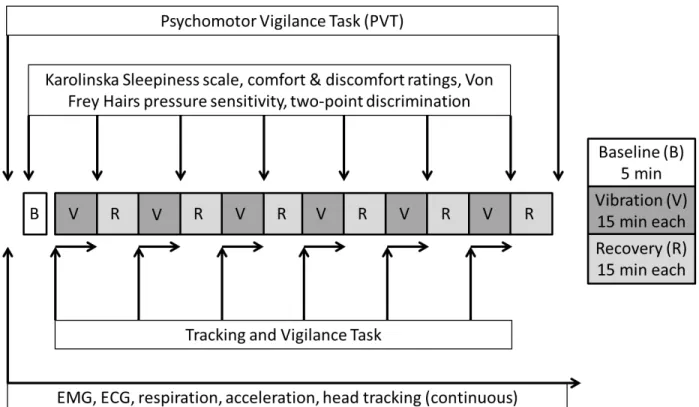
Figure 4: Experimental Design and timeline of measures ... 9
Figure 5: EMG processing example... 11
Figure 6: EMG amplitude of normalized data for vibration level and cushion (A) and trials/epochs (B) .. 13
Figure 7: EMG median frequency of normalized data for vibration level and cushion (A) and trials/epochs (B) ... 15
Figure 8: EMG force indicator of normalized data for vibration level and cushion (A) and trials/epochs (B) ... 17
Figure 9: Delta median frequency versus the delta for amplitude for all EMG ... 19
Figure 10: Absolute Heart Rate for vibration level and cushion (A) and trials (B) ... 20
Figure 11: Percent Change in Heart Rate from rest for vibration level and cushion (A) and trials (B) ... 21
Figure 12: Sample Entropy of Heart Rate Variability for vibration level and cushion (A) and trials (B) .. 22
Figure 13: Respiration rate for vibration level and cushion (A) and trials/epochs (B) ... 23
Figure 14: Psychomotor Vigilance Task mean reaction time (RT) (A), mean reaction time of the first and last 5 minutes of the PRE and POST PVT (B), mean of the slowest 10% of reaction times (C), and mean of the fastest 10% of reaction times (D) ... 24
Figure 15: Cursor-Target Distance in the Tracking and Vigilance Task for vibration level and cushion (A) and trials/epochs (B) ... 25
Figure 16: Response Time in the Tracking and Vigilance Task for vibration level and cushion (A) and trials/epochs (B) ... 26
Figure 17: Errors of No Responses in the Tracking and Vigilance Task for vibration level and cushion (A) and trials/epochs (B) ... 27
Figure 18: Discomfort ratings for vibration level and cushion (A), trials (B), and body location (C) ... 28
Figure 19: Health-weighted head acceleration for vibration level and cushion (A) and trials/epochs (B) . 29 Figure 20: Health-weighted seat acceleration for vibration level and cushion (A) and trials/epochs (B) .. 30
Figure 21: ISO Standard Vibration Exposure Limits for seat pad (left) and head (right) acceleration ... 31
Figure 22: Comfort-weighted head acceleration for vibration level and cushion (A) and trials/epochs (B) ... 32
Figure 23: Comfort-weighted seat acceleration for vibration level and cushion (A) and trials/epochs (B) 33 Figure 24: Shaker platform acceleration for vibration level and cushion (A) and trials/epochs (B) ... 34
Figure 25: Change in median frequency versus change in amplitude of EMG of individual electrode muscle locations (Refer to Tables 2-4 for location acronyms) ... 43
Figure 26: Delta median frequency versus the delta for amplitude for all individual EMG sites... 44
Figure 27: Standard Deviation of Normal RR Intervals (SDNN) of Heart Rate Variability for vibration level and cushion (A) and trials (B) ... 46
Figure 28: Root Mean Square of Successive Differences (RMSSD) of Heart Rate Variability for vibration level and cushion (A) and trials (B) ... 47
Figure 29: Ratio of Low Frequency to High Frequency (LF/HF) components of Heart Rate Variability for vibration level and cushion (A) and trials (B) ... 48
Figure 30: Heart Rate Variability Standard Deviation of NN (normal beats) Intervals (SDNN) as a percent change from resting baseline for vibration level and cushion (A) and trials (B) ... 49
Figure 31: Heart Rate Variability Root Mean Square of the Successive Differences (RMSSD) as a percent change from resting baseline for vibration level and cushion (A) and trials (B) ... 50 Figure 32: Ratio of Low Frequency to High Frequency (LF/HF) components of Heart Rate Variability as
CLASSIFICATION: UNLIMITED iv
a percent change from resting baseline for vibration level and cushion (A) and trials (B) ... 51
Figure 33: Heart Rate Variability Root Sample Entropy as a percent change from resting baseline for vibration level and cushion (A) and trials (B) ... 52
Figure 34: Psychomotor Vigilance Task errors of anticipation (A), false starts (B), and lapses (C) ... 53
Figure 35: Psychomotor Vigilance Task comprehensive analysis ... 54
Figure 36: Karolinska Sleepiness Scale ratings for vibration level and cushion (A) and trials (B) ... 55
Figure 37: Comfort ratings for vibration level and cushion (A), trials (B), and body location (C) ... 56
Figure 38: Two-point discrimination for vibration level and cushion (A), trials (B), and body location (C) ... 57
CLASSIFICATION: UNLIMITED v
List of Tables
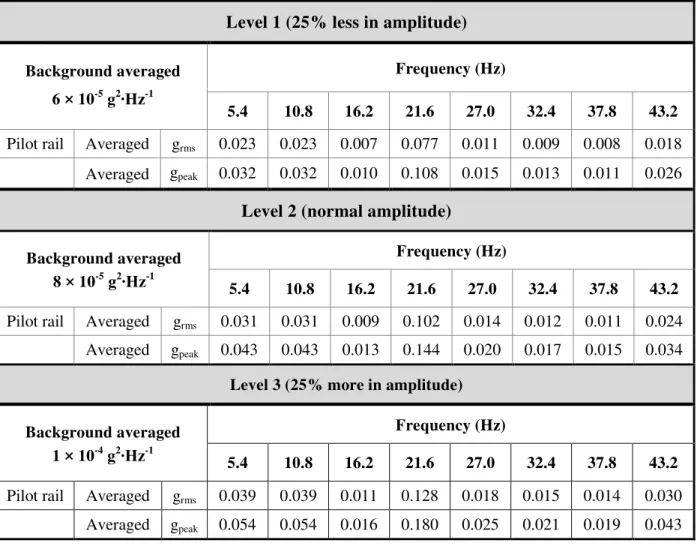
Table 1: Frequency and amplitude specifications of the three vibration levels ... 6 Table 2: EMG amplitude significance levels of individual muscles for vibration level, cushion, trials, and
epochs ... 14 Table 3: EMG median frequency significance levels of individual muscles for vibration level, cushion,
trials, and epochs ... 16 Table 4: EMG force indicator significance levels of individual muscles for vibration level, cushion, trials,
and epochs ... 18 Table 5: Heart Rate Variability for vibration level, cushion, trials, and epochs ... 45
CLASSIFICATION: UNLIMITED vi
List of Abbreviations
Abbreviation
Definition
ANOVA Analysis of Variance
ECG Electrocardiography
EMG Electromyography
GPS Global positioning system
HRS Human rated shaker
HRV Heart rate variability
ICP Integrated circuit piezoelectric
ISO International Organization of Standardization
LF/HF Low Frequency/High Frequency (measure of HRV)
NRC National Research Council Canada
NVG Night vision goggles
OEM Original equipment manufacturer
PSD Power spectral density
PVT Psychomotor vigilance task
RMSSD Root mean square of the successive differences (measure of HRV) SDNN Standard deviation of normal to normal R-R intervals (measure of HRV)
CLASSIFICATION: UNLIMITED 1
SUMMARY
Rotary wing pilot neck pain is increasing in prevalence. This may be due to the combined effects of additional head supported mass (e.g., night vision goggles (NVG), head mounted displays) and whole-body vibration (WBV). Not only is the one per revolution frequency of most helicopters within the range of frequencies where the human spine is most sensitive to injury/damage, but the neck is also constantly stabilizing the head to counter the aircraft vibrations. Previous flight tests indicated that a minimal de-tuning of the track-and-balance of the main rotor of the NRC Bell 412 (increased vibration by ~0.006 g) resulted in a substantial increase in vibration at the pilots head (a ~0.01 g increase). Although such increases in vibration were classified as safe (i.e., unlikely to result in any health issues) according to the ISO 2631-1 standard, physiological measures of the pilot indicated elevated stress (i.e., increased heart rate and heart rate variability ratio) with an increase in helicopter vibration and increased neck muscle fatigue over time. However, the magnitude of these physiological effects and the maximum safe exposure level of vibration remain unclear.
The current study examined the physiological responses of 12 pilots during and after 15-minute exposures to three vibration levels (-25%, normal, and +25% amplitude; Levels 1-3) on a human rated shaker platform which are representative of the NRC Bell 412 and CF Griffon helicopters in forward flight. In addition, this study compared the human physiological response to an Original Equipment Manufacturer cushion (OEM Cushion 1) and a vibration mitigating cushion (Mitigating Cushion 2) at each vibration level using a counter-balanced design across participants. As a measure of neck strain, neck electromyography (EMG) amplitude, force, and median frequency were each significantly influenced by vibration level and cushion type. The EMG amplitude was higher during Level 3 compared to Level 1 for both cushions, and during Level 2 compared to Level 1 for the OEM cushion. During Levels 2 and 3, the EMG amplitudes were lower, and median frequency higher, with the vibration mitigating cushion compared to the OEM cushion. Because muscle fatigue coincides with higher EMG amplitude and lower median frequency, significant differences in EMG amplitude and median frequency across vibration levels and cushions indicate that neck strain was higher with the OEM cushion and/or Level 3 vibration. Accelerations recorded at the seat pad and helmet confirmed that WBV increased significantly with increases in vibration level and low-frequency acceleration of the head was amplified relative to seat vibration. Notably, head acceleration was significantly lower with the vibration mitigation cushion compared to the OEM Cushion 1 during Level 3 vibration, and seat pad acceleration was significantly lower with the vibration mitigating cushion during both Levels 2 and 3 vibration. Despite significant effects of vibration level and cushion type on WBV, head and seat pad accelerations for all six Level/Cushion combinations fell within the same “fairly uncomfortable” range (0.5–1.0 m∙s-2
) of the ISO-2631-1-1997 Standard comfort scale. Overall, heart rate was significantly higher during each of the vibration trials as compared to the initial resting rate. One of the measures of HRV (sample entropy) decreased from Epoch 1 (0-5 minutes) to Epoch 2 (5-10 minutes) during each 15-minute vibration trial and across the 6 vibration trials, indicative of increased sympathetic drive, or stress, with vibration exposures. Psychomotor Vigilance Task (PVT) reaction times showed a reduced ability to maintain vigilance post-experiment (after all vibration trials). Discomfort ratings increased significantly over the duration of the six experimental trials, with significant differences between neck, shoulder, back, buttock, and thigh discomfort.
In conclusion, the changes in absolute EMG amplitude and median frequency measures indicate that increased vibration may be more fatiguing while the vibration mitigating cushion was effective in reducing such effects. While reducing WBV through aircraft tuning and/or vibration mitigating cushions would be expected to significantly reduce neck strain and related disorders, further work is required to evaluate the effects of prolonged vibration exposure, head supported masses, and alternative mitigation solutions.
CLASSIFICATION: UNLIMITED 2
INTRODUCTION
The prevalence of neck strain and discomfort among rotary wing pilots and crew is a significant concern not only for health but also for operational safety and efficiency. One key element which contributes to discomfort is the level of vibration an individual experiences, whether it be in aviation (i.e., rotary wing and jet pilots), land transport (i.e., truck drivers), or construction (i.e., equipment operations) (1-6). While whole-body vibration (WBV) exposure has been reported to have acute adverse health effects, such as headache, fatigue, and unsettled stomach, the long term, or chronic, adverse health effects of repeated and extended exposure to WBV are of greatest concern to both military and civilian rotary wing communities. The development of neck pain due to repeated and/or prolonged strain with WBV is a complex issue involving factors such as neck muscle strength (7), the mass of the helmet, the mass of night vision goggles (NVG) and increased moments of inertia of the neck (8), awkward postures and bending forward, sitting for long periods, and high force demands (9). Within the Canadian Forces, a large majority (i.e., over 80%) of helicopter pilots reported neck pain, and this increases to over 90% of pilots when they have more than 150 hours of NVG experience (10). In addition to the discomfort, distractions during missions, sick leave from work, and other side-effects of neck strain and/or pain, most helicopter pilots experiencing whole-body vibration have a premature onset of some spinal abnormalities (11) and an increased number of cervical spondylarthritic and spondylitic changes, even as compared to jet and transport pilots (12).
Repeated and long-term exposure to WBV is also associated with degeneration of the spine and the onset of lower back pain (13, 14), intervertebral degeneration (14, 15), sciatic pain (16), and flattening of the lumbar lordosis (17). Although back pain has been reported in many occupations, including agriculture, construction, transportation, and aviation, 50-75% (18), 88.1% (19), and 94% (20) of helicopter pilots reporting back pain with variation due to the number of flight hours, NVG and counterweight usage, type of missions. Moreover, the repetitive compressive force from helicopter vibration increases the load placed on the spine (21), further contributing to degenerative changes most common in the lumbar region followed by thoracic and cervical changes (12, 13). A significant proportion (80%) of pilots experiencing lower back pain showed spinal abnormalities (22) and degenerative changes in the spine, particularly those pilots with more than 1500 hours of helicopter flight time (23). Given that lower back pain and neck strain are amongst the most disabling health problems affecting the majority of helicopter pilots, it is concerning that their current seating systems are primarily designed to meet crashworthiness regulations, without accounting for mission duration, ranges in the pilots’ anthropometric measurements, and until recently, whole-body vibration mitigation (24). This is particularly important for helicopter pilots given that the main rotor vibration is within the range is between 4 and 6 Hz (1/rev) which closely matches the resonant frequency of the human spine (25) and has been shown to be the frequency range to which the body is most sensitive to while seated (26).
The development of other chronic adverse health effects has also been reported with repeated WBV exposure. Body systems which have shown degradation with WBV include the nervous system (e.g., cerebral blood supply and diencephalic disturbances, cortical and subcortical structure function impairments, increased corticospinal pathway excitability (27-29) primary above 20 Hz), vestibular system (e.g., inner ear damage, dizziness, nystagmus, decreased vestibular excitability (30-33)), circulatory system (e.g., ischaemic heart disease (34), hypertension (34, 35), increased sensitivity of the peripheral vascular system (36), other vascular impairments (37)), and digestive system (e.g., gastric and duodenal ulcers, gastritis, appendicitis, diverticulitis, colitis (35, 38, 39) primarily below 20 Hz). Although more limited in the literature, disturbances in the metabolic (e.g., increased oxygen consumption/fatigue (40), metabolic stress with WBV and NVGs (41)) and reproductive (e.g., menstrual disorders, pregnancy complications, and organ positioning in females (42), prostate cancer in males (43-45)) systems have also been reported to occur with WBV by the scientific and medical communities. Thus, the extensive and broad nature of the adverse health effects due to prolonged and/or long-term exposure to WBV necessitate the development of mitigating solutions to reduce the transferability of vibration to the human occupant and thereby
CLASSIFICATION: UNLIMITED 3
improve health outcomes and subsequently operational safety and efficiency.
In addition to the adverse health effects, which in turn often have negative implications for performance and the safety of operations, WBV in itself has been shown to cause decrements in performance. Changes in peripheral motor and/or sensory functions, leading to blurred vision (46), and impairments in movements of the extremities and visual acuity (47), have also been associated with WBV. In particular, visual acuity (i.e., discerning small details) decreases with increasing vibration amplitude, especially at frequencies below 5 Hz (46). This is particularly relevant within the rotary wing community given that the main rotor vibration is in the range of 4-6 Hz (1/rev). It is also worth noting that the amplitudes of vibration in the 4-6 Hz range are magnified at the head (1-3, 48), and that the current International Organization for Standardization (ISO) 2631-1 Standard for whole-body vibration does not consider the head (49). Therefore, given that many of the adverse effects to WBV occur at ~5 Hz, there is a substantial need for the amplitude and frequency limits of exposure (ISO 2631-1-1997) to be revised to incorporate the head and not just the trunk, back, and buttock as are currently referenced. Further to the motor and visual changes, decrements in memory scanning tasks (vibration > 16Hz) (50), and simple and complex cognitive tasks (51, 52), along with cognitive fatigue (53) and increased annoyance (54) due to WBV have the potential for serious operational consequences. Vibration mitigating techniques to counter such performance decrements are essential for safety and well-being in aviation.
As a result of the expansive array of adverse effects associated with WBV, there have been numerous research studies and commercial development efforts related to mitigating the human vibration exposure. In a recent study at the National Research Council (NRC), the vibration levels of the Bell 412 helicopter were altered by small changes to the main rotor through a track-and-balance tuning process. Minimal detuning of the main rotor increased the vibration of the helicopter by only 0.006 g, but increased the vibration of the pilot’s head by 0.01 g (55)
. Although this vibration level was considered safe according to ISO 2631-1, the increased vibration increased the pilot’s heart rate and heart rate variability (HRV), and an increase in neck muscle fatigue was observed over time. This study indicated that the current level of specification for civilian and military track-and-balance operations may have adverse effects on the pilot and crew and recommended that tighter rotor track-and-balance tolerances be used. Additional testing revealed that the vibration transmitted through the aircraft floor and seat to the pilot can be reduced with the use of seat cushions containing vibration mitigating properties (56).
In the current study, NRC’s human rated shaker platform replicated the vertical vibration spectrum that would be experienced on the Bell 412 helicopter at different amplitudes. The human physiological and performance responses were compared across three vibration levels with the use of two seat cushions, a standard helicopter cushion and one with vibration mitigating properties.
CLASSIFICATION: UNLIMITED 4
METHODS
Human Rated Shaker Platform Description
NRC's Human Rated Shaker (HRS) Facility (Figure 1) is a unique vibration platform which allows accurate reproduction of vehicular (e.g., aircraft – partial or entire flight) vibration in the vertical (z) direction. The HRS facility can be used in the evaluation of the effects of vibration parameters on human performance, perception, fatigue, seating dynamics, and postural stability. It also allows for the analysis of parameters related to noise, lighting, and seating with regards to occupant comfort, performance, and well-being. The HRS platform uses an electro-dynamic mechanical shaker to replicate the recorded vertical oscillations of helicopter and fixed-wing aircraft vibration. The use of vertical, or z-axis, vibration simplifies the examination of the human occupant’s head movements which are primarily in the fore/aft plane (2, 48) (Figure 2). The HRS mechanical shaker system is capable of reproducing arbitrary time histories with accelerations up to 10 m·s-2, vibration frequencies from 2 to 1000 Hz, and profiles that include sine sweep, random, random-on random, sine dwell, and sine-on-random. The HRS platform dimensions are 1 × 1.8 m, and the platform includes foot positioning blocks, a height adjustable seat, and a safety railing. The platform also provides sufficient space for the installation of various seat types and a variety of display panels and input devices for the evaluation and quantification of the effects of vibration parameters on Human-Systems Integration. Accelerometer and pressure pad placements on the shaker platform and aircraft seat allow for the assessment of compliance with the ISO-2631 Standard (Mechanical Vibration and Shock – Evaluation of human exposure to whole-body vibration).
A B
CLASSIFICATION: UNLIMITED 5
Figure 2: Aircraft Axes of Vibration – Vertical axis (z, Red, yaw rotations), Fore/Aft axis (x, Green, roll rotations), and Lateral axis (y, White, pitch rotations)
The HRS was developed using four electro-dynamic mechanical shakers which vibrate the table. They were secured to trunnions attached to the large support base. The shakers are also securely attached via the armature and a coupler to the underside of a solid aluminum rigid table. There are four load cells attached on the upper side at each corner of the aluminum table, and a spring system attaches the load cells to four vertically adjustable cranking systems. The cranking systems are attached to four fixed columns, which make up part of the large support base and frame of the shaker system. The table is isolated from the support frame through the spring system, a linear bearing, and the gaps between the armature and electromagnetic stator coil of the four shakers. When not in test mode, and during set up, the weight of the table, seat, and human participant are supported by four jack screws attached to the large support base. Just before starting a test, the four jack screws are disengaged, such that the static weight is now supported by the four spring systems in each corner and minimally by the four shakers. The static load of the table and human participant can be off-loaded from the four shakers via the four vertically adjustable cranking systems. Balancing of the table is achieved by ensuring the pre-calculated weight of the table and participant are distributed equally at each corner of the table. This is verified by reading the same value, in pounds, on the calibrated displays; one connected to each of the four corner load cells. The linear bearing is attached to the large support base and to the center underside of the aluminum table. This helps achieve synchronization amongst the four shakers, and to ensure the direction of travel is in the z orthogonal axis only, while reducing any x and y components of travel to negligible levels. This process also helps to ensure there are no overturning moments on any of the four shakers.
Each shaker is wired and controlled by its own power amplifier, with the four power amplifiers being situated on a rack with a power management panel and power transformer. Each shaker is cooled by its own blower and each blower’s air flow is monitored by circuitry on its associated power amplifiers. If no flow is detected, the amplifier shuts down so as to not burn the coil on the shaker. Additional circuitry has been implemented so that if one blower or shaker fails then all shakers will shut down to protect all shakers. All blowers are situated outside in a utility shed to reduce noise and heat in the test area. The power control unit houses the stop/start circuitry, fuses, transfer switches, power transformer, and outlet power. The four shakers are controlled by a vibration control computer and software that interfaces to the power amplifiers, and subsequently to the shakers. Feedback of the table vibration is supplied by four control accelerometers which maintain closed loop control of the shaker during experimental tests.
CLASSIFICATION: UNLIMITED 6
Various test profiles can be programmed into the vibration software for any acceptable time duration or safe output level in grms. There are multiple software and hardware safety interlocks to ensure the safe
operation of the HRS. To ensure the safety of the human participants, an emergency stop button is situated near the participants’ hand so that the participant can stop the shaker at any time.
Experimental Design
Six experimental trials were evaluated which consisted of a combination of two seat cushions and three vibration levels. The two cushions evaluated were the Original Equipment Manufacturer (OEM Cushion 1), standard helicopter, seat cushion and a modified seat cushion containing a vibration mitigating pad (Mitigating Cushion 2). Low (25% less amplitude – Level 1, 0.23 grms), normal (normal amplitude –
Level 2, 0.30 grms), and high (25% higher amplitude – Level 3, 0.36 grms) vibration levels were paired with
each cushion for a total of six experimental trials on one experimental day (Table 1). The Level 2 vibration spectrum corresponds to vibration measurements taken on the floor of NRC’s Bell 412 during flight at 120 knots. Each participant completed a 5 minute resting baseline (no vibration) prior to the 6 × 15-minute experimental trials, each being separated by a 15 minute recovery (no vibration) period (Figure 4). The order of the 6 experimental trials was counterbalanced among the 12 participants.
Level 1 (25% less in amplitude)
Background averaged 6 × 10⁻⁵ g2∙Hz-1
Frequency (Hz)
5.4 10.8 16.2 21.6 27.0 32.4 37.8 43.2
Pilot rail Averaged grms 0.023 0.023 0.007 0.077 0.011 0.009 0.008 0.018
Averaged gpeak 0.032 0.032 0.010 0.108 0.015 0.013 0.011 0.026
Level 2 (normal amplitude)
Background averaged 8 × 10⁻⁵ g2∙Hz-1
Frequency (Hz)
5.4 10.8 16.2 21.6 27.0 32.4 37.8 43.2
Pilot rail Averaged grms 0.031 0.031 0.009 0.102 0.014 0.012 0.011 0.024
Averaged gpeak 0.043 0.043 0.013 0.144 0.020 0.017 0.015 0.034
Level 3 (25% more in amplitude)
Background averaged 1 × 10⁻⁴ g2∙Hz-1
Frequency (Hz)
5.4 10.8 16.2 21.6 27.0 32.4 37.8 43.2
Pilot rail Averaged grms 0.039 0.039 0.011 0.128 0.018 0.015 0.014 0.030
Averaged gpeak 0.054 0.054 0.016 0.180 0.025 0.021 0.019 0.043
CLASSIFICATION: UNLIMITED 7
Participants
Upon receiving approval from the NRCs Research Ethics Board, 12 pilots were recruited to participate. All participants were informed of all the experimental procedures, associated risks, and discomforts prior to providing written informed consent. Participants completed a health questionnaire and had their heart rate and blood pressure taken as part of the screening procedures to confirm eligibility and to ensure their safety during participation. The participants (n = 12) were healthy (free from medical conditions which could potentially be exacerbated by whole-body vibration) males ranging in age from 20-59 years of age (n = 9 within 45-59 years of age) with 7 of 12 having 20+ years of flight experience (n = 1 with 10-15 years, n = 2 with 5-10 years, and n = 2 with 0-5 years).
Physiological Measures
Measures and Instrumentation
Prior to arriving at the laboratory for the experimental session, each participant was instructed to eat a normal breakfast, and refrain from alcohol and vibration exposure for 12 and 24 hours, respectively. After screening and informed consent, participants were fitted with the electromyography (EMG) and electrocardiography (ECG) electrodes and respiration belt. Following instrumentation, participants donned shoes/light boots and a medical gown over their pants prior to being seated on the aircrew seat of the human rated shaker platform. Participants then donned a pre-fitted SPH5 (~4 lb) rotary wing helmet. Foot pedals were adjusted as per the participants’ height and the instrumentation was connected to the BioSemi system as outlined below.
A continuous integrated recording of EMG, ECG, respiration, head position/rotation, and acceleration (floor, seat, cushion, back, and the pilot’s head) was collected using an adapted version of the ActiView LabVIEWTM (BioSemi, Amsterdam, Netherlands) software. Global positional system (GPS) time was also integrated within the recording software. EMG was measured as an indication of muscle activity and neck strain, and heart rate, HRV (via ECG) and respiration were measured as indicators of stress and arousal. The BioSemi ActiveTwo system (DA-AT-MSADB, BioSemi, Amsterdam, Netherlands) sampled EMG and ECG (heart rate, R-R interval, respiration rate) data at 2048 Hz. An array of thirty-two surface EMG electrodes was used to record muscle activity at the locations shown in Figures 3A and C. Three ECG electrodes (ActiveTwo flat-type active electrodes, BioSemi, Amsterdam, Netherlands) were placed at the left arm, right arm, and left leg locations as per 3-electrode ECG configuration (Figure 3B). All electrodes were affixed to the skin using disposable adhesive disks and SignaGel® electrolyte. Through the same adapted ActiView LabVIEW software as the above physiological measures described, continuous acceleration and head tracking data were also collected. Miniature Integrated Circuit Piezoelectric (ICP) type accelerometers (ICP Accelerometer 352C22 and ICP Triaxial Accelerometer 356B41, PCB Piezotronics, Depew, NY, USA) were placed on the top of the helmet (triaxial, vibration at the head), on the back rest (triaxial), within a pad on the seat cushion (triaxial, vibration transmitted to the pilot), on the underside of the seat (triaxial), and on the surface of the shaker platform (unidirectional, vertical-axis, simulated vibration of the aircraft). Accelerometer data was recorded by the mechanical shaker control software (SignalStar Matrix Vibration Controller 2.5.1042, Data Physics Corporation, San Jose, CA, USA) with a sampling rate of 128 Hz. The LaserBird 2 optical tracker was used to capture 6D head positioning (forwards, starboard, down, yaw, pitch, and roll), where data was recorded to the BioSemi data acquisition system at a sampling rate of 240 Hz.
CLASSIFICATION: UNLIMITED 8
A B
C
Figure 3: Participant instrumented with electromyography (EMG) electrodes (A), and placement of the 3 Electrocardiography (B) and 32 EMG (C) electrodes
Two measures of performance were collected pre and post the experimental trials as well as during the vibration exposure. Participants completed a 10-minute Psychomotor Vigilance Task (PVT; PVT-192 RT Task Monitor, Ambulatory Monitoring Inc., Ardmore, PA, USA) at resting baseline, prior to the first vibration exposure, and immediately following the end of the sixth vibration exposure trial. The PVT is a sustained attention, visual reaction time task which is sensitive to changes in alertness and provides measures including reaction time, frequency of responses, lapses, and false starts. In the second performance task, participants performed a tracking and vigilance task for the entire 15-minute duration of each of the six vibration exposure trials. This task consisted of a primary target pursuit task (pursuit task with 2D joystick) and secondary peripheral stimuli response task (eight secondary stimuli flashed pseudo-randomly at 5-15 second intervals). For the primary and secondary tasks, the target and tracker positions, and target-stimuli distance and stimuli reaction times, respectively were recorded.
Subjective ratings of alertness and comfort/discomfort were collected using the Karolinska Sleepiness Scale and Localized Comfort/Discomfort Scales, respectively. These rating questionnaires were administered at resting baseline, prior to the first vibration exposure, and immediately following each of the six vibration exposure trials. The Comfort and Discomfort Scales obtained a rating on a 12-point scale of 0 (No comfort and No discomfort, respectively) to +10 (Extremely strong comfort and Extremely strong discomfort, respectively) at 9 locations, including the shoulder, upper back, buttock, and thigh for left and right sides, and the neck.
CLASSIFICATION: UNLIMITED 9
As a measure of somatosensory changes and tactile spatial acuity (touch sensitivity), a two-point discrimination test was performed on participants at resting baseline, prior to the first vibration exposure, and immediately following each of the six vibration exposure trials. The validity of the two-point threshold as a spatial acuity measure rests on the assumption that two points can be distinguished from each other only when the two points are sufficiently separated to evoke spatially distinguishable foci of neural activity (57). A 6” lead-free digital caliper was used to measure two-point discrimination (Digi-key Part number 3C30) using a staircase method (58). As a measure of pressure sensitivity, a Von Frey Hairs test (Touch Test Sensory Evaluator, NC12775, North Coast Medical, Inc., Gilroy, CA, USA)(59) was performed on participants at resting baseline, prior to the first vibration exposure, and immediately following each of the six vibration exposure trials. Both the two-point discrimination and Von Frey Hairs tests were completed on the little finger, thumb, and shoulder on both the left and right sides of the body.
CLASSIFICATION: UNLIMITED 10
EMG Data Processing
Electromyography (EMG) is the recorded summation of motor unit action potentials that produce muscle contraction. EMG amplitude and frequency characteristics depend on several factors, including muscle fiber diameter and conduction velocity, motor unit discharge rate and synchronization, the distance between muscle fibers and the recording electrode(s), and the low-pass filtering properties of intermediary tissue (60). EMG amplitude and frequency measures are often used to study muscle force and/or fatigue in response to environmental or experimental conditions. In particular, muscle fatigue generally coincides with higher EMG amplitudes and lower median frequencies, whereas changes in muscle force or recovery from muscle fatigue correlate with lower EMG amplitudes and/or higher median frequencies (61).
For this study, surface neck EMG recordings were processed as follows (Figure 5): 1) Subtracted the mean bias from EMG recordings
2) Filtered individual EMG recordings (10 Hz high-pass, zero phase, 4th order Butterworth) to remove low-frequency noise caused by electrode impedance changes and/or motion artifacts 3) Computed the differential EMG signal for each pair of bipolar electrodes
4) Computed time-resolved power spectral density (PSD) for each differential EMG signal in 250 ms windows, with 200 ms overlap
5) Compiled the time-resolved PSDs across 5 minute epochs with each 15 minute vibration trial to compute the median PSD for each trial epoch
EMG amplitude and median frequency measures are generally derived from signals between 30 and 500 Hz to avoid contamination with ECG signals or other noise artifacts below 30 Hz.(62). Moreover, muscle force has been found to be more highly correlated with EMG amplitudes above 400 Hz (63). Therefore, to evaluate neck muscle response to vibration exposure, three measures were derived from the median PSD for each trial epoch as follows:
1) EMG amplitude: The EMG root-mean-square amplitude was computed from the median power spectral density between 30 and 500 Hz. EMG amplitude in this broad frequency range is proportional to overall muscle activation, and depends on the number and type of recruited muscle fibers contributing to muscle contraction.
2) EMG median frequency: The EMG median frequency was computed from the median power spectral density between 30 and 500 Hz. EMG median frequency depends on the shaper of motor unit action potentials, motor unit discharge rates, and relative changes in muscle fiber conduction velocity.
3) EMG force indicator: The EMG root-mean-square amplitude was computed from the median power spectral density between 400 and 500 Hz. EMG amplitude in this broad frequency range is correlated with muscle force.
CLASSIFICATION: UNLIMITED 11
Figure 5: EMG processing example
First row: Mean-corrected bipolar electrode recordings of left lateral upper fibers trapezius (LLatUFT) during a 15 minute vibration trial (Level 3, OEM Cushion 1, Trial 3)
Second row: Differential EMG signal after high pass filtering (HPF: 10 Hz cut-off, 4th order Butterworth, zero-phase)
Third row: Time-resolved power spectral density of the differential EMG signal, with 250 ms window size (200 ms overlap). The 15 minute recording is segmented into three 5-minute epochs.
Fourth row: Probability distributions of power spectral density for Epoch 1 (left), Epoch 2 (center), and Epoch 3 (right). Solid black line marks the median PSD for each epoch. Vertical dashed lines mark 30 Hz and 500 Hz. Vertical dotted lines mark 400 Hz.
CLASSIFICATION: UNLIMITED 12
Statistical Analysis
A two-way analysis of variance (ANOVA) with repeated measures of Vibration Level (Level 1, Level 2, Level 3) and Cushion (OEM Cushion 1, Mitigating Cushion 2) was performed on electromyography (EMG; amplitude, force indicator, median frequency), heart rate and percent change of heart rate, HRV measures, respiration rate, the tracking and vigilance task (target distance, response time, number of no responses), and seat and head vibration amplitude. A second two-way ANOVA was then performed on the 6 trials to detect effects of trial (time-in-session) and epoch (time-in-trial). For measures which evaluated multiple body locations, a three-way ANOVA with 1 between grouping factor of location (comfort/discomfort = 9, 2-pt/Von Frey Hairs = 6) and 2 repeated factors for Vibration Level (Levels 1, 2, and 3) and Cushion (OEM Cushion 1, Mitigating Cushion 2) was performed. In addition, for all the above measures (i.e., EMG, heart rate, HRV, respiration rate, tracking and vigilance task, seat and head vibration), a two-way ANOVA of trial (Trials 1-6) x location (comfort/discomfort = 9, 2-pt/Von Frey Hairs = 6) was also performed. When a significant F-ratio was obtained, a Tukey’s honest significant difference post-hoc procedure was used to isolate differences. Paired t-tests were performed to compare the PRE and POST PVT reaction time, reciprocal reaction time, and errors (false starts, anticipation, lapses). Spearman’s rank correlation coefficient was computed between the physiological and performance measures (i.e., EMG, heart rate, heart rate variability, respiration rate, and tracking task) and subjective measures (i.e., comfort and discomfort ratings, Karolinska sleepiness scale). In all cases, significance was reported when p ≤ 0.05.
CLASSIFICATION: UNLIMITED 13
RESULTS
Electromyography (EMG)
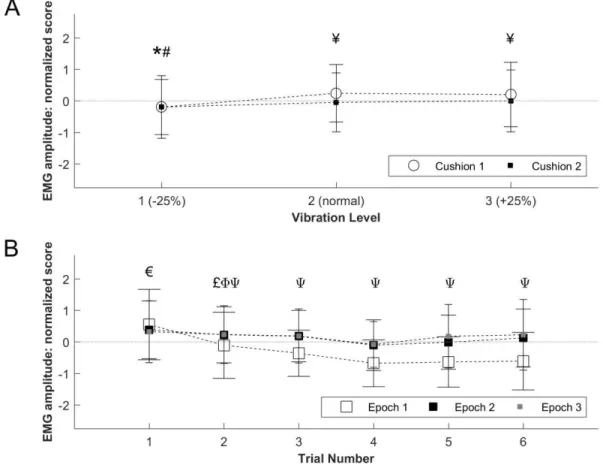
A significant Vibration Level × Cushion interaction was detected for the EMG amplitude, after normalization to remove inter-subject differences, in addition to significant main effects of Vibration Level and Cushion. For both seat cushions, the EMG amplitude was significantly lower (i.e., less motor unit activity) during Vibration Level 1 compared to Vibration Level 3 (with both cushions) and compared to Vibration Level 2 with OEM Cushion 1 (Figure 6A). For Vibration Levels 2 and 3, the EMG amplitude was significantly greater with OEM Cushion 1 as compared to Mitigating Cushion 2 (Figure 6A). A significant interaction effect of Trial × Epoch was detected for EMG amplitude, in addition to main effects of Trial and Epoch within trials. The EMG amplitude in Epoch 1 (0-5 minutes) of Trial 1 was significantly higher than Epochs 1, 2 (5-10 minutes), and 3 (10-15 minutes) for Trials 2-6 (Figure 6B). The EMG amplitude in Epoch 1 of Trial 2, and Epoch 2 of Trial 2, was significantly higher than the same Epochs for Trials 4-6 and Trials 4-5, respectively. For Trials 2-6, the EMG amplitude in Epoch 1 was significantly lower than for Epochs 2 and 3. Significance levels of the individual EMG muscle sites for amplitude of the normalized data are shown in Table 2.
Figure 6: EMG amplitude of normalized data for vibration level and cushion (A) and trials/epochs (B) Mean ± SD. * Significantly different than Level 3 (both cushions), # Cushions 1 and 2 significantly different
than Level 2 with OEM Cushion 1, ¥ OEM Cushion 1 significantly different than Mitigating Cushion 2, € Epoch 1 significantly different than Epochs 1-3 for Trials 2-6, £ Epoch 1 significantly different than Epoch 1 for Trials 4-6, Φ Epoch 2 significantly different than Epoch 2 for Trials 4-5, Ψ Epoch 1 significantly different
CLASSIFICATION: UNLIMITED 14
EMG site
Vibration Level
(main effects)
Cushion
(main effects)
Level x Cushion
(interaction)
Trial
(main effects)
Epoch
(main effects)
Trial x Epoch
(interaction)
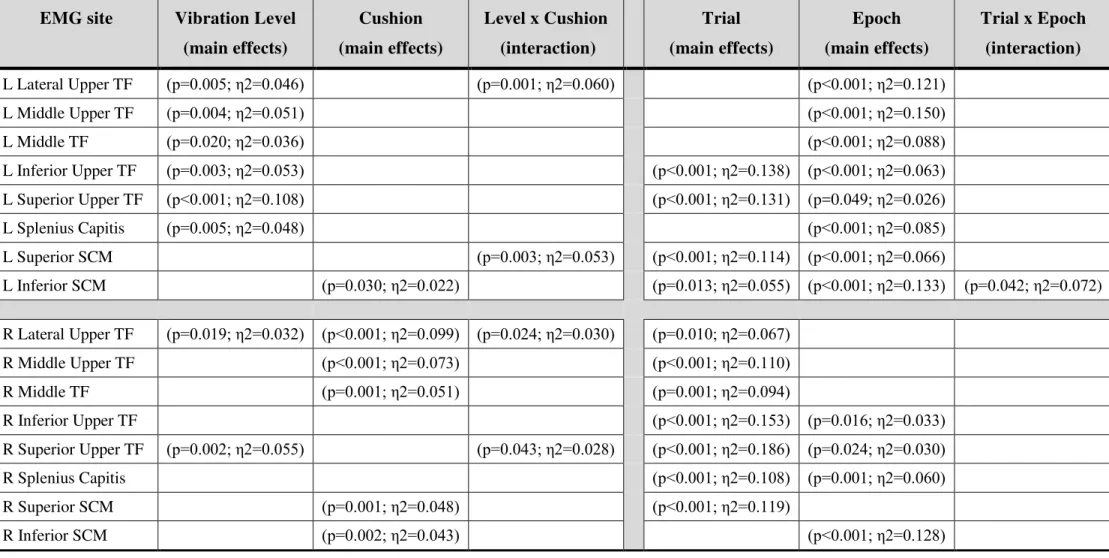
L Lateral Upper TF (p=0.005; η2=0.046) (p=0.001; η2=0.060) (p<0.001; η2=0.121) L Middle Upper TF (p=0.004; η2=0.051) (p<0.001; η2=0.150) L Middle TF (p=0.020; η2=0.036) (p<0.001; η2=0.088) L Inferior Upper TF (p=0.003; η2=0.053) (p<0.001; η2=0.138) (p<0.001; η2=0.063) L Superior Upper TF (p<0.001; η2=0.108) (p<0.001; η2=0.131) (p=0.049; η2=0.026) L Splenius Capitis (p=0.005; η2=0.048) (p<0.001; η2=0.085) L Superior SCM (p=0.003; η2=0.053) (p<0.001; η2=0.114) (p<0.001; η2=0.066) L Inferior SCM (p=0.030; η2=0.022) (p=0.013; η2=0.055) (p<0.001; η2=0.133) (p=0.042; η2=0.072) R Lateral Upper TF (p=0.019; η2=0.032) (p<0.001; η2=0.099) (p=0.024; η2=0.030) (p=0.010; η2=0.067) R Middle Upper TF (p<0.001; η2=0.073) (p<0.001; η2=0.110) R Middle TF (p=0.001; η2=0.051) (p=0.001; η2=0.094) R Inferior Upper TF (p<0.001; η2=0.153) (p=0.016; η2=0.033) R Superior Upper TF (p=0.002; η2=0.055) (p=0.043; η2=0.028) (p<0.001; η2=0.186) (p=0.024; η2=0.030) R Splenius Capitis (p<0.001; η2=0.108) (p=0.001; η2=0.060) R Superior SCM (p=0.001; η2=0.048) (p<0.001; η2=0.119) R Inferior SCM (p=0.002; η2=0.043) (p<0.001; η2=0.128)Table 2: EMG amplitude significance levels of individual muscles for vibration level, cushion, trials, and epochs
L = Left, R = Right, TF = Trapezius Fibres, SCM = Sternocleidomastoid. Blank cells are not significant (p > 0.05). ƞ2 represents a measure of the proportion of variance accounted for by the factor being manipulated (e.g., ƞ2=0.099 represents ~9.9%)
CLASSIFICATION: UNLIMITED 15
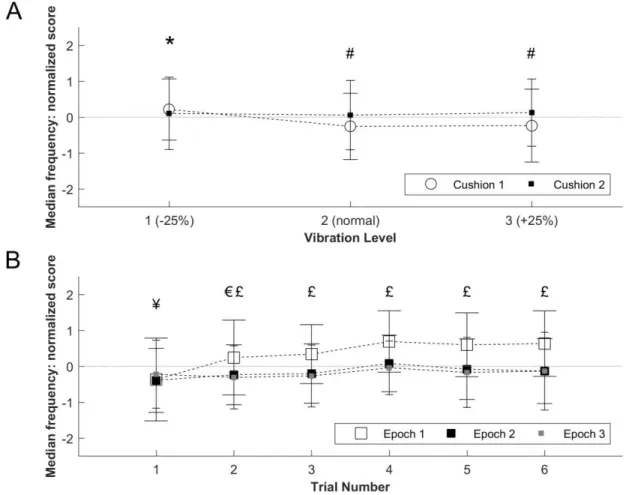
EMG median frequency, as an indicator of muscle fatigue, showed a Vibration Level × Cushion interaction as well as main effects of Vibration Level and Cushion. The EMG median frequency for Cushions 1 and 2 during Vibration Level 1 were significantly higher than for OEM Cushion 1 during Vibration Levels 2 and 3 (Figure 7A). Furthermore, during Vibration Level 2 and 3, EMG median frequency was significantly lower with OEM Cushion 1 than with Mitigating Cushion 2. A significant Trial × Epoch interaction, and main effects of Trial and Epoch, were also detected. EMG frequency was significantly lower during Trial 1 compared to Trials 2-6, and Trial 2 compared to Trials 4-6, for Epoch 1, and was significantly higher during Epoch 1 compared to Epochs 2-3 for Trials 2-6 (Figure 7B). Significance levels of the individual EMG muscle sites for median frequency of the normalized data are shown in Table 3.
Figure 7: EMG median frequency of normalized data for vibration level and cushion (A) and trials/epochs (B) Mean ± SD. * Cushions 1 and 2 significantly different than OEM Cushion 1 during Levels 2 and 3, # OEM
Cushion 1 significantly different than Mitigating Cushion 2, ¥ Significantly different than Trials 2-6 for Epoch 1, € Epoch 2 significantly different than Epoch 1 for Trials 4-6, £ Epoch 1 significantly different than
CLASSIFICATION: UNLIMITED 16
EMG site
Vibration Level
(main effects)
Cushion
(main effects)
Level x Cushion
(interaction)
Trial
(main effects)
Epoch
(main effects)
Trial x Epoch
(interaction)
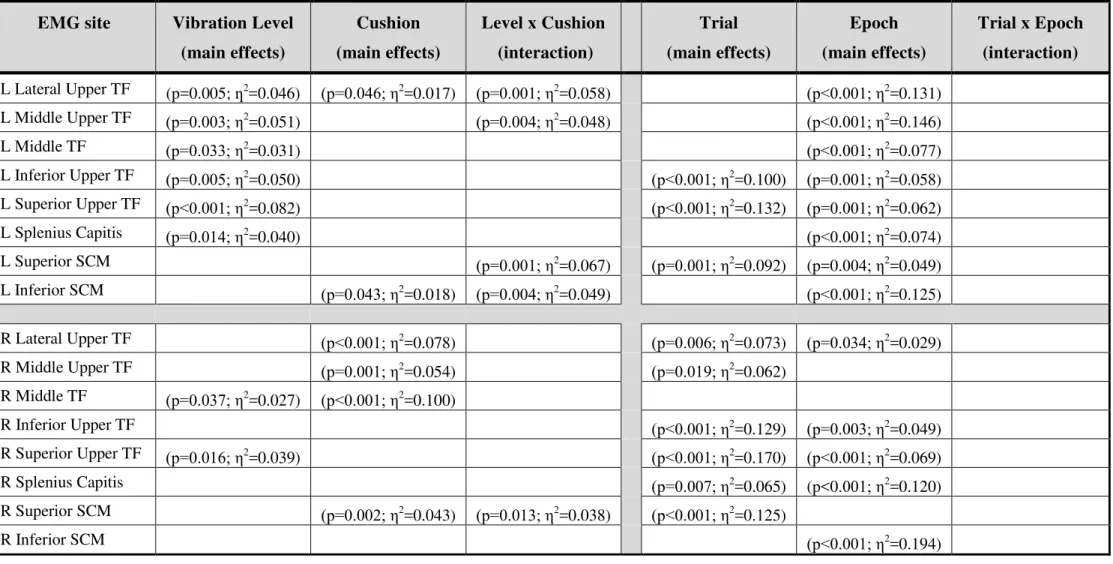
L Lateral Upper TF (p=0.005; ƞ2 =0.046) (p=0.046; η2=0.017) (p=0.001; η2=0.058) (p<0.001; η2=0.131) L Middle Upper TF (p=0.003; η2 =0.051) (p=0.004; η2=0.048) (p<0.001; η2=0.146) L Middle TF (p=0.033; η2 =0.031) (p<0.001; η2=0.077) L Inferior Upper TF (p=0.005; η2 =0.050) (p<0.001; η2=0.100) (p=0.001; η2=0.058) L Superior Upper TF (p<0.001; η2 =0.082) (p<0.001; η2=0.132) (p=0.001; η2=0.062) L Splenius Capitis (p=0.014; η2 =0.040) (p<0.001; η2=0.074) L Superior SCM (p=0.001; η2 =0.067) (p=0.001; η2=0.092) (p=0.004; η2=0.049) L Inferior SCM (p=0.043; η2 =0.018) (p=0.004; η2=0.049) (p<0.001; η2=0.125) R Lateral Upper TF (p<0.001; η2 =0.078) (p=0.006; η2=0.073) (p=0.034; η2=0.029) R Middle Upper TF (p=0.001; η2 =0.054) (p=0.019; η2=0.062) R Middle TF (p=0.037; η2 =0.027) (p<0.001; η2=0.100) R Inferior Upper TF (p<0.001; η2 =0.129) (p=0.003; η2=0.049) R Superior Upper TF (p=0.016; η2 =0.039) (p<0.001; η2=0.170) (p<0.001; η2=0.069) R Splenius Capitis (p=0.007; η2 =0.065) (p<0.001; η2=0.120) R Superior SCM (p=0.002; η2 =0.043) (p=0.013; η2=0.038) (p<0.001; η2=0.125) R Inferior SCM (p<0.001; η2 =0.194)Table 3: EMG median frequency significance levels of individual muscles for vibration level, cushion, trials, and epochs
L = Left, R = Right, TF = Trapezius Fibres, SCM = Sternocleidomastoid. Blank cells are not significant (p > 0.05). ƞ2 represents a measure of the proportion of variance accounted for by the factor being manipulated (e.g., ƞ2=0.099 represents ~9.9%)
CLASSIFICATION: UNLIMITED 17
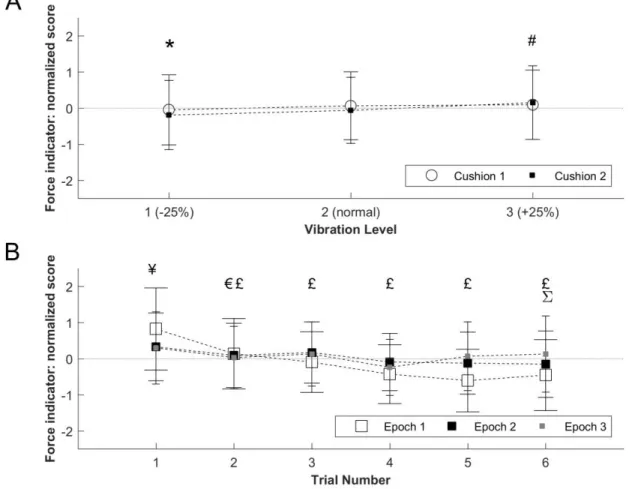
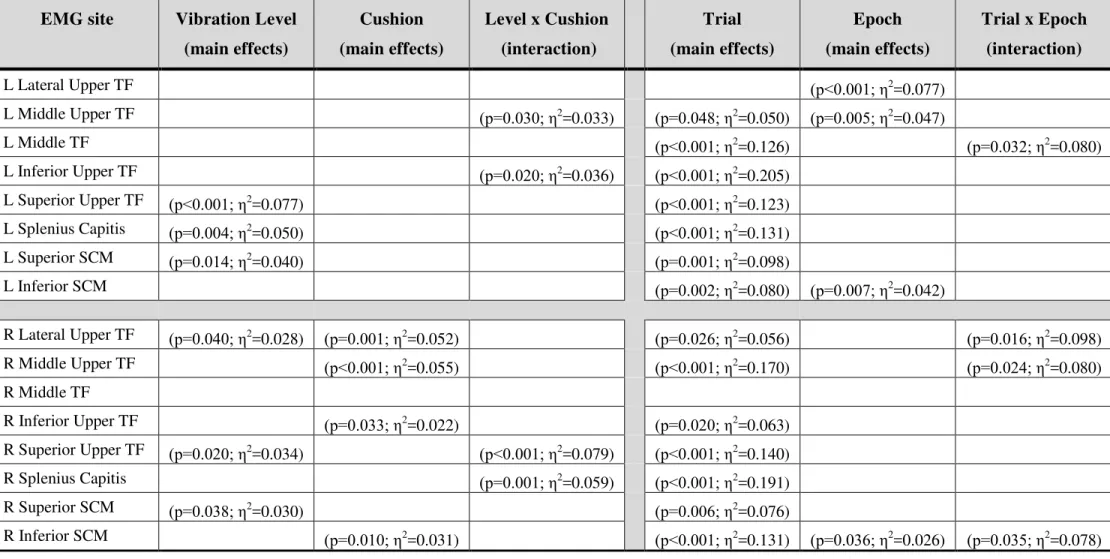
A significant Vibration Level × Cushion interaction was detected for the EMG force indicator (i.e., EMG amplitude between 400-500 Hz) of the normalized data, in addition to significant main effects of Vibration Level and Cushion. EMG force was significantly lower with Mitigating Cushion 2 during Level 1 compared to OEM Cushion 1 during Levels 2-3 (Figure 8A). In addition, the EMG force was significantly higher with Mitigating Cushion 2 during Level 3 compared to Mitigating Cushion 2 during Levels 1-2 and OEM Cushion 1 during Level 1. A Trial × Epoch interaction, and main effects of Trial and Epoch within trials, were also detected. For EMG force, significant differences include the fact that Epoch 1 was greater than Epochs 2-3 during Trial 1, Epochs 2-3 were greater than Epoch 1 during Trial 5, Trial 2 was higher than Trials 4-6 for Epoch 2, and Trial 1 and Trials 2-3 were higher than Trials 2-6 and Trials 4-6, respectively, for Epoch 1 (Figure 8B). In addition, the EMG force was significantly higher for Epoch 2 during Trial 4 and Epoch 3 during Trial 6 as compared to Epoch 1. Significance levels of the individual EMG muscle sites for force indicator of the normalized data are shown in Table 4.
Figure 8: EMG force indicator of normalized data for vibration level and cushion (A) and trials/epochs (B) Mean ± SD. * Mitigating Cushion 2 significantly different than OEM Cushion 1 during Levels 2-3, # Mitigating Cushion 2 significantly different than Mitigating Cushion 2 during Levels 1-2 and OEM Cushion 1
during Level 1, ¥ Epoch 1 significantly different than Epochs 2-3, € Significantly different than Trials 2-6 for Epoch 1, £ Significantly different than Trials 4-6 for Epoch 1, Φ Significantly different than Trials 4-6 for
CLASSIFICATION: UNLIMITED 18
EMG site
Vibration Level
(main effects)
Cushion
(main effects)
Level x Cushion
(interaction)
Trial
(main effects)
Epoch
(main effects)
Trial x Epoch
(interaction)
L Lateral Upper TF (p<0.001; η2 =0.077) L Middle Upper TF (p=0.030; η2 =0.033) (p=0.048; η2=0.050) (p=0.005; η2=0.047) L Middle TF (p<0.001; η2 =0.126) (p=0.032; η2=0.080) L Inferior Upper TF (p=0.020; η2 =0.036) (p<0.001; η2=0.205) L Superior Upper TF (p<0.001; η2 =0.077) (p<0.001; η2=0.123) L Splenius Capitis (p=0.004; η2 =0.050) (p<0.001; η2=0.131) L Superior SCM (p=0.014; η2 =0.040) (p=0.001; η2=0.098) L Inferior SCM (p=0.002; η2 =0.080) (p=0.007; η2=0.042) R Lateral Upper TF (p=0.040; η2 =0.028) (p=0.001; η2=0.052) (p=0.026; η2=0.056) (p=0.016; η2=0.098) R Middle Upper TF (p<0.001; η2 =0.055) (p<0.001; η2=0.170) (p=0.024; η2=0.080) R Middle TF R Inferior Upper TF (p=0.033; η2 =0.022) (p=0.020; η2=0.063) R Superior Upper TF (p=0.020; η2 =0.034) (p<0.001; η2=0.079) (p<0.001; η2=0.140) R Splenius Capitis (p=0.001; η2 =0.059) (p<0.001; η2=0.191) R Superior SCM (p=0.038; η2 =0.030) (p=0.006; η2=0.076) R Inferior SCM (p=0.010; η2 =0.031) (p<0.001; η2=0.131) (p=0.036; η2=0.026) (p=0.035; η2=0.078)Table 4: EMG force indicator significance levels of individual muscles for vibration level, cushion, trials, and epochs
L = Left, R = Right, TF = Trapezius Fibres, SCM = Sternocleidomastoid. Blank cells are not significant (p > 0.05). ƞ2 represents a measure of the proportion of variance accounted for by the factor being manipulated (e.g., ƞ2=0.099 represents ~9.9%)
CLASSIFICATION: UNLIMITED 19
To evaluate if EMG recordings showed evidence of muscle fatigue (i.e., increased amplitude and decrease in median frequency) within 15-minute vibration exposures, the difference between EMG amplitude and median frequency was computed from Epoch 3 to Epoch 1 (delta, Δ). The intersection between the delta median frequency and the delta amplitude is shown in Figure 9 for all EMG, in APPENDIX A for individual EMG sites, and in APPENDIX B relative to vibration level and cushion.
Figure 9: Delta median frequency versus the delta for amplitude for all EMG Black solid line indicates the average delta scores (Epoch 3 - Epoch 1) on the two axes
CLASSIFICATION: UNLIMITED 20
Electrocardiography (ECG) and Respiration
Heart rate showed no differences between Vibration Levels or Cushion types (Figure 10A), however heart rate was significantly higher during each of the 6 vibration experimental trials as compared to resting baseline (Figure 10B). Although heart rate decreased significantly during each recovery period following vibration, heart rate did not return to resting values. It should be noted that participants were completing the subjective ratings and sensitivity tests during recovery which may influence the recovery heart rate shown in Figure 10B. Similar findings were observed for percent change in heart rate from resting baseline as for absolute heart rate, with percent change in heart rate being significantly lower in Trial 1 compared to Trials 3-6, and in Trial 2 compared to Trials 4-5 (Figure 11).
Figure 10: Absolute Heart Rate for vibration level and cushion (A) and trials (B)
Mean ± SD. Epochs 1, 2, 3 refer to the first, middle, and final 5 minutes, respectively, of the 15 minute vibration trial, T = vibration trial, R = recovery no vibration, * Significantly different than Trials 1-6
CLASSIFICATION: UNLIMITED 21
Figure 11: Percent Change in Heart Rate from rest for vibration level and cushion (A) and trials (B) Mean ± SD. Epochs 1, 2, 3 refer to the first, middle, and final 5 minutes, respectively, of the 15 minute
CLASSIFICATION: UNLIMITED 22
Heart Rate Variability (HRV) was also examined as an indicator of the participants’ arousal levels during the three Vibration Levels and when using one of the two cushions types. No significant differences between Vibration Levels or Cushion type were detected for the majority of HRV parameters: SDNN (standard deviation of normal RR intervals) and RMSSD (root mean square of successive differences between adjacent beat-to-beat intervals) within the time domain analyses, or the ratio of low frequency (0.05-0.15 Hz) and high frequency (0.15-0.4 Hz) components of HRV in the frequency domain (APPENDIX C). The R-R is the interval between successive Rs, where R is the peak of the QRS complex of the ECG wave. A comprehensive analysis of HRV, and relative changes in HRV, parameters showed similar findings of no main effects of Vibration Level or Cushion (APPENDIX D).
Sample Entropy, a nonlinear complexity measure of the RR interval time series irregularity, showed no differences between Vibration Level or Cushion type, however, entropy decreased from the first to middle 5 minutes within each 15 min vibration trial and across the 6 vibration trials (Figure 12).
Figure 12: Sample Entropy of Heart Rate Variability for vibration level and cushion (A) and trials (B) Mean ± SD. * Significantly different than Trials 4-6, # Main effect of Epoch (Epoch 1 significantly different
CLASSIFICATION: UNLIMITED 23
Respiration rate was not significantly different between Vibration Levels or Cushion type (Figure 13A), or between trials and epochs, however respiration rate was significantly higher during vibration as compared to resting baseline (Figure 13B).
Figure 13: Respiration rate for vibration level and cushion (A) and trials/epochs (B) Mean ± SD. * Significantly different than Trials 1-6
CLASSIFICATION: UNLIMITED 24
Performance Measures
A significant increase in mean reaction time, and decrease in mean reciprocal reaction time, was detected between the first 5 minutes and last 5 minutes of the post-session (POST) Psychomotor Vigilance Task (PVT) (p = 0.019, Figure 14B) but not the pre-session (PRE) PVT. No significant differences were detected between the PRE and POST PVT tests for false starts (no response), anticipation errors (RT < 100 ms), or lapses (RT > 500 ms) or for any other PVT computed variables from PRE to POST (APPENDIX E).
Figure 14: Psychomotor Vigilance Task mean reaction time (RT) (A), mean reaction time of the first and last 5 minutes of the PRE and POST PVT (B), mean of the slowest 10% of reaction times (C), and mean of the
fastest 10% of reaction times (D)
Mean ± SD. * Significant difference between the mean reaction times of the first 5 and last 5 minutes of the POST test
CLASSIFICATION: UNLIMITED 25
The tracking and vigilance task consisted of a primary task (target pursuit) and secondary task (peripheral stimuli response). No significant main effects, or interactions, were observed for the median cursor-target distance (primary task) (Figure 15A) or the median response time (secondary task) (Figure 16A) for Vibration Level or Cushion. Median was used given that it is less sensitive to outliers which were often observed within the first 30 seconds/start-up of the task. Significant main effects of Trial and Epoch (0-5, 5-10, 10-15 minutes for each of the 15 minute vibration trials) were observed for response time (Figure 16B), however not for the cursor-target distance (Figure 15B). Median response time was significantly lower for Epoch 1 as compared to Epochs 2 and 3.
Figure 15: Cursor-Target Distance in the Tracking and Vigilance Task for vibration level and cushion (A) and trials/epochs (B)
CLASSIFICATION: UNLIMITED 26
Figure 16: Response Time in the Tracking and Vigilance Task for vibration level and cushion (A) and trials/epochs (B)
CLASSIFICATION: UNLIMITED 27
For the tracking and vigilance task, no significant main effects or interaction of Vibration Level and Cushion type were detected for the number of errors, recorded as a lack of response (number No Responses) (Figure 17A). However, main effects of Trial and Epoch were detected for number of No Responses. The number of No Reponses were significantly lower for Epoch 1 compared to Epoch 3 during Trial 3, and for Epoch 3 of Trial 1 compared to Trial 3 (Figure 17B).
Figure 17: Errors of No Responses in the Tracking and Vigilance Task for vibration level and cushion (A) and trials/epochs (B)
CLASSIFICATION: UNLIMITED 28
Subjective, Somatosensory, and Tactile Spatial Acuity Measures
No significant interaction or main effects of Vibration Level or Cushion type were detected for the Karolinska Sleepiness Scale, comfort rating, 2-point discrimination, or the Von Frey Hairs pressure sensitivity tests (APPENDIX F). Regression analysis detected a significant positive trend with trial number for the Karolinska Sleepiness Scale (i.e., increased sleepiness with time). A main effect of trial number (time) was observed for the comfort rating, indicative of decreasing comfort over the duration of the 6 experimental trials (i.e., comfort was reduced following Trials 3-6 compared with Rest). No significant effects of Trial were detected for the 2-point discrimination or Von Frey Hairs pressure sensitivity tests, however, a main effect of location indicated that shoulder sensitivity was significantly lower than the thumb and little finger sensitivity.
For the discomfort rating, a significant Vibration Level × Cushion interaction was detected, in addition to a main effect of location (Figures 18A and B). Post hoc analysis revealed greater discomfort scores on the buttock compared with the thigh and left back, the left buttock compared with the right shoulder and right back, and left shoulder and neck compared to the thigh. A main effect of Trial was also detected, indicating increasing discomfort over the duration of the 6 experimental trials (Figure 18C). Specifically, discomfort was significantly greater following Trials 4-6 compared to Rest, and following Trial 6 compared to Trials 1-3.
Figure 18: Discomfort ratings for vibration level and cushion (A), trials (B), and body location (C) Mean ± SD. *Bilateral buttock significantly different than bilateral thigh and left back, # Left buttock significantly different than right shoulder and right back, ¥ Bilateral thigh significantly different than left
CLASSIFICATION: UNLIMITED 29
Acceleration and Head Position/Rotation
Acceleration at the human head showed main effects of Vibration Level and Cushion. Although the ISO-2631-1-1997 Standard weightings are only applicable to the seat interface data in the current study, acceleration at the head was weighted for health using the ISO filters given the lack of other standards for head vibration. Head acceleration was significantly greater during Vibration Levels 2 and 3 compared to Vibration Level 1, and during Level 3 compared to Level 2 for OEM Cushion 1 (Figure 19A). Head acceleration was significantly greater with OEM Cushion 1 compared to Mitigating Cushion 2 during Vibration Level 3. No main effects of Trial or Epoch were detected (Figure 19B).
Figure 19: Health-weighted head acceleration for vibration level and cushion (A) and trials/epochs (B) Mean ± SD. * Significantly different than Levels 2 and 3, # Significantly different than Level 3 for OEM
CLASSIFICATION: UNLIMITED 30
Acceleration at the seat, when weighted for health according ISO-2631-1-1997, showed main effects of Vibration Level and Cushion. Seat acceleration was significantly higher during Vibration Levels 2 and 3 compared to Level 1, and during Level 3 compared to Level 2 (Figure 20A). During Vibration Levels 2 and 3, seat acceleration was significantly higher with OEM Cushion 1 as compared to Mitigating Cushion 2. No main effects of Trial or Epoch were detected (Figure 20B).
Vibration exposure curves for health risk, according to ISO 2631-1-1997, are plotted in Figure 21. According to seat pad acceleration, the use of Mitigating Cushion 2 extended the time to reach caution by 40.4, 46.3, and 28.1 minutes for Vibration Levels 1, 2, and 3, respectively. According to head acceleration, the use of Mitigating Cushion 2 extended the time to reach caution by 17.5, 12, and 11.7 minutes for Vibration Levels 1, 2, and 3, respectively.
Figure 20: Health-weighted seat acceleration for vibration level and cushion (A) and trials/epochs (B) Mean ± SD. * Significantly different than Levels 2 and 3, # Significantly different than Level 3, ¥ OEM
CLASSIFICATION: UNLIMITED 31
CLASSIFICATION: UNLIMITED 32
Acceleration at the head, when weighted for comfort using the filters of ISO-2631-1-1997, showed main effects of Vibration Level and Cushion (ISO weightings used due to the lack of standards for head vibration). Head acceleration was significantly higher during Vibration Levels 2 and 3 compared to Level 1, and during Vibration Level 3 compared to Level 2 for OEM Cushion 1 (Figure 22A). Head acceleration was significantly higher for OEM Cushion 1 compared to Mitigating Cushion 2 during Vibration Level 3. No main effects of Trial or Epoch were detected (Figure 22B). Mitigating Cushion 2 reduced the acceleration at the head by 5.9, 7.7, and 11.5% for Vibration Levels 1, 2, and 3, respectively (Overall 8.7% reduction).
Figure 22: Comfort-weighted head acceleration for vibration level and cushion (A) and trials/epochs (B) Mean ± SD. * Significantly different than Levels 2 and 3, # Significantly different than Level 3 for OEM Cushion 1, ¥ OEM Cushion 1 significantly different than Mitigating Cushion 2. Grey shading represents
“Fairly uncomfortable” (0.5-1.0 m∙s-2
CLASSIFICATION: UNLIMITED 33
Acceleration at the seat, when weighted for comfort according to ISO-2631-1-1997, showed main effects of Vibration Level and Cushion. Seat acceleration was significantly higher during Vibration Levels 2 and 3 compared to Level 1, and during Level 3 compared to Level 2 (Figure 23A). During Vibration Levels 2 and 3, seat acceleration was significantly higher with OEM Cushion 1 compared to Mitigating Cushion 2. No main effects of Trial or Epoch were detected (Figure 23B). Mitigating Cushion 2 reduced the acceleration at the seat by 7.4, 10.1, and 11.4% for Vibration Levels 1, 2, and 3, respectively (Overall 9.9% reduction).
Figure 23: Comfort-weighted seat acceleration for vibration level and cushion (A) and trials/epochs (B) Mean ± SD. * Significantly different than Levels 2 and 3, # Significantly different than Level 3, ¥ OEM
Cushion 1 significantly different than Mitigating Cushion 2. Grey shading represents “Fairly uncomfortable” (0.5-1.0 m∙s-2) range from ISO-2631-1-1997
CLASSIFICATION: UNLIMITED 34
The human-rated shaker platform acceleration showed main effects of Vibration level as per the research experimental design. Platform acceleration was significantly higher during Vibration Levels 2 and 3 compared to Level 1, and during Level 3 compared to Level 2 (Figure 24A). No main effects of Trial or Epoch were detected (Figure 24B).
Figure 24: Shaker platform acceleration for vibration level and cushion (A) and trials/epochs (B) Mean ± SD. * Significantly different than Levels 2 and 3, # Significantly different than Level 3