Publisher’s version / Version de l'éditeur:
Vous avez des questions? Nous pouvons vous aider. Pour communiquer directement avec un auteur, consultez la
première page de la revue dans laquelle son article a été publié afin de trouver ses coordonnées. Si vous n’arrivez pas à les repérer, communiquez avec nous à [email protected].
Questions? Contact the NRC Publications Archive team at
[email protected]. If you wish to email the authors directly, please see the first page of the publication for their contact information.
https://publications-cnrc.canada.ca/fra/droits
L’accès à ce site Web et l’utilisation de son contenu sont assujettis aux conditions présentées dans le site LISEZ CES CONDITIONS ATTENTIVEMENT AVANT D’UTILISER CE SITE WEB.
Research Report (National Research Council of Canada. Institute for Research in Construction), 2011-04-01
READ THESE TERMS AND CONDITIONS CAREFULLY BEFORE USING THIS WEBSITE.
https://nrc-publications.canada.ca/eng/copyright
NRC Publications Archive Record / Notice des Archives des publications du CNRC : https://nrc-publications.canada.ca/eng/view/object/?id=05fb6d53-1846-4834-89af-a9e4f82746c2 https://publications-cnrc.canada.ca/fra/voir/objet/?id=05fb6d53-1846-4834-89af-a9e4f82746c2
NRC Publications Archive
Archives des publications du CNRC
For the publisher’s version, please access the DOI link below./ Pour consulter la version de l’éditeur, utilisez le lien DOI ci-dessous.
https://doi.org/10.4224/20374528
Access and use of this website and the material on it are subject to the Terms and Conditions set forth at Portable Air Cleaner Protocol Evaluation Report
Portable Air Cleaner Protocol Evaluation
Research Report # 311
Zuraimi Sultan, Gregory Nilsson, Robert Magee, John Bradley
Prepared for: Government of Canada, Clean Air Agenda, Indoor Air Initiative - Evaluation of IAQ Solutions in Support of Industry Innovation
________________________________________________________________________
i ABSTRACT
NRC-IRC has initiated a multi-year project to develop technological solutions protocols to improve indoor air quality. Under this activity, portable air cleaners (PACs), commercial air duct cleaning (DC) and heat/energy recovery ventilators (H/ERV) were chosen out of 50 technologies from around the world, using a ranking process developed at NRC. This test report deals with the evaluation of the portable air cleaner protocol test method. It is prepared by NRC researchers under the guidance of the Technical Advisory Committee (TAC) whose members are participants representing Federal and Provincial Agencies, Industry Associations, Non-Governmental Organizations (NGOs), Municipal governments, and Standards Associations from Canada. Compliance to this protocol test method is voluntary until and unless a jurisdiction makes compliance mandatory through legislation.
The protocol includes tests for evaluating: 1) initial removal performance of airborne particles (ultrafine, fine and coarse) and selected airborne volatile organic compounds (VOCs); 2) device emissions and by-product formation (ozone, formaldehyde, ultrafine particles); 3) acoustical performance and 4) energy consumption. For protocol validation, a brand new, commercially available and commonly used PAC was used as a test product. For performance rating validation, 12 PACs incorporating single or hybrid technologies of filtration (HEPA, electrets, or sorption), ionization (ion generation, or plasma cluster), oxidation (ozone, or ultra-violet photocatalytic), electrostatic precipitation and ultra-violet germicidal irradiation were used. The 12 PACs were tested for particle removal, airflow rates, electrical power consumption and acoustic performance to provide an “approximate” distribution/range of performance values that PACs generate to validate the performance labels.
The tests on a PAC demonstrate that it is possible to determine its emissions and by-product formation when it is turned off and operating under steady state conditions. Although ozone has been targeted under the current ANSI/UL standard (UL, 1999), other harmful pollutant emissions such as formaldehyde and ultrafine particles has not been assessed. The new protocol address this important gap as PACs passing the ANSI/UL standard can still pose harmful exposure hazards to the users.
The new protocol was tested for initial removal of particles of various from 0.05 to 5.0 μm in diameter. By including particles classified as ultrafine particles (below 0.1 microns), the protocol is the first to address the UFP removal in indoor environments using PACs. By considering size specific particle removal performance, the protocol presents a new “MERV-like” rating for existing PACs to be labeled. The rating system has been validated by testing 12 PACs of various particle removal performances.
________________________________________________________________________
ii
Initial VOC removal performance using toluene, d-limonene and formaldehyde mixture was included in the protocol assessment. The performance index for VOC removal is the single pass efficiency in removing toluene, d-limonene and formaldehyde. Toluene, d-limonene and formaldehyde are associated with solvents, cleaning agents and wood-based products emissions respectively. The new protocol was tested to evaluate PAC sound generation. Using an adopted ISO standard (ISO 3743-1), a PAC was tested using comparison procedure for determining the sound power of a test source to an ‘engineering’ grade of precision. Subsequently, 12 PACs were tested for the sound power levels measured in the reverberation chamber and the estimated sound power levels expected in a typical Canadian residential room were calculated. This provides a range of values for an acoustic labeling system to be used for a device.
Lastly, the new protocol was successfully tested for PAC electrical power consumption and its energy efficiency.
In summary, the new protocol for PAC performance and labeling has been validated for device emissions and by-product formation, particle and VOC removal, energy efficiency and sound generation.
Keywords: Portable air cleaner; clean air delivery rate; particles; volatile organic compounds; ozone; sound power; energy; protocol.
________________________________________________________________________ iii
TABLE OF CONTENTS
1 INTRODUCTION 1 1.1 Background 1 1.2 Report Outline 22 MATERIALS AND METHODS 2
2.1 IAQ Performance Test 2
2.1.1 Test Facilities 2
2.1.2 Test Summary for Determining IAQ Performance 3
2.1.3 Test Equipments 4
2.1.3.1 Particles 4 2.1.3.2 VOCs 5 2.1.3.3 Ozone 7 2.1.3.4 Ventilation 7 2.1.3.5 Environmental Parameters in Test Chamber 8
2.1.4 Schematic Layout of Test Chamber for IAQ measurements 8
2.1.5 Methodology 9
2.1.5.1 Background measurements in Test Chamber 9 2.1.5.2 PAC Emissions and By-product Formation Measurements
(Tests 1 and 2) 10 2.1.5.3 PAC Particle Removal Performance (Tests 3 to 4) 10
2.1.5.4 PAC VOC Removal Performance (Tests 5) 11
2.1.5.5 PAC air flow rate measurements 12
2.2 PAC Electrical Power Performance Test 12
2.3 PAC Acoustic Performance Test 12
2.4 Test PACs Evaluated for Validation 15
2.4.1 Protocol validation 15
2.4.2 Performance labeling validation 15
3 RESULTS AND DISCUSSION 17
3.1 IAQ Performance Tests 17
3.1.1 Test Chamber Environmental Conditions 17
3.1.2 HEPA-1 PAC air flow rates 17
3.1.3 HEPA-1 PAC emissions and by-product formation 17
3.1.4 HEPA-1 PAC Particle Removal 19
3.1.5 HEPA-1 PAC VOC Removal 22
3.2 HEPA-1 PAC Electrical Power Measurements 23
3.3 HEPA-1 PAC Acoustic Measurements 24
3.3.1 Sound Power Measurements 24
3.4 PAC Ratings 25
________________________________________________________________________
iv
3.4.2 Particle Removal Rating 26
3.4.2.1 12 PACs Particle Removal Rating 26 3.4.2.2 HEPA-1 PAC Particle Removal Rating 26
3.4.3 HEPA-1 VOC Removal Rating 27
3.4.4 Acoustic Rating 27
3.4.4.1 12 PACs Acoustic Rating 27 3.4.4.2 HEPA-1 PAC Acoustic Rating 28
3.4.5 HEPA-1 Electrical Power Rating 28
4 CONCLUDING REMARK 29
1
INTRODUCTION
1.1 Background
An important subtask of the NRC Institute for Research in Construction’s (NRC-IRC) Indoor Air Research and Development Initiative, part of the Federal Government’s Clean Air Agenda, involves the development of detailed protocols for assessing of technologies/services that claim to enhance IAQ. The objective of this subtask is to develop means for evaluating the true effectiveness of three of the most relevant air quality solutions and technologies currently used in IAQ management. These include portable air cleaners (PACs), duct cleaning and heat recovery ventilators. This report provides the test evaluation results of the new protocol for testing performance of portable air cleaners meant for residential environments.
The overall objective of this report is to validate the new protocol for testing and evaluating the overall performance of portable air cleaners which includes PAC emission and by-product formation assessment, removal performance of airborne particles and selected airborne volatile organic compounds (VOCs), energy efficiency and acoustical performance. Development of the protocol began with a literature search to uncover existing standards that could be applied to portable air cleaners, identification of knowledge gaps in the existing standards, development of a new protocol and evaluation of the protocol using several devices. This process was conducted under guidance by the NRC-IRC Technical Advisory Committee (TAC) members.
The new PAC protocol differs from current standards by incorporating four principles;
A) Uniformity: results can be used to directly compare devices on a standardized basis irrespective of their application,
B) Realistic: test conditions under realistic environmental conditions typically found indoors,
C) Flexibility: apply to diverse classes of room air cleaning devices, and D) Comprehensive: cover critical test aspects in terms of by-products
generation of some device classes, energy consumption and noise reduction.
From the homeowner’s viewpoint, there are four performance characteristics of PACs that are of interest:
A) Initial removal performance of airborne particles and selected airborne volatile organic compounds (VOCs),
B) Amount of ozone, formaldehyde and ultrafine particles emitted, C) Amount of sound generated, and
D) Amount of energy consumed. Page | 1
The new protocol developed includes procedures to quantify each of these four criteria. Currently, there are no test standards that evaluate PAC removal of airborne volatile organic compounds (VOCs). Although, test standards for PAC performance for airborne particle removal can be found in existing standards (JEM, 1995; AHAM, 2006a; JIS, 2007), they do not report particle removal as a function of particle size and for the ultrafine size ranges. Thus, the new protocol includes an improved test for particle removal performance. Methods for ozone generation were identified in some standards (UL, 2007; CSA, 2009) but were modified to reflect the latest change in Health Canada guideline on maximum indoor ozone of 40ppb (HC, 2010). Further, standard for evaluating formaldehyde and ultrafine particle emissions during device operation is currently not available. A method for assessing energy consumption was found in the AHAM AC-1 standard (AHAM, 2006a) and USEPA Energy Star label (Sanchez et al, 2008; EPA, 2000) required little modifications for incorporation into the new protocol. The acoustic performance of the device in the new protocol is different from the AHAM AC-2 standard (AHAM, 2006b) in that only the relevant and widely accepted exposure acoustic index, A-weighted sound power level is measured (ISO 3743-1). Finally and most importantly, this protocol includes a comprehensive rating system to label devices for the 4 different performance criteria. In summary, the new protocol provides a significant improvement for testing PAC performance.
1.2 Report Outline
A description of the methods used for the protocol is provided in detail in the Materials and Methods Section. Data on the new protocol evaluation results labelling using 12 PACs is provided in the Results section.
2
MATERIALS AND METHODS
2.1 IAQ Performance Test 2.1.1 Test Facilities
For indoor air quality (IAQ) performance measurements, the experiments evaluating the performance and impact of the PAC were conducted in a full-scale stainless steel chamber (5 x 4 x 2.75 m high: Volume: 55 m3). It has a
dedicated heating, ventilating, and air-conditioning (HVAC) system for simulating realistic room environmental conditions. All components including the heating coil, cooling coils, fans, and most of the duct work are made of stainless steel. The system is designed to control the supply air to the chamber at a constant flow rate adjustable between 2.5 to 142 L/s, a constant temperature adjustable between 150C and 350C, and a constant relative
humidity adjustable between 20% to 60%. All chamber openings were closed and inlet air was filtered through HEPA filters. To replicate the air distribution Page | 2
in a typical residential bedroom with floor mounted air supply diffuser and wall mounted return grill, the supply air diffuser to the chamber was arranged facing upwards while the return air grill sideward facing towards the middle of the chamber. The chamber was also positively pressurized (at 1 Pa pressure difference from the laboratory) to prevent unfiltered air from entering the chamber due to infiltration. The supply air can be set at 100% outdoor air, 100% recirculation air or combinations of the two. These specifications fulfill the chamber requirements and environmental set point conditions given in Tables 1 and 2 of the protocol. More detailed information about the chamber facility may be found in Zhang et al (1996).
Table 1 Chamber specifications for environmental conditions for PAC protocol
Specification Control Range Control Precision
Air flow rates 2.5 to 142 L/s ±3.0 %
Air exchange rates 0.05a to 1.0 ACH ±3.0 %
Temperature 17 to 27 0C ±0.5 0C
Relative Humidity 20 to 60 % ±5.0 %RH
Air pressure
a Total air leakage in 100% recirculation.
Table 2 Environmental set point conditions for the IAQ performance tests
Environmental Set points
Temperature 21.0 ± 2 0C
Relative humidity 40 ± 5 % Air exchange rates 0.05 ± 0.02 h-1
Air mixing > 80%
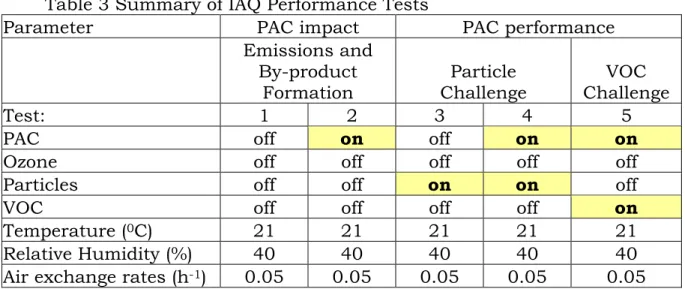
2.1.2 Test Summary for Determining IAQ Performance
For IAQ performance measurements (Table 3), the sequence of tests on each device was as follows. The emissions and by-product formation of PAC were conducted under working and non-working conditions within the chamber under Tests 1 and 2. PAC performance in removing particles and VOCs were performed under Tests 3 to 5.
Table 3 Summary of IAQ Performance Tests
Parameter PAC impact PAC performance
Emissions and By-product Formation Particle Challenge VOC Challenge Test: 1 2 3 4 5
PAC off on off on on
Ozone off off off off off
Particles off off on on off
VOC off off off off on
Temperature (0C) 21 21 21 21 21
Relative Humidity (%) 40 40 40 40 40
Air exchange rates (h-1) 0.05 0.05 0.05 0.05 0.05
2.1.3 Test Equipments
2.1.3.1 Particles
Ultrafine and fine particles (0.05 to 0.5 microns) were measured using the Scanning mobility particle sizer (SMPS): TSI 3080. The SMPS consists of an Electrostatic Classifier (TSI 3071) and a Condensation Particle Counter (CPC, TSI 3025A). The SMPS used in this test is capable of measuring particle mobility diameter in range of 17–661 nm. The sampling frequency for the SMPS is 3 minutes. Fine particles between 0.5 and 2.5 microns and coarse particles between 2.5 and 5 microns were measured using an Aerodynamic Particle Sizer (APS): TSI 3321. The APS measures particle aerodynamic size from 542–19810 nm with 52 channels. One minute averages of air samples were obtained.
The particle generator used to provide stable test particles of sufficient concentration over the 0.05 to 5 microns diameter size range is a 6 jet atomizer (TSI, 9306). The test particles used is polydisperse sodium chloride (NaCl) generated from an aqueous solution (2.93E-03 mol/m3) from a filtered air
supply (TSI, 3074b). Generated particles are then dried and electrically neutralised using (TSI, 3062) and neutraliser (TSI, 3077a) respectively. For the protocol challenge tests, the air flow through the atomizer was set at 12.5 L/min and 2 jets were used. The initial concentration of the total ultrafine and total fine and coarse particles typically reached a minimum 1 x 10⁶
particles/cm3 and 4000 particles/cm3 respectively. The corresponding initial
concentration for all size bins for ultrafine particles and fine and coarse particles reached a minimum 40000 particles/cm3 and 20 particles/cm3
respectively.
2.1.3.2 VOCs
The target VOCs for the protocol include toluene, d-limonene and formaldehyde (Table 4). These target VOCs are typically encountered in Canadian indoor environments (Otson et al, 1994; Gilbert et al., 2005; 2006) and represent organic compounds from various VOC classes. In residences, they represent the various sources of VOCs: 1) formaldehyde is known to be emitted from wood-based products; 2) toluene is reported to be emitted from solvents and gasoline; and 3) d-limonene is emitted from cleaning products and air fresheners.
Duplicate samples of target VOCs were obtained using 2 different ports. Toluene and d-limonene samples were adsorbed onto Gerstal Tenax TA adsorbent tubes. Formaldehyde samples were collected using cartridges filled with silica impregnated with an acidified solution of 2,4-dinitrophenylhydrazine (2,4-DNPH) (Waters, Sep-Pak Aldehyde Sampler). Tenax TA tubes and DNPH cartridges sampling was conducted using mass flow controlled sampling pumps at 200 mL/min. Sampling times for Tenax TA tubes and DNPH cartridges were set at 5 and 30 minutes respectively. These correspond to a sampling volume of 1 and 6 L respectively. A laboratory blank was employed for every second sample. The amount of target VOCs measured in the samples was corrected for possible contamination by subtracting the mean amount found in blanks.
Table 4 Target VOCs for the protocol
Target VOC
Abbrev. CAS no VOC class Molecular Weight (g/mol) Density (g/m3) Boiling Point (0 C)
Formaldehyde HCHO 50-00-0 aldehyde 30.03 0.815 101
Toluene TOL 108-88-3 aromatic 92.14 0.86 110.6
d-limonene LIM 5989-27-5 terpene 136.24 0.84 176
The samples were analyzed at NRC-IRC laboratory. Toluene and d-limonene samples were desorbed from tubes with helium at 50 ml min−1 at 260 °C into a cold trap. Subsequently, flash desorption was followed by a 1:1 split into two non-polar capillary columns (Varian VF-5MS, length 60 m, internal diameter, 0.25 mm, phase thickness 0.25 μm) of a Varian ION trap gas chromatograph (GC) (Varian 14677) with tandem mass selective detection (MS) (Varian 4000). Target VOCs were identified from MS total ion chromatogram either by their retention time of standard reference materials (high purity) or a NIST 2008 software library. Detection limits for Tenax TA were 1–5 μg/m3 depending on
the compound with a mean of 2 μg/m3.
Analysis of formaldehyde was performed according to ASTM D5197 and EPA TO-11 (ASTM, 2006a; EPA, 1999). Derivatized form of sampled formaldehyde in the cartridges was first extracted using acetonitrile under gravity feed into volumetric flasks. The samples were transferred to vials and then analyzed by reverse phase high performance liquid chromatography (HPLC) with a UV-VIS detector at a wavelength of 360 nm (Varian Model 9012 Solvent Delivery System/9050 Variable Wavelength UV-VIS Detector/Prostar 410 Autosampler). A gradient of acetonitrile in water from 60% to 100%. Twenty microliters of the analyte was injected onto two Supelcosil LC-18 columns (length 250 mm, inner diameter 4.6 mm; particle size 5 μm) in series, which was maintained at 30 °C. System calibration was performed using a six point calibration from a commercial DNPH derivative mixture (TO-11/IP-6A from Supelco, Inc). The relative standard deviation of the response factor was lower than 10%. The detection limit for formaldehyde is 0.03 ng, which corresponds to a detection limit 5 ng/m3 for a sampling volume of 6 L.
For toluene and d-limonene generation, pure nitrogen was supplied as a carrier gas to transfer individual target VOCs into the chamber. Their respective concentrations in the chamber air were targeted at 1 mg/m3 with a minimum
0.8 mg/m3. For formaldehyde, the target concentration in the chamber air was
0.3 mg/m3 with a minimum of 0.2 mg/m3.
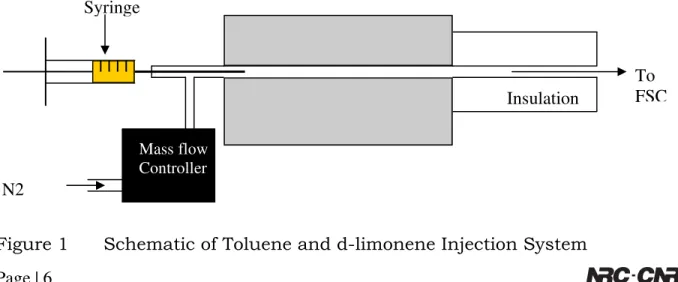
The generator used to introduce toluene and limonene into the chamber was in the form of a syringe injection system capable of loading liquid samples (Figure 1). A mass flow controller regulates the pure nitrogen gas flow through a tubing system. The syringe is connected to a tee where pure nitrogen stream flows to the oven chamber. The liquid chemical mixture released from the syringe was vaporized into a carrier gas using a temperature controlled oven set as 1800C.
The vaporized toluene and d-limonene were transferred into the full scale chamber (FSC) at a flow rate of 0.19 L/min via thermally insulated stainless steel tubing.
Syringe
Page | 6
Figure 1 Schematic of Toluene and d-limonene Injection System Insulation To FSC Mass flow Controller N2 l
The formaldehyde injection system used involves a stainless steel spatula that was inserted into the oven chamber (Figure 2). A mass flow controller regulates the pure nitrogen gas flow through the oven chamber at a flow rate of 0.19 L/min. Weighed solid paraformaldehyde samples were introduced into the oven chamber set as 1500C where it is then volatized. To ensure complete
volatization, a stainless steel ball valve closes the transfer line into the chamber for 5 minutes. After 5 minutes, the valve was opened and the vaporized formaldehyde transferred via a carrier gas into the full scale chamber (FSC) via thermally insulated stainless steel tubing.
N2
Mass Flow
controller To FSC
Insulation Ball valve
Figure 2 Schematic of Formaldehyde Injection System
2.1.3.3 Ozone
The ozone concentrations in the chamber were measured every minute with a calibrated UV absorbance ozone analyzer (2B Technologies model 205).
2.1.3.4 Ventilation
The ventilation characteristics of the chamber in terms of air exchange effectiveness (AEE), air exchange rate per hour (ACH) and the various ages of air for localized and global points were derived from tracer gas techniques. The concentration decay method using sulphur hexafluoride (SF6) as the tracer gas
was adopted. The tracer gas was introduces into the chamber and its concentration in the middle of the chamber and return air duct was monitored by a multi gas monitor and a multiple sampler (INNOVA, 1412).
The air change rate per hour (ACH) is defined as the slope of the tracer-gas concentration decay curve (ASTM, 1996b). Chamber mixing is evaluated by determining the air exchange effectiveness using ASHRAE Standard 129 test method (ASHRAE, 1997). The age of a sample of air is the average amount of time that has elapsed since molecules in this sample entered the chamber. The local age of air in the middle of the chamber was computed. A perfectly mixed Page | 7
indoor air is obtained if the AEE is equal to unity. Age of air values were obtained from the INNOVA 7620 software.
Air flow measurements in the supply, return, exhaust and fresh air ducts were monitored using calibrated orifice plates.
2.1.3.5 Environmental Parameters in Test Chamber
Temperature, relative humidity, air velocity and pressure measurements were performed in the chamber. Relative humidity and temperature measurements were conducted using calibrated RH&T probes (Honeywell , HIH-4602-C). The RH&T probe chosen was composed of a monolithic integrated circuit humidity sensor and an integral precision resistive thermal device (RTD) in a small metal canister. Air velocity measurement was conducted using omni-directional hot wire anemometers (TSI, 8386). Pressure within the chamber was noted using Setra pressure transducers.
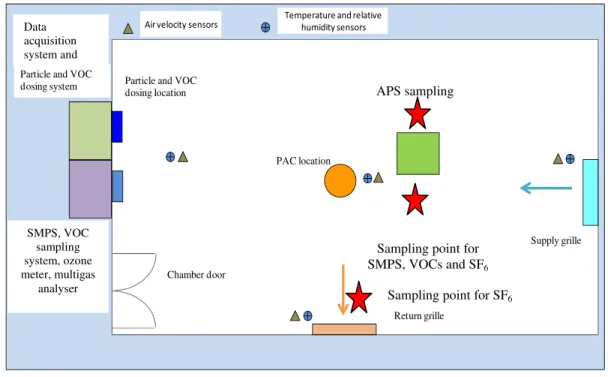
2.1.4 Schematic Layout of Test Chamber for IAQ measurements
A stainless steel multiple ports access panel was used for dosing and sampling. This panel was located at the side of the chamber, about 1 meter from the side wall and at a height of 1.2 meters.
Through the access panel, dosing particles from the 6 jet atomizer were introduced into the chamber up to 1 meter from the wall via a stainless steel tube (1/2 inch OD). Volatilized VOCs from the 2 generators using 2 different ports (for toluene and d-limonene in one and formaldehyde in another) were introduced into chamber. SF6 tracer gas was dosed through a separate
ventilation dosing port.
Extractive sampling of ultrafine and fine particles for SMPS and target VOCs was accomplished using different sampling ports placed in transfer plate. All sampling lines were constructed of stainless steel and draws air from the middle of the chamber. The APS used to sample fine particles above 0.5 microns and coarse particles was placed in the middle of the chamber on top of a stainless steel table (1.0 meter above the chamber floor). SF6 concentration in
the middle of the chamber and return air duct were monitored by a multi gas monitor and a multiple sampler using PTFE lines.
Temperature, relative humidity and air velocity measurements were performed at 4 locations in the chamber. The schematic layout of the test chamber illustrating various equipments and sampling locations is given in the floor plan sketch (Figure 3).
Page | 9
PAC location
Supply grille
Return grille Particle and VOC
dosing location
particle measuring instruments VOC sampling
location
Figure 3 Floor plan sketch showing the layout of the chamber for IAQ performance tests
2.1.5 Methodology
2.1.5.1 Background measurements in Test Chamber
The chamber environmental conditions were first ascertained before any tests were conducted. Background total SMPS, three target VOCs and ozone concentration levels were measured. Chamber air temperature, relative humidity, air flow rates, chamber mixing and air exchange rates were also measured. All measurements were conducted under steady state conditions. The concentrations limits are given in Table 5.
Table 5 Maximum steady state concentrations for background levels
Parameters Maximum steady state
concentration
Individual target VOCs 10 μg/m3
Total SMPS 50 no/cm3
Total APS 5 no/cm3
Ozone 5 ppb on-line TVOC analyser Chamber door Data acquisition system Particle and VOC dosing system
Air velocity sensors Temperature and relative humidity sensors
Data acquisition system and
APS sampling
Sampling point for SMPS, VOCs and SF6 SMPS, VOC sampling system, ozone meter, multigas analyser
2.1.5.2 PAC Emissions and By-product Formation Measurements (Tests 1 and 2)
In the “PAC OFF” emissions (Test 1), the PAC was placed in the middle of the chamber (Figure 1), tested for proper operation and then switched off. Air samples were taken for analysis after steady state conditions were ascertained1. Air samples were collected for target VOCs, total SMPS and ozone
measurements.
The procedures used for “PAC OFF” emissions were repeated for the “PAC ON” emissions (Test 2) except this time, the PAC was energized remotely to its maximum setting without a person entering the chamber. Air samples were taken for target VOCs and total SMPS under steady state conditions. For ozone measurements, 24 hour concentration values were monitored. The equilibrium ozone concentration defined as an average of 30 minute background corrected steady state concentration was computed. The net emission rates for ozone, target VOCs and total SMPS were then calculated according to Section 8.3 of the protocol.
2.1.5.3 PAC Particle Removal Performance (Tests 3 to 4)
The performance index for particle removal is the clean air delivery rate (CADR). To calculate the CADR, Tests 3 and 4 were performed.
In Test 3, the PAC was turned off and placed in the middle of the chamber. Particles were then generated into the chamber for approximately 60 minutes. One minute after the dosing was stopped, particle concentration was measured for a period of 60 minutes. The experiment was then stopped. The total and size-resolved natural decay constant of particles, kn (h−1), due to air exchange and deposition on the chamber walls was then computed.
The particle dosing procedure was then repeated for Test 4. One minute after the dosing was stopped, the PAC was turned on at its highest setting remotely without entering the chamber and the particle concentration was measured for a period of 60 minutes. The total and size-resolved particle decay kPAC (h−1) due to the PAC, air exchange and deposition on the chamber walls was then calculated.
Total and size-resolved particle decay constants under Test 3 (kn) and Test 4 (kPAC) were calculated by fitting a linear regression line to the slope of −ln(C(t)/C(0)), which is the negative of the natural log of the time-varying concentration (C(t)) normalized by the initial concentration at the time particle
Page | 10
1 A condition where concentrations of online measurements do not fluctuate greater than ± 10%
during a 30 minute period is considered as having achieved steady state (see definition of steady state in protocol).
dosing was stopped (C(0)), versus time (h). A minimum correlation coefficient of 0.95 and 0.90 for total APS and size resolved particles respectively determines if the test is acceptable.
Total APS and size-resolved particle CADR (m3/h) was calculated by
multiplying the chamber volume with difference in the background decay of particles from the decay when the air cleaner was energized given as: CADR=V(kPAC−kn) where V is the volume of the chamber (m3). A standard deviation less than CADR = 39 m3/h or 20%, whichever is greater, determines
if the test is acceptable.
2.1.5.4 PAC VOC Removal Performance (Tests 5)
The performance index for VOC removal is the single pass efficiency (SPE). To calculate the SPE, Test 5 was performed.
In Test 5, the PAC in an “off” position was placed in the middle of the chamber and then VOCs were generated into the chamber. One minute after the dosing was stopped, the PAC was turned on at its highest setting remotely without entering the chamber. Five minutes after the air cleaner was turned on, VOC sampling was conducted at time periods 5 minutes after dosing stopped and repeated at the 10, 15, 20, 25, 30, 45, 60, 90, 120, 180 and 240 minutes.
Sampling interval for toluene and d-limonene was 5 minutes. For formaldehyde, the sampling intervals were 5 minutes for time periods at 5, 10, 15, 20, 25 and 30 minutes and 30 minutes for time periods greater than 30 minutes respectively. The experiment was then stopped. The decay constant of VOC, kPAC,V (h−1), due to air exchange and PAC was then computed.
As the sink effects of VOCs on the stainless steel chamber was insignificant, it was ignored from the calculation of the natural decay constant. The VOC natural decay constant, kn,V (h−1), due to air exchange was obtained from the air exchange rates. Target VOC decay constants kPAC,V were calculated by fitting a linear regression line to the slope of −ln(C(t)), which is the negative of the natural log of the time-varying concentration (C(t)) versus time (hr) under the PAC “ON” test. A minimum correlation coefficient of 0.9 was used to as criteria for test acceptance.
For some PAC technologies, the VOC removal process may not be log-linear. Under this scenario, a linear regression of ln (C(t)) versus time cannot fit the measured concentration decay curve well (Chen et al., 2005). Here, the concentration data is fitted against time with another selected curve format (i.e. double exponential decay).
Target VOC removal rate attributed to the PAC was calculated by determining the PAC removal rate (kPAC,V- kn,V) based on the time-average concentration decay during the test period. The single pass efficiencies of the target VOCs are then computed using the equation: SPE = V(kPAC,V- kn,V)/Q where V is the volume of the chamber (m3) and Q is the airflow rate of the PAC.
2.1.5.5 PAC air flow rate measurements
A hot wire anemometer was used (TSI Q-Trak) to determine the total air flow rate (Q) through the PACs. The anemometer is used to measure the air velocity at multiple points on the supply outlet of the PAC in question. These values were averaged and divided by the total surface area of the supply outlet.
2.2 PAC Electrical Power Performance Test
The standby and operating electrical power measurements were conducted using the BMI (Basic Measuring Instruments) 3060 Power Profiler. For operating electrical power measurements, the BMI 3060 was connected to the power supply and the PAC. The PAC fan was turned to the maximum setting and left running for 5 minutes. The power indicator of the BMI 3060 was adjusted to 1 phase and 120 Volts-60 Hertz and the watt readings were noted for 10 minutes at one minute-intervals. The same process was repeated for standby electrical power measurements with the PAC under standby condition without turning on the fan.
2.3 PAC Acoustic Performance Test
For acoustic measurements, the experiments to evaluate the performance of the PAC were conducted in a reverberant test chamber in NRC. This test chamber conforms to the requirements of the ISO 3743-1 method. The chamber room has dimensions 7.96 x 7.09 x 4.87 m high and a volume of 251.7 m3. The surfaces of the room are hard painted concrete. Five low
frequency sound absorption panels were installed in the room to reduce the low frequency spatial variation of sound levels. The temperature and relative humidity in the room were between 20.9 and 21.4 0C and 54.2 and 60.1 %
respectively.
The comparison procedure for determining the sound power of a test source to an ‘engineering’ grade of precision described in ISO 3743-1 was adopted. The reference source has been calibrated to a ‘precision’ grade according to ISO 3741 and met all of the requirements in ISO 6926 for reference sound sources. The portable air cleaner was placed on the floor of the reverberation chamber at least 1 m from all walls. The PAC was turned on to the maximum setting, with all additional features switched on. The sound power levels were Page | 12
determined in accordance with ISO standard 3741-3 and using an ILG reference sound source conforming to the ISO 6926 standard.
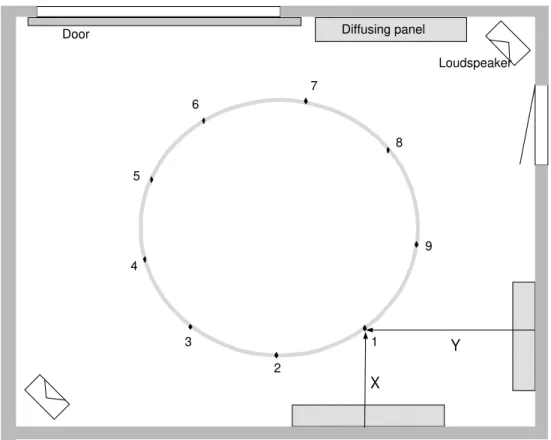
The sound levels of the test specimen and the ILG reference sound source were measured at the 36 combinations of 4 source positions (Figure 4) and 9 receiver positions (Figure 5 and Table 6).
1 3 2 4 2.02 m Loudspeaker Diffusing panel Door 4.51 m 3.43 m 3.98 m 4.90 m 4.71 m 3.93 m 2.23 m
Figure 4. Sound source positions on floor plan sketch.
Loudspeaker Diffusing panel Door 1 2 3 4 5 6 7 8 9 X Y 1 2 3
Figure 5. Microphone positions on floor plan sketch. Table 6. Microphone positions used in these measurements.
Position X-coordinate, mm Y-coordinate, mm Z-coordinate, mm #1 1600 2580 1200 #2 1040 3780 3400 #3 1400 5120 1450 #4 2440 5910 3150 #5 3860 5860 1750 #6 4850 4990 2850 #7 5050 3320 2000 #8 4360 2310 2600 #9 3180 1970 2300 Page | 14
Page | 15
2.4 Test PACs Evaluated for Validation 2.4.1 Protocol validation
The test device was a brand new, commercially available and commonly used PAC classified as HEPA-1 (see Table 7). It has a cylindrical shape where air is being drawn from the bottom, moved through the filtration system and the treated air is then distributed annularly upwards. The system filtration contains a carbon pre-filter and a HEPA filter. The manufacturer’s claim for this device include being able “to remove 99.7% of all microns that are 0.03 microns and larger in size” and “removing household odors”. Although it has 3 fan speeds, all tests were conducted at the maximum fan setting. All aspects of the protocol were tested using this PAC.
2.4.2 Performance labeling validation
To validate the labeling system of performance used for the protocol, 12 PACs incorporating single or hybrid technologies of filtration (HEPA, electrets, or sorption), ionization (ion generation, or plasma cluster), oxidation (ozone, or ultra-violet photocatalytic) electrostatic precipitation and ultra-violet germicidal irradiation were used (Table 7). The 12 PACs were tested for particle removal, airflow rates, power consumption and acoustic performance to provide an “approximate” distribution/range of values that PACs generate to validate the performance labels. Due to the large number of tests required at the engineering level of precision to evaluate the sound power levels for each PAC, a reduced version of the test was performed for all 12 PACs. Here, the measurements were a quick approximation of the ISO standard and used only 1 source position, and 9 microphone positions. It can be shown that using this approach and that with the actual ISO standard, the values obtained were similar (within 0.3 to 0.4 dB).
Table 7 Brief description of tested portable air cleaners (PACs) PAC
abbreviation
Brief description of PACs and their technology
HEPA-1 HEPA filter: 3600 bottom axial air intake and top axial discharge
using fan. Particle laden air is passed through cylindrical drum HEPA filter media. Secondary activated carbon pre-filter.
(LxWxH=40 cm x 40 cm x 50 cm)
HEPA-2 HEPA panel filter: a fan draws in air through a “mini-pleat” HEPA filter media panel. (LxWxH=40 cm x 40 cm x 70 cm)
FEF Fibrous electret filter panel media: a fan draws in air through polarized filter media panel. (LxWxH=50 cm x 20 cm x 70 cm) HCZ HEPA filter: a fan drawing air passing it through a cylindrical
drum of 3 staged integrated filters consisting: 1) medium particle pre-filter, 2) 15lbs activated carbon/zeolite impregnated with potassium iodide filter and 3) HEPA filter. Secondary large particle prefilter. (LxWxH=35 cm x 35 cm x 60 cm).
ESP Electrostatic precipitator: a fan, ionizing wires at 6 kV, collector plates and an activated carbon filter. (LxWxH=50 cm x 40 cm x 55 cm).
IG-1 Negative ion generator: a fan and non-thermal corona discharge. (LxWxH=45 cm x 25 cm x 15 cm)
IG-2 Negative ion generator: an oscillating tower fan with non-thermal corona discharge. (LxWxH=10 cm x 10 cm x 110 cm)
PCI Bipolar ion generator: a fan, alternating plasma discharge. Secondary HEPA media filter (LxWxH= 40 cm x 10 cm x 60 cm) PCO-1 Photocatalytic oxidation: a high flow fan, proprietary high
reflectance photocatalytic oxidation coating technology using 95W UVC lamps. Secondary panel media filter. (LxWxH= 45 cm x 70 cm x 135 cm)
PCO-2 Photocatalytic oxidation: a small fan, proprietary high-intensity broad spectrum UV tube in a hydrated nano-Nickel coating catalytic matrix cell. (LxWxH=10 cm x 10 cm x 40 cm)
O3 GEN Ozone generator: a commercial corona discharge utilizing mica plate technology (200 mgh-1 maximum ozone emission rate) with
a small axial fan (LxWxH=5 cm x 15 cm x 15 cm).
UVGI Ultraviolet germicidal irradiation: a small fan draws in air
through bottom axial intake and passes it along a 9W UVC lamp and odor filtering material. (LxWxH= 15 cm x 15 cm x 40 cm)
3
RESULTS AND DISCUSSION
3.1 IAQ Performance Tests
3.1.1 Test Chamber Environmental Conditions
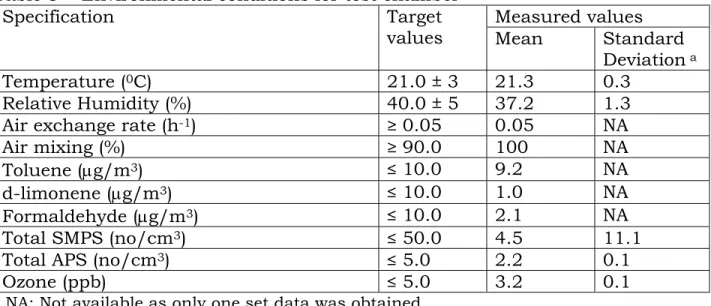
Table 8 summarizes the mean and standard deviation of environmental conditions in the test chamber for the IAQ performance tests. The data confirms that that the environmental conditions were within the required set point conditions of the protocol.
Table 8 Environmental conditions for test chamber
Specification Target values Measured values Mean Standard Deviation a Temperature (0C) 21.0 ± 3 21.3 0.3 Relative Humidity (%) 40.0 ± 5 37.2 1.3
Air exchange rate (h-1) ≥ 0.05 0.05 NA
Air mixing (%) ≥ 90.0 100 NA
Toluene (μg/m3) ≤ 10.0 9.2 NA
d-limonene (μg/m3) ≤ 10.0 1.0 NA
Formaldehyde (μg/m3) ≤ 10.0 2.1 NA
Total SMPS (no/cm3) ≤ 50.0 4.5 11.1
Total APS (no/cm3) ≤ 5.0 2.2 0.1
Ozone (ppb) ≤ 5.0 3.2 0.1
a NA: Not available as only one set data was obtained.
3.1.2 HEPA-1 PAC air flow rates
The tests were conducted twice measuring at 32 air outlet nodes of HEPA-1 PAC. The calculated mean and standard deviation of the air flow rate Q, was 282 and 12.2 m3/h respectively.
3.1.3 HEPA-1 PAC emissions and by-product formation
The steady state concentrations of three target VOCs, total SMPS and ozone are summarized in Table 9 and illustrated in Figure 4. Table 10 and Figure 4 provide the net emission rates values.
It can be seen that concentrations and emission rates for formaldehyde and toluene increased when the PAC was first introduced into the chamber and subsequently turned on. The increases in toluene and formaldehyde concentrations were 24% and 300% when the PAC was introduced in the chamber. The percentage increase for formaldehyde was about an order higher in magnitude than the instrumental and Page | 17
sampling method error. When the PAC was turned on, the respective increase in concentrations compared to when the PAC was turned off were 333 and 110% for toluene and formaldehyde respectively. These suggest that the PAC and its operation were sources for these VOCs. Respective background corrected emission rates for formaldehyde and toluene were 17.2 and 6.1 μg/h when the PAC was turned off and 42.7 and 110.6 μg/h when the PAC was turned on.
Although mean concentration of total SMPS increased, overlapping standard deviations indicate that the differences were not statistically significant (Tables 9 and 10).
Ozone concentrations did not increase under steady state conditions under Tests 1 and 2. Thus, the 24 hours test meant to evaluate equilibrium ozone concentration was terminated.
Table 9 Steady state concentrations of target VOCs, total ultrafine and total fine and coarse particles and ozone
Test
PAC turned “OFF” PAC turned “ON” mean SD mean SD Toluene (μg/m3) 11.4 1.4 49.4 8.6 d-limonene (μg/m3) 1.0 0.0 1.0 0.0 Formaldehyde (μg/m3) 8.4 0.2 17.6 2.2 Ozone (ppb) …a … a … a … a Total SMPS (no/cm3) 7.3 2.6 11.9 16.8
a test terminated due to no increase in steady state concentrations
Table 10 Emission rates of target VOCs, total SMPS and ozone Test
PAC turned “OFF” PAC turned “ON” mean SD mean SD
Toluene (μg/h) 31.3 4.0 135.8 23.8
d-limonene (μg/h) 2.7 0.0 2.7 0.0
Formaldehyde (μg/h) 23.0 0.6 48.5 6.0
Ozone (μg/h) …a …a …a …a
Total SMPS (no/h) 4.7E+08 1.7E+08 7.7E+08 1.1E+09 a test terminated due to no increase in steady state concentrations
Page | 19
Figure 4 Concentrations and emission rates of target VOCs and total 1.00E+08 1.00E+09 Total SMPS E m issi o n ra t e s (n o / h r ) Background PAC turned "OFF" PAC turned "ON" 0 5 10 15 20 Total SMPS Co n c e n t r a t io n (n o / c m 3) Background PAC turned "OFF" PAC turned "ON" 0 10 20 30 40 50
Toluene d‐limonene Formaldehyde
Co n c e n t r a t io n ( μ g/ m 3) Background PAC turned "OFF" PAC turned "ON" 1.0 10.0 100.0 1000.0
Toluene d‐limonene Formaldehyde
Em is s ion Ra tes ( μ g/ h r ) Background PAC turned "OFF" PAC turned "ON" SMPS.
3.1.4 HEPA-1 PAC Particle Removal
Figure 5 illustrates the total APS versus time profile under natural decay (Test 3) and PAC (Test 4) conditions. The concentrations were normalized by the initial concentration to facilitate comparison. It is observed that the total APS decayed naturally to 64% of its initial concentration midway through the test. In the same period, the PAC reduced the concentration to 3% of its initial concentration.
The CADR values for various particles parameters are given in Table 11 and Figure 6. For total APS, the standard deviation was within 20% of the CADR value indicating the tests are acceptable. The R2 value for the
Page | 20
Figure 5 Total APS concentration decay under test 3 (natural decay) and test 4 (PAC)
0.00 0.20 0.40 0.60 0.80 1.00 0.00 0.15 0.30 0.45 0.60 0.75 0.90 Ctim e /Cin it ial Time (hr) PAC natural decay APS Total APS
Table 11 and Figure 6 also provide the particle size resolved CADR values for particles ranging from 0.05 to 5.0 μm. All the size resolved particle standard deviations were within 20% of the CADR values indicating that the tests were acceptable. For all particle sizes, the minimum R2 value for
the slope of the regression fit was 0.90. CADR values range from 274 to 349 m3/h for particle size range 0.05 to 0.30 μm, 302 to 382 m3/h for
particle size range 0.30 to 0.90 μm and 242 to 412 m3/h for particle size
range 1.0 to 5.0 μm. Waring et al (2008) reported comparable CADR values about 300 m3/h for particles ranging from .05 to 0.30 μm using a
HEPA-based PAC. CADR values using another HEPA-based PAC were slightly lower at about 200 m3/h for the same particle size range.
100 200 300 400 500 10 100 1000 10000 CA DR (m 3/ h r) particle size (nm)
Figure 6 Size resolved particles clean air delivery rates (CADR) of PAC Table 11 PAC clean air delivery rates (CADR) and standard deviations
(SD) for various particle parameters
Particle size (nm) CADR Standard
deviation 50 296.1 0.1 60 314.2 0.1 70 310.7 4.0 80 262.1 0.4 90 312.0 0.3 100 315.1 0.8 200 329.8 0.9 300 313.8 0.7 400 329.5 2.4 500 349.3 2.5 600 360.5 0.5 700 375.6 9.9 800 396.8 1.7 900 391.1 2.8 1000 261.3 1.2 1500 278.8 0.7 2000 344.4 0.6 2500 394.9 0.4 3000 411.0 0.2 4000 417.1 1.3 5000 415.5 0.1 Total APS 320.2 1.4 Page | 21
3.1.5 HEPA-1 PAC VOC Removal
Figure 7 illustrates the time profile decay for natural logarithm of target VOC concentrations when the PAC is turned on (Test 5). It can be observed that the minimum correlation coefficient for linear regression line to the slope of −ln(C(t)), which is the negative of the natural log of the time-varying concentration (C(t)) versus time (hr) was 0.9. Using the decay constants for the target VOCs, respective CADR and SPE values were calculated and given in Table 11. It is observed that the PAC has very low removal for formaldehyde with the single pass efficiency (SPE) value not statistically different from zero. The removal efficiencies for toluene and d-limonene were also marginal.
The results were compared with published studies using activated carbon and media filter (Daisey et al., 1989; Chen et al., 2005). Daisey et al., (1989) reported toluene CADR values ranging from 41 to 45 m3/h
(products P2 and ES). Chen et al (2005) documented toluene CADR values ranging from 24 to 88 m3/h (products P2, P4, P5 and P6) and
formaldehyde CADR values ranging from 1.4 to 10.9 m3/h. These values
are comparable to the test results obtained from this protocol evaluation. In summary, the single pass efficiencies of the PAC for removal of formaldehyde, toluene and d-limonene are 3, 14 and 22% respectively.
y = ‐0.1969x + 5.9972 R² = 0.9416 y = ‐0.7778x + 6.4847 R² = 0.925 y = ‐1.1817x + 6.6093 R² = 0.9543 0 1 2 3 4 5 6 7 8 0.0 1.0 2.0 3.0 4.0 5 Ln (C once nt ra ti on) Time (hr) .0 Formaldehyde Toluene d‐limonene
Figure 7 Target VOCs concentration decay under test 5 (PAC “ON”) Page | 22
Page | 23
Table 11 Mean PAC clean air delivery rates (CADR), single pass efficiencies (SPE) and standard deviations (SD) for VOCs
Target VOC CADR (m3/hr) Single Pass
Efficiency (%)
Mean SD Mean SD
Formaldehyde 8.6 0.7 3.1 12.3
Toluene 40.6 0.1 14.4 12.2
d-limonene 62.8 0.0 22.3 12.2
3.2 HEPA-1 PAC Electrical Power Measurements
The electrical power measurements results are given in Table 12 and 13. Since the PAC has a total APS CADR value greater than 50 m3/h, it
qualifies to be considered as an energy efficient device. Using the 10 data points, the average electrical operation power was 167 Watts.
Table 12. Power measurements during PAC operation Operating Power Measurements
Time of sample (min) Average
Voltage (V rms) 118.78 Neutral to ground (V rms) 0.79 Current (A) 1.33 Power (W) 154.30 Volt-Amps 157.80 Volt-Amps Reactive 31.97
Table 13. Power measurements during PAC standby Standby Power Measurements
Time of sample (min) Average
Voltage (V rms) 119.72 Neutral to ground (V rms) 0.91 Current (A) 0.05 Power (W) 0.17 Volt-Amps 6.23 Volt-Amps Reactive 0.07
3.3 HEPA-1 PAC Acoustic Measurements 3.3.1 Sound Power Measurements
The comparison procedure for determining the sound power of a test source to an ‘engineering’ grade of precision is described in ISO 3743-1. The measurements conform fully to this standard. The results also depend on the measured sound power output of the ILG reference sound source obtained in a separate test described in ISO 3741, which describes precision sound power measurements in a reverberant environment. The measurement of the sound power output of the ILG reference sound source conformed fully to the ISO 3741 procedure.
For the comparison test, the reference sound source must also comply with ISO 6926, which describes the required characteristics of a reference sound source. The measurements of the ILG reference sound source show it to differ from these requirements in one small aspect. According to ISO 6926 the sound power of a reference sound source should not vary by more than 3 dB between adjacent 1/3 octave bands over the 1/3 octave band frequencies from 100 to 10,000 Hz. The one exception was that between 8k Hz and 10k Hz the sound power level of the ILG source varied by 4.7 dB. This could slightly increase the measured level of the ILG reference source at 10k Hz. However, this is not expected to have a significant effect on the calculated sound power of the test specimen because the sound power levels are only reported in octave bands, and especially since the 8k Hz octave band results for the test specimen are more than 15 dB below the maximum octave band level found in the 500 Hz octave band.
Table 14 gives the mean octave band sound pressure levels and the standard deviations of these levels, as well as octave band sound power levels for the ILG reference sound source and the test specimen. The overall A-weighted sound power level of the PAC was 69.5 dBA.
Figure 8 plots the measured octave band sound power levels of the PAC unit versus octave band frequency showing a maximum output in the 500 Hz octave band.
Table 14. Measured mean octave band sound pressure levels, standard deviations, SD, Lp, and sound power levels, Lw, for the ILG RSS (reference
sound source) and the portable air cleaner. Reference Sound Source PAC
Lw (dB) Lp (dB) SD Lp (dB) SD Lw (dB) 125 Hz 74.44 67.94 0.8 55.17 0.77 61.67 250 Hz 74.85 69.99 0.2 60.75 0.31 65.61 500 Hz 73.28 68.78 0.3 63.36 0.28 67.85 1k Hz 75.39 71.02 0.3 60.82 0.27 65.19 2k Hz 78.23 73.02 0.3 55.77 0.32 60.98 4k Hz 80.06 73.61 0.4 48.85 0.56 55.30 8k Hz 78.47 70.15 0.6 41.05 0.90 49.37 A-weighted 85.0 79.1 0.3 64.8 0.2 69.50 30 35 40 45 50 55 60 65 70 125 Hz 250 Hz 500 Hz 1000 HZ 2000 Hz 4000 Hz 8000 Hz So un d Powe r [d B re : 1e ‐12 W ] Frequency (Hz)
Figure 8 Octave band sound power levels, Lw, of the PAC
3.4 PAC Ratings
3.4.1 HEPA-1 PAC Emissions and By-product Formation Rating
The ozone measurement was terminated because there was no increase in ozone concentration levels when the PAC was turned on. Thus, the Page | 25
PAC has no predicted ozone formation effect corresponding to “negligible” emissions of ozone rating based on the protocol.
The steady state formaldehyde emission rate after the PAC was turned on was lower than 0.41 mg/hr. Thus, the PAC is classified as having “low” formaldehyde emissions rating.
In terms of particle emissions, the PAC recorded particle emission rate that was not significantly different than chamber background levels during operation. Thus, the PAC is classified as having “low” particle emissions rating.
3.4.2 Particle Removal Rating
3.4.2.1 12 PACs Particle Removal Rating
12 PACs (Table 7) of various technologies were tested for their particle removal performance. The size resolved particle CADR values in the 21 particle sizes given was averaged and the resultant 4 averaged CADR (RR1, RR2, RR3, RR4) are given in Table 15. Their particle removal rate
parameters (PRR) are also given in Table 15.
It is observed that the PRR ratings for the various PACs range from 1 to 9. The lower range of the PRR values correspond to the lowest number given in the protocol rating while the highest range of the PRR values correspond to the second highest number in the protocol rating. However, some composite average CADR values for the ESP (one of the 2 PACs with the highest PRR rating) are close to the lower limit values for the highest PRR number. ESP fulfill the criteria to achieve a PRR value of 10 for RR2, RR3 and RR4 but is marginally lower for RR1.
3.4.2.2 HEPA-1 PAC Particle Removal Rating
The composite averaged CADR values (m3/h) for HEPA-1 PAC is given in
Table 16. The PRR rating is 8 according to Table 6 in the protocol 9.
Table 15 Composite average particle CADR values (m3/h) and PRR
ratings for 12 PACs of various technologies. PAC
abbreviation
Composite average particle CADR values (m3/h) PRR rating RR1 RR2 RR3 RR4 ESP 496.2 587.3 622.9 620.2 9 HEPA-2 462.5 584.3 523.3 606.7 9 HEPA-1 306.7 359.5 338.1 414.5 8 FEF 299.8 400.6 331.6 484.8 8 HCZ 73.2 110.7 88.4 124.2 5 IG-1 4.6 18.9 23.1 10.1 3 IG-2 2.2 16.3 15.4 17.2 3 PCI 15.6 47.9 112.3 76.0 4 PCO-1 9.4 15.7 49.6 30.1 3 PCO-2 6.3 5.0 5.3 1.2 1 O3 GEN -14.6 15.8 1.0 -5.7 1 UVGI -6.0 5.1 0.6 -12.0 1
Table 16 Composite averaged CADR values (m3/hr) for HEPA-1 PAC
Average CADR Designator
Corresponding
particle size range group, nm.
CADR range Average CADR
RR1 50 to 300 262 to 329 306.7
RR2 300 to 1000 314 to 397 359.5
RR3 1000 to 3000 261 to 411 338.1
RR4 3000 to 5000 411 to 417 414.5
3.4.3 HEPA-1 VOC Removal Rating
The VOC removal rating for the PAC in SPE is given in percentage where zero represents no removal and 100% represents complete removal. For the tested PAC, the VOC ratings for formaldehyde, toluene and d-limonene are 3, 14 and 22% respectively.
3.4.4 Acoustic Rating
3.4.4.1 12 PACs Acoustic Rating
Page | 27
Of a sample of 12 different types of PAC units of various technologies, 16.7% were rated category A, 8.3% category B, and 75.0% were rated category C (Table 7). However, 4 of the units rated as category C were
within 5 dB or less of being in category B. This shows that the rating categories usefully separate PAC units according to their measured sound levels and that many units produce relatively low sound levels or are close to being in the quieter 2 categories.
Table 17 A-weighted sound power levels estimated for a typical Canadian residential room and measured in the chamber and sound power rating for 12 PACs.
PAC Technology description A-weighted sound
power levels (dBA) Sound power rating
SWLa SPL
ESP Electrostatic precipitator 62.5 54.9 C
HEPA-2 HEPA panel filter 76.6 69.0 C
HEPA-1 HEPA filter; activated carbon prefilter 69.9 62.3 C FEF Fibrous electret filter panel media 42.4 34.8 A HCZ HEPA filter; activated carbon/zeolite
filter 62.5 54.9 C
IG-1 Negative ion generator 63.7 56.1 C
IG-2 Negative ion generator 61.3 53.7 C
PCI Bipolar ion generator 69.2 61.6 C
PCO-1 Photocatalytic oxidation 63.1 55.5 C
PCO-2 Photocatalytic oxidation 37.5 29.9 A
O3 GEN Ozone generator 45.8 38.2 B
UVGI Ultraviolet germicidal irradiation 58.1 50.5 C
3.4.4.2 HEPA-1 PAC Acoustic Rating
Using Table 7 of the protocol, the PAC acoustic performance rating for this device is C.
3.4.5 HEPA-1 Electrical Power Rating
The power measurements results are given in Table 13 and 14. Since the PAC has a total APS CADR value greater than 85 m3/h, it qualifies to be
considered as an energy efficient device. Using the average 10 minute values for the operation power, the energy efficient index (EEI) is given by = 320.2/154.3 = 2.08 CADR/Watt. The CADR/Watt value is lower than the minimum 3.4 required to rate the PAC to be energy efficient.
4
CONCLUDING REMARK
The tests on a PAC demonstrate that it is possible to determine its emissions and by-product formation when it is turned off and operating under steady state conditions. Although ozone has been targeted under the current ANSI/UL standard (UL, 1999), other harmful pollutant emissions such as formaldehyde and ultrafine particles have not been assessed. The new protocol addresses this important gap as PACs passing the ANSI/UL standard can still pose harmful exposure hazards to users.
The new protocol was tested for initial removal of particles in the range of 0.05 to 5.0 μm in aerodynamic diameter. By including particles classified as ultrafine particles (below 0.1 microns), the protocol is the first to address the UFP removal in indoor environments using PACs. By considering size specific particle removal performance, the protocol presents a new “MERV-like” rating for existing PACs to be labeled. The rating system has been validated by testing 12 PACs of various particle removal performances.
Initial VOC removal performance using toluene, d-limonene and formaldehyde mixture was included in the protocol assessment. The performance index for VOC removal is the single pass efficiency in removing toluene, d-limonene and formaldehyde. Toluene, d-limonene and formaldehyde are associated with solvents, cleaning agents and wood-based products emissions respectively.
The new protocol was tested to evaluate PAC sound generation. Using an adopted ISO standard (ISO 3743-1), a PAC was tested using comparison procedure for determining the sound power of a test source to an ‘engineering’ grade of precision. Subsequently, 12 PACs were tested for the sound power levels measured in the reverberation chamber and the estimated sound power levels expected in a typical Canadian residential room were calculated. This provides a range of values for an acoustic labeling system to be used for a device.
Lastly, the new protocol was successfully tested for PAC electrical power consumption and its energy efficiency.
In summary, the new protocol for PAC performance and labeling has been validated for device emissions and by-product formation, particle and VOC removal, energy efficiency and sound generation.
5
REFERENCES
AHAM 2006a. ANSI/AHAM Method AC-1-2006 “Method for Measuring Performance of Portable Household Electric Room Air Cleaners.” Association of Home Appliance Manufacture.
AHAM 2006b. ANSI/AHAM Method AC-2-2006 “Method for Sound Testing of Portable Household Electric Room Air Cleaners”. Association of Home Appliance Manufacture
ASTM, 1995. ASTM Method E 741. “Standard test method for determining air change in a single zone by means of tracer gas dilution” American Society for Testing and Materials, Philadelphia, PA.
ASTM 2006a. ASTM Method D 5197-09 “Test Method for Determination of Formaldehyde and Other Carbonyl Compounds in Air (Active Sampler Methodology)” American Standards and Testing Methods (ASTM) International.
ASTM, 2006b. ASTM Method E 471-00 “Test Method for Determining Air Change in a Single Zone by Means of a Tracer Gas Dilution” American Standards and Testing Methods (ASTM) International.
ASTM, 2007. ASTM Method D 6670 – 01 (Reapproved 2007) “Standard Practice for Full-Scale Chamber Determination of Volatile Organic Emissions from Indoor Materials/Products.” American Standards and Testing Methods (ASTM) International.
ASTM, 2009. ASTM Method D 6196 – 03 (Reapproved 2009) “Standard Practice for Selection of Sorbents, Sampling, and Thermal Desorption Analysis Procedures for Volatile Organic Compounds in Air.” American Standards and Testing Methods (ASTM) International.
ASHRAE 1997. ASHRAE Standard 129. “Test method for air change effectiveness.” American Society of Heating, Refrigerating and Air-conditioning Engineers, Inc., Atlanta, Georgia.
CSA, 2009. CSA Method 22.2 No. 187 “Electrostatic air cleaners.” 3rd Edn, Mar. 2009. Canadian Standards Agency.
Chen W, Zhang JS, and Zhang Z, 2005. “Performance of air cleaners for removing multiple volatile organic compounds in indoor air”. ASHRAE Transactions, 111, 1, 1101-1114.
Daisey JM, Hodgson AT, 1989. “Initial efficiencies of air cleaners for the removal of nitrogen dioxide and volatile organic compounds” Atmospheric Environment, 23, 9, 1885-1892.
EPA, 2000. USEPA Energy STAR program. United States Environmental Protection Agency’s ENERGY STAR voluntary product labeling program. http://www.energystar.gov/index.cfm?c=products.pr_find_es_products
EPA, 1999. EPA Method TO-11A “Determination of Formaldehyde in Ambient Air Using Adsorbent Cartridge Followed by High Performance Liquid Chromatography (HPLC) [Active Sampling Methodology] (EPA/625/R-96/010b, 1999)
Gilbert NL, Gauvin D, Guay M, Héroux M-E, Dupuis G, Legris M, Chan CC, Dietz RN, Lévesque B. 2006. “Housing characteristics and indoor concentrations of nitrogen dioxide and formaldehyde in Quebec City, Canada.” Environmental Research, 102, 1, 1-8.
Gilbert NL, Guay M, Miller JD, Judek S, Chan CC, Dales RE. 2005. “Levels and determinants of formaldehyde, acetaldehyde, and acrolein in residential indoor air in Prince Edward Island, Canada.” Environmental Research, 99, 1, 11-17.
Health Canada, 2000. “Exposure Guidelines for Residential Indoor Air Quality: Ozone.” Ottawa: Her Majesty the Queen in Right of Canada. ISO, 1999. ISO Method. 3741:1999 Acoustics - Determination of sound power levels of noise sources using sound pressure - Precision methods for reverberation rooms. International Standards Organization.
JEM, 1995. JEM 1467 “The household air cleaner.” The Japan Electrical Manufacturers’ Association.
JIS, 2007. JIS C 9615 “Air cleaners” Japanese Industrial Standards Committee
Otson O, Fellin P, Tran Q. 1994. “VOCs in representative Canadian residences”. Atmospheric Environment, 28, 22, 3563-3569.
Sanchez MC, Brown RE, Webber C, Homan GK. 2008. “Savings estimates for the United States Environmental Protection Agency's ENERGY STAR voluntary product labeling program” Energy Policy, 36, 6, 2098-2108. UL, 2007. UL Method 867. “Electrostatic air cleaners” 4th Edn, 2000, revised 2007. Underwriters Laboratories.
Page | 32
Waring M.S, Siegel J.A. and Corsi R.L. 2008. “Ultrafine particle removal and generation by portable air cleaners.” Atmospheric Environment, 42, 5003-5014.