Publisher’s version / Version de l'éditeur:
Vous avez des questions? Nous pouvons vous aider. Pour communiquer directement avec un auteur, consultez la première page de la revue dans laquelle son article a été publié afin de trouver ses coordonnées. Si vous n’arrivez pas à les repérer, communiquez avec nous à PublicationsArchive-ArchivesPublications@nrc-cnrc.gc.ca.
Questions? Contact the NRC Publications Archive team at
PublicationsArchive-ArchivesPublications@nrc-cnrc.gc.ca. If you wish to email the authors directly, please see the first page of the publication for their contact information.
https://publications-cnrc.canada.ca/fra/droits
L’accès à ce site Web et l’utilisation de son contenu sont assujettis aux conditions présentées dans le site LISEZ CES CONDITIONS ATTENTIVEMENT AVANT D’UTILISER CE SITE WEB.
Proceedings of the 13th Canadian conference on Building Science and
Technology, Winnipeg, MB, Canada, 10–13 May, 2011-05-10
READ THESE TERMS AND CONDITIONS CAREFULLY BEFORE USING THIS WEBSITE.
https://nrc-publications.canada.ca/eng/copyright
NRC Publications Archive Record / Notice des Archives des publications du CNRC :
https://nrc-publications.canada.ca/eng/view/object/?id=6b1eef2c-2111-4ba5-a18a-306213a984b0 https://publications-cnrc.canada.ca/fra/voir/objet/?id=6b1eef2c-2111-4ba5-a18a-306213a984b0
NRC Publications Archive
Archives des publications du CNRC
This publication could be one of several versions: author’s original, accepted manuscript or the publisher’s version. / La version de cette publication peut être l’une des suivantes : la version prépublication de l’auteur, la version acceptée du manuscrit ou la version de l’éditeur.
Access and use of this website and the material on it are subject to the Terms and Conditions set forth at
Field thermal mass performance of an insulating concrete form (ICF)
wall
Armstrong, M. M.; Saber, H. H.; Maref, W.; Rousseau, M. Z.; Ganapathy, G.;
Swinton, M. C.
http://www.nrc-cnrc.gc.ca/irc
Fie ld t he rm a l m a ss pe rform a nc e of a n insula t ing c onc re t e form (I CF)
w a ll
N R C C - 5 4 4 2 7
A r m s t r o n g , M . M . ; S a b e r , H . H . ; M a r e f , W . ;
R o u s s e a u , M . Z . ; G a n a p a t h y , G . ; S w i n t o n , M . C .
M a y 2 0 1 1
A version of this document is published in / Une version de ce document se trouve dans:
13th Canadian Conference on Building Science and Technology, Winnipeg,
Manitoba, Canada, May 10-13, 2011, pp. 1-12
The material in this document is covered by the provisions of the Copyright Act, by Canadian laws, policies, regulations and international agreements. Such provisions serve to identify the information source and, in specific instances, to prohibit reproduction of materials without written permission. For more information visit http://laws.justice.gc.ca/en/showtdm/cs/C-42
Les renseignements dans ce document sont protégés par la Loi sur le droit d'auteur, par les lois, les politiques et les règlements du Canada et des accords internationaux. Ces dispositions permettent d'identifier la source de l'information et, dans certains cas, d'interdire la copie de documents sans permission écrite. Pour obtenir de plus amples renseignements : http://lois.justice.gc.ca/fr/showtdm/cs/C-42
FIELD THERMAL MASS PERFORMANCE OF AN INSULATING
CONCRETE FORM (ICF) WALL
M.M. Armstrong, H.H. Saber, W. Maref, M.Z. Rousseau, G. Ganapathy and M.C. Swinton
National Research Council Canada Ottawa, Ontario, Canada
ABSTRACT
Field monitoring of the dynamic heat transmission characteristics through Insulating Concrete Form (ICF) wall assemblies was undertaken in 2009-10 at National Research Council Canada’s Institute for Research in Construction’s (NRC-IRC) Field Exposure of Walls Facility (FEWF). The scope of work included the design of the experiments, the installation of test specimens, the commissioning of the instrumentation, the operation of the test facility, the monitoring, data collection & analysis. This research evaluated the dynamic heat transmission characteristics through an ICF wall assembly in FEWF for a one year cycle of exposure to outdoor natural weathering conditions. The monitored data confirmed that the concrete adds very little to the overall R-value of the wall assembly under steady-state conditions. During the transient conditions, the data showed that the concrete played a significant role in tempering heat loss to the exterior. The thermal mass of the concrete was shown to reduce the peak heat flux through the assembly during cold weather. This research is one of a series of projects that highlight direct and indirect impacts of thermal performance of the building Envelope technologies in houses. This paper provides valuable experimental data to be used for energy simulation models. This research is on-going. Future work including the cooling season performance and simulation results will be presented in later publications.
INTRODUCTION
Increasingly home owners and builders are turning towards a variety of construction methods to reduce energy costs due to the rising fuel economy. While Insulating Concrete Form (ICF) technology dates back to the late 1960s in Europe, ICF construction has only caught on in North America for use in residential and commercial construction over the last 25 years (Hersh Servo AG, 2010). Generally modern ICFs consist of stackable formwork made of polystyrene, which is filled on site with concrete, and then remains in place to provide permanent insulation. ICF technology offers the potential to deliver good energy performance resulting from a combination of good airtightness, high R-value from the insulation and passive thermal management from the mass of the sandwiched concrete layer. With the growing presence of ICF construction in the market, it is important to gain an understanding of its actual performance in the field, and the role played by the thermal mass of the concrete in regulating heat loss from the interior.
This paper presents findings generated from a research project undertaken by NRC-IRC in collaboration with other government departments and the industry to understand and quantify the effect of thermal mass of the concrete in the ICF wall systems.
13th Canadian Conference on Building Science and Technology - Winnipeg, Canada, 2011
13th Canadian Conference on Building Science and Technology - Winnipeg, Canada, 2011
Page 2
BACKGROUND
To the authors’ knowledge, few research projects have been performed in North America to study the effect of the thermal mass of concrete in ICFs. In 2006, a project was conducted for CMHC and the Ready Mix Concrete Associate of Ontario to study the performance of a 7-storey insulating concrete form multi-residential building in Waterloo, Canada (Enermodal, 2006). Temperatures through the wall assembly were monitored at eight locations from December 1st, 2005 to February 26th, 2006. The project reported little contribution of the concrete to the steady-state R-value. During transient conditions, heat storage effects were reported. While the concrete never supplied heat to the interior during the winter monitoring period, results showed that concrete did temper heat loss to the exterior during cold periods.
In 2001, the Portland Cement Association conducted a modeling study of the energy use of single-family houses with various exterior walls (Gajda, 2001). The study examined the performance of eleven different types of exterior walls in 25 North American locations to determine the expected differences in energy use. This study included flat panel ICFs similar to those explored in this paper: 6 in. concrete sandwiched between two panels of 2 in. expanded polystyrene (EPS) foam. DOE 2.1software was used to model a home, and the only differences for a given location were the exterior wall type and the capacity of the HVAC system. The study showed that houses with flat panel ICFs had lower heating and cooling costs when compared to walls with code matching light construction, and contributed to additional savings through a reduction in the required heating and cooling system capacity.
OBJECTIVES
The National Research Council of Canada’s Institute for Research in Construction (NRC-IRC) in collaboration with Canada Mortgage and Housing Corporation (CMHC) and Natural Resources Canada (NRCan) evaluated the dynamic heat transmission characteristics through two Insulating Concrete Form (ICF) wall assemblies in the NRC-IRC Field Exposure of Walls (FEWF) test facility for a one year cycle 2009-2010 of exposure to outdoor natural weathering conditions. The ICF specimens were provided by an industry partner – the Ready Mixed Concrete Association of Ontario (RCMAO). The scope of work included the design of the experiments, the installation of test specimens, the commissioning of the instrumentation, the operation of the test facility, the monitoring, data collection & analysis to determine the field energy performance of the ICF system.
METHODOLOGY
This paper presents the measured results from Wall 1 of two identical ICF wall specimens that were installed side by side in the FEWF test bay on the NRC Campus in Ottawa, Canada. The walls were located on the first floor of a two storey facility, with West exposure (Figure 1). A chamber provided controlled indoor conditions (~21°C, 30% humidity), and the walls were exposed to naturally occurring Ottawa climate (with an average of 4602 heating degree days <18°C (Environment Canada, 2010). Data was collected at 15-minute intervals from October 13th, 2009 to April 30th, 2010.
CONSTRUCTION
The ICF forms were assembled and thermocouples were installed on the interior of the form prior to pouring the concrete. The concrete was poured into the forms July 28th 2009, with the forms sitting outside beside the FEWF test bay. The specimens were allowed to cure outdoors for 28 days before being lifted into place by forklift on August 25th 2009.
The ICF wall specimens measured 1828 x 1676 mm (71 15/16 x 66 in.) and featured 152 mm (6 in.) thick concrete surrounded by 64 mm (2.5 in.) of EPS foam on all sides, and 51 mm (2 in.) of EPS foam on the base (Figure 2A). The ICF specimens were separated from surrounding construction by an additional 102 mm (4 in.) of XPS foam. 204 mm (6 in.) wide chases were situated on either end of the test bay and between walls to provide space for running wires. The completed chases were filled with batt insulation. The finished walls included an interior drywall finish and exterior vinyl siding.
FIGURE 1. VIEW OF THE ICF WALL SPECIMENS IN THE FIELD EXPOSURE OF WALL FACILITY BEFORE INSTALLATION OF SIDING
13th Canadian Conference on Building Science and Technology - Winnipeg, Canada, 2011
Page 3
FIGURE 2. A) ICF WALL VERTICAL CROSS SECTION, B) ELEVATION VIEW FROM THE INTERIOR
INSTRUMENTATION
Instrumentation was located at four layers through the wall, as shown in Figure 2A: 1) between the lap siding and the exterior EPS foam layer of the ICF; 2) on the face of the concrete behind the exterior EPS foam layer; 3) on the face of the concrete behind the interior EPS foam layer; and 4) between the drywall
PVC lap siding attached to ICF ICF: 2.5 in. (64 mm) EPS foam 6 in. (152 mm) concrete 2.5 in. (64 mm) EPS foam Drywall 0.5 in. (13 mm) Insulated and sealed space (after installation)
0.5 in. (13 mm) dia. threaded rod, cast in place
Steel plate bolted to two rods for forklift Steel plate and bolts removed from final installation
4 in. (102 mm) XPS foam to separate ICF from other elements
711516 in [1828 mm] 4 in [102 mm] 66 in [1676 mm] 9 in [229 mm] 212 in [64 mm] 2 in [51 mm] 4 in [102 mm] 1 2 3 4
B
A
Location of instrumentationand the interior EPS foam layer of the ICF. At layers 2 and 3, two thermocouples were installed prior to pouring the concrete at each of the five instrumentation locations shown in Figure 2B, for a total of 10 thermocouples per layer. At layers 1 and 4, a total of four thermocouples were installed at all instrumentation locations except the bottom right location. The average temperature of each layer was used in this analysis and was obtained by averaging the readings of all thermocouples on each layer.
In each of the four layers, a single heat flux transducer was located at the central instrumentation location. This paper refers to the heat flux measured at location 2 (HF2) and location 3 (HF3) in the analysis. During the first half of the experiment, HF2 and HF3 were positioned at the interface of the foam and the concrete. This proved a complex task due to the ridges on the interior side of the foam. To provide a flat surface for the heat flux transducers so that the measured heat flux component was perpendicular to the surface, sections of foam were removed prior to pouring the concrete. The ridges of the removed section were filled in with concrete and cured (Figure 3 A&B) before the foam section was put back into position. However, this meant that the heat flux transducer was not exposed to a uniform material – but rather alternating lines of foam and concrete on one side. This resulted in erroneous readings, based on those expected from the nominal R-value of the system. A simulation tool was needed to interpret the erroneous results and try to improve the experiment design by repositioning the heat flux transducers at critical locations. A model was used to re-design and correct the location of the HFTs, and benchmarked later on. Numerical simulations were conducted to investigate the differences in the predicted heat fluxes at different locations in the foam (at the outer surface of the foam, middle of the foam and foam-concrete interface). The numerical results showed that the differences caused by location were very small, and were approximately within the uncertainties of the heat flux transducers (Saber, 2010). These small differences were due the small thermal mass of the foam. Consequently, in order to expose the heat flux transducers to a uniform material, HF3 was repositioned on January 14th between two blocks of foam (Figure 3 C&D). The same correction was made to HF2 on January 29th. Thereafter, the predicted results from the simulation could be compared directly with the measured data. Temperature and heat flux data was sampled every minute, and the average was stored every 15-minutes.
13th Canadian Conference on Building Science and Technology - Winnipeg, Canada, 2011
Page 4
A B C D
FIGURE 3. A&B REMOVED SECTION OF EPS FOAM FOR HEAT FLUX TRANSDUCER INSTALLATION, C&D HEAT FLUX TRANSDUCER REPOSITIONED IN THE MIDDLE OF THE EPS
RESULTS TEMPERATURE
The measured temperature at the exterior and the interior surface of the ICF (layers 1 and 4), as well as the average temperature of the concrete (calculated by taking an average of all the thermocouples on the interior and exterior surface of the concrete – at layers 2 and 3) are plotted in Figure 4.
The air temperature in the room adjacent to the ICF was controlled at 21°C throughout the experiment, resulting in the interior surface of the ICF remaining around 17 to 18°C for most of the winter. In March and April, solar gains to the interior of the research house caused room temperatures to rise, and subsequently interior temperature increased.
The exterior of the ICF was also affected by solar gains. The exterior of the ICF, behind the siding on the West façade (layer 1), experienced temperature peaks on sunny afternoons. As a result, the ICF was exposed to exterior temperatures ranging from -22.2°C up to 35.1°C. The average concrete temperature began at 15.5°C, dropped to 2.6°C December 19th at its coldest, and reached a peak of 20.4°C on April 5th.
‐30 ‐20 ‐10 0 10 20 30 40 50 9‐ Oc t‐ 09 23 ‐Oc t‐ 09 6‐ No v‐ 09 20 ‐No v‐ 09 4‐ De c‐ 09 18 ‐De c‐ 09 1‐ Ja n‐ 10 15 ‐Ja n‐ 10 29 ‐Ja n‐ 10 12 ‐Feb ‐10 26 ‐Feb ‐10 12 ‐Ma r‐ 10 26 ‐Ma r‐ 10 9‐ Ap r‐ 10 23 ‐Ap r‐ 10 Te m p er a tur e, °C Wall 1 ‐ Interior, Exterior and Concrete Temperature Temperature at interior surface of ICF Average temperature of concrete Temperature at exterior surface of ICF INT. EXT.
FIGURE 4. MEASURED 15-MINUTE TEMPERATURE DATA
HEAT FLUX
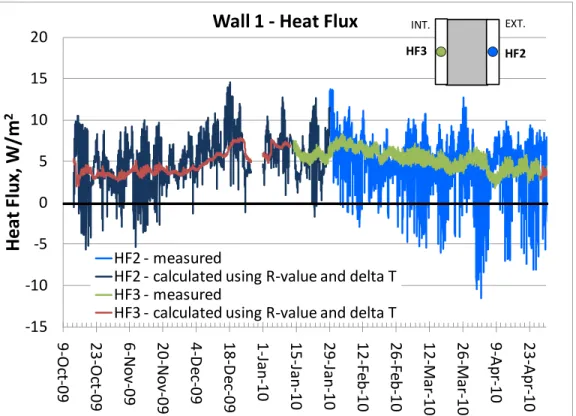
The measured heat flux data (15-minute resolution) is presented in Figure 5. Heat flux flowing from the interior to the exterior side of the wall is considered positive. Using the measured heat flux and the ΔT across the foam insulation from the second half of the experiment, the average R-value of the foam was calculated using Equation 1: RSI 1.73 σ=0.09 (R 9.81, σ=0.52) for the interior foam panel of the ICF, and RSI 1.76 σ=5.43 (R 10.0 σ=30.8) for the exterior foam panel of the ICF. Both R-values fall within the expected range of RSI 1.72 to 1.92 (R 9.74 to 10.92) based on ASHRAE’s published values of thermal conductivity, 0.033 to 0.037 W/(m.K) (ASHRAE, 2009), and the thickness of the EPS, 64 mm (2.5 in.). The R-value of the exterior foam panel has a very high standard deviation due to large fluctuation in heat flux, and periodic low ΔT across the exterior foam leading to reduced accuracy. Since both foams panels are identical, RSI 1.73 (R9.81) (the average measured value from the interior foam panel) was assumed for both the exterior and interior insulation, and combined with measured ΔT across the interior and exterior insulation to predict the heat flux at location 2 and 3 for the first half of the experiment. This is referred to as “calculated” heat flux in Figure 5.
13th Canadian Conference on Building Science and Technology - Winnipeg, Canada, 2011
‐15 ‐10 ‐5 0 5 10 15 20 9‐ Oc t‐ 09 23 ‐Oc t‐ 09 6‐ No v‐ 09 20 ‐No v‐ 09 4‐ De c‐ 09 18 ‐De c‐ 09 1‐ Ja n‐ 10 15 ‐Ja n‐ 10 29 ‐Ja n‐ 10 12 ‐Feb ‐10 26 ‐Feb ‐10 12 ‐Ma r‐ 10 26 ‐Ma r‐ 10 9‐ Ap r‐ 10 23 ‐Ap r‐ 10
Hea
t
Fl
u
x
,
W/
m
2Wall 1 ‐ Heat Flux
HF2 ‐ measured HF2 ‐ calculated using R‐value and delta T HF3 ‐ measured HF3 ‐ calculated using R‐value and delta T INT. EXT. HF3 HF2FIGURE 5. HEAT FLUX AT THE INTERIOR AND THE EXTERIOR OF THE ICF (15-MINUTE DATA)
The heat flux at the exterior of the ICF followed daily temperature swings caused by outdoor air temperature and solar effects in the afternoon, and ranged from 14.5 W/m2 to -11.5 W/m2. By contrast, the heat flux from the interior side of the ICF did not respond to the daily fluctuations in temperature, but rather followed the general temperature trend. The concrete mass provided a buffering effect. As a result, the heat flux from the interior ranged from 1.8 W/m2 to 8.3 W/m2, always flowing from interior to exterior during the experiment period.
PSEUDO-STEADY STATE R-VALUE
13th Canadian Conference on Building Science and Technology - Winnipeg, Canada, 2011
Page 6
On occasions where the heat flux on the exterior and the heat flux on the interior of the ICF are equal, the wall is considered in steady state condition. Using the measured data (ΔT across the assembly and the heat fluxes) and Equation 1, the steady state R-value was calculated for all occasions where the absolute difference in measured heat fluxes (HF3-HF2) was less than 0.3 W/m2. The result for Wall 1 is plotted in Figure 6. The average steady state RSI is 3.77 m2.K/W, σ = 0.15 (R 21.4, σ = 0.84). Note that this is an in-situ field result measured during temperature transition, and is thus referred to as “pseudo-steady state”.
(1) Where: Tin: interior temperature in °C
Text: exterior temperature in °C
0.0 0.5 1.0 1.5 2.0 2.5 3.0 3.5 4.0 4.5 5.0 16 ‐Ja n‐ 10 30 ‐Ja n‐ 10 13 ‐Fe b‐ 10 27 ‐Fe b‐ 10 13 ‐Mar ‐10 27 ‐Mar ‐10 10 ‐Ap r‐ 10 24 ‐Ap r‐ 10 8‐ Ma y‐ 10
RS
I,
m
2.K
/W
Wall 1 ‐ Steady State R‐value
Average RSI: 3.77 m
2.K/W,
σ=0.15
(R 21.4 ft
2.°F.h/Btu,
σ=0.84)
FIGURE 6. STEADY STATE R-VALUE FOR THE ICF
HEAT ABSORBED AND RELEASED BY THE CONCRETE
13th Canadian Conference on Building Science and Technology - Winnipeg, Canada, 2011
Page 7
Using the measured data, the heat absorbed and released by the concrete during each 15 minute timestep can be determined in two ways: using the difference in measured heat flux (Equation 2), and using the change in the average temperature of the concrete (Equation 3) – obtained by averaging the temperatures at the exterior and interior surface of the concrete (layers 2 and 3).
(2)
Where: Q: total heat, Wh
A: interior surface area of concrete, 2.76 m2 t: timestep, 0.25 h
qin: heat flux at the interior, W/m2
qext: heat flux at the exterior, W/m2
(3)
Where: Q: total heat, Wh
ρ : density of concrete, 2350 kg/m3 V: volume of concrete, 0.42 m3
Cp: specific heat capacity of concrete, 0.244 Wh/kg°C
(880 J/kgK)
Ti: Average temperature of concrete at current time, °C
Ti-1: Average temperature of concrete at previous time, °C
The total daily heat absorbed (+ve) or released (-ve) by the concrete in the ICF is plotted in Figure 7. Both methods of calculating the heat absorbed and released give an approximately similar result. Small differences are present, and may be due to the assumed properties for the concrete (Cp=880 J/kgK,
ρ=2350 kg/m3), or the accuracy of the heat flux transducers. The similarity of the two trends gives
‐600 ‐400 ‐200 0 200 400 600 9‐ Oc t‐ 09 23 ‐Oc t‐ 09 6‐ No v‐ 09 20 ‐Nov ‐09 4‐ De c‐ 09 18 ‐De c‐ 09 1‐ Ja n‐ 10 15 ‐Ja n‐ 10 29 ‐Ja n‐ 10 12 ‐Feb ‐10 26 ‐Feb ‐10 12 ‐Mar ‐10 26 ‐Mar ‐10 9‐ Ap r‐ 10 23 ‐Ap r‐ 10 He a t ab so rb e d (+v e ) or Re le as e d (‐ ve ) by th e co n cr e te , Wh/ d ay Wall 1 ‐ Heat absorbed and released by concrete Calculation based on change in concrete temperature and mass Calculation based on measured heat flux Calculation based on calculated heat flux
FIGURE 7. DAILY HEAT ABSORBED AND RELEASED BY THE CONCRETE
IMPACT OF MASS ON HEAT LOSS
The heat flux at the interior of the ICF, leaving the interior of the home, is of greatest interest since it has an impact on heating system requirements. For this reason, the performance of the ICF was compared with the theoretical performance of the same wall without mass effect. Heat flux without mass (due to conduction alone), was determined using Equation 1, the steady state R-value (RSI 3.77 +4% [R 21.4 +4%]) and the measured average temperatures at the exterior and interior surface of the ICF throughout the experiment. While the wall itself may have some small impact on these measured temperatures, this impact was neglected.
‐6 ‐4 ‐2 0 2 4 6 8 10 12 9‐ Oc t‐ 09 23 ‐Oc t‐ 09 6‐ No v‐ 09 20 ‐No v‐ 09 4‐ De c‐ 09 18 ‐De c‐ 09 1‐ Ja n‐ 10 15 ‐Ja n‐ 10 29 ‐Ja n‐ 10 12 ‐Fe b‐ 10 26 ‐Fe b‐ 10 12 ‐Mar ‐10 26 ‐Mar ‐10 9‐ Ap r‐ 10 23 ‐Ap r‐ 10 Hea t Fl u x , W/ m 2 Wall 1 ‐ Heat flux at the interior surface of the ICF, with and without mass Calculated Heat flux with no mass ICF measured heat flux ICF calculated heat flux INT. EXT.
FIGURE 8. HEAT FLUX AT THE INTERIOR SURFACE OF THE ICF, WITH AND WITHOUT MASS (15-MINUTE TIMESTEP)
13th Canadian Conference on Building Science and Technology - Winnipeg, Canada, 2011
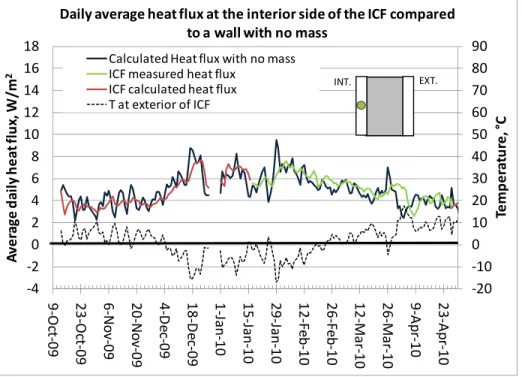
The resulting comparison of the wall with and without mass is shown in Figure 8. Without thermal mass, the heat flux varies significantly with change in outdoor temperature, following daily swings. With the effect of thermal mass, however, the heat flux varies slightly during each day. While the measured 15-minute peak in heat flux for the ICF was 8.3 W/m2, the peak 15-minute heat flux without mass was higher at 10.3 W/m2. ‐20 ‐10 0 10 20 30 40 50 60 70 80 90 ‐4 ‐2 0 2 4 6 8 10 12 14 16 18 9‐ Oc t‐ 09 23 ‐Oc t‐ 09 6‐ Nov ‐09 20 ‐Nov ‐09 4‐ De c‐ 09 18 ‐De c‐ 09 1‐ Ja n‐ 10 15 ‐Ja n‐ 10 29 ‐Ja n‐ 10 12 ‐Feb ‐10 26 ‐Feb ‐10 12 ‐Ma r‐ 10 26 ‐Ma r‐ 10 9‐ Ap r‐ 10 23 ‐Ap r‐ 10 Te m p er a tu re, °C Av e ra g e da il y he a t fl ux , W/ m 2 Daily average heat flux at the interior side of the ICF compared to a wall with no mass Calculated Heat flux with no mass ICF measured heat flux ICF calculated heat flux T at exterior of ICF INT. EXT.
FIGURE 9. AVERAGE DAILY HEAT FLUX AT THE INTERIOR SURFACE OF THE ICF COMPARED TO A WALL WITH NO MASS
The average daily heat flux at the interior of the ICF is plotted alongside average daily temperature at the exterior of the ICF in Figure 9. The average daily data gives a clear view of the trends with and without mass. Mass causes the ICF to respond more slowly to changes in exterior temperature. Between January 25th and January 29th the average outdoor temperature plummeted from 3.4°C to -17°C. During this time period, the expected heat flux through the wall with no mass increased proportionally from 3.9 to 9.5 W/m2, while the measured heat flux through the ICF wall slowly increased, peaking five days later on February 3rd at 7.6 W/m2. By the same token, the ICF wall is slow to respond to warming. The average outdoor temperature rose to 17°C on April 3rd, reducing the expected heat flux through the wall with no mass to 2.4 W/m2 while the measured heat flux through the ICF was still high at 5.2 W/m2. Five days later, the heat flux through the ICF dropped to 2.6 W/m2. Due to mass effect, the ICF wall causes the room to lose less heat when the general trend in exterior temperature is cooling, and more heat when temperature trend is warming.
The impact of mass can be evaluated on a daily basis. Heat loss through the ICF specimen during each measured 15 minute period was calculated using Equation 4 for both the measured performance of the ICF and the expected performance of the ICF without mass. The 15-minute heat loss data was then aggregated into daily total heat loss, and then averaged over each month. The average daily heat loss through the ICF specimen is presented by month in Figure 10 and Table 1.
13th Canadian Conference on Building Science and Technology - Winnipeg, Canada, 2011
13th Canadian Conference on Building Science and Technology - Winnipeg, Canada, 2011
Page 10
(4) Where: Q: total heat, Wh
A: interior surface area of concrete, 2.76 m2 t: timestep, 0.25 h
qin: heat flux at the interior, W/m2
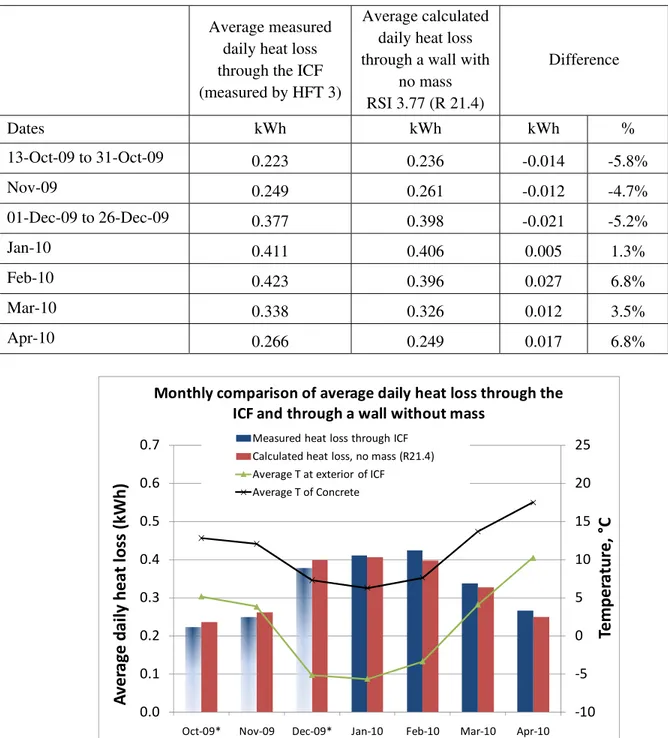
TABLE 1 - MONTHLY COMPARISON OF HEAT LOSS THROUGH THE ICF AND HEAT LOSS OF A WALL WITHOUT MASS
Average measured daily heat loss through the ICF (measured by HFT 3)
Average calculated daily heat loss through a wall with
no mass RSI 3.77 (R 21.4) Difference Dates kWh kWh kWh % 13-Oct-09 to 31-Oct-09 0.223 0.236 -0.014 -5.8% Nov-09 0.249 0.261 -0.012 -4.7% 01-Dec-09 to 26-Dec-09 0.377 0.398 -0.021 -5.2% Jan-10 0.411 0.406 0.005 1.3% Feb-10 0.423 0.396 0.027 6.8% Mar-10 0.338 0.326 0.012 3.5% Apr-10 0.266 0.249 0.017 6.8% ‐10 ‐5 0 5 10 15 20 25 0.0 0.1 0.2 0.3 0.4 0.5 0.6 0.7
Oct‐09* Nov‐09 Dec‐09* Jan‐10 Feb‐10 Mar‐10 Apr‐10
Te
mper
a
tur
e,
°C
Av
e
ra
g
e
da
il
y
hea
t
lo
ss
(k
Wh)
Monthly comparison of average daily heat loss through the ICF and through a wall without mass Measured heat loss through ICF Calculated heat loss, no mass (R21.4) Average T at exterior of ICF Average T of Concrete
FIGURE 10: MONTHLY COMPARISON OF HEAT LOSS THROUGH THE ICF, AND HEAT LOSS OF A WALL WITHOUT MASS *Incomplete months: 19 days in Oct-09, 26 days in Dec-09
13th Canadian Conference on Building Science and Technology - Winnipeg, Canada, 2011
Page 11
From October to December, the exterior temperature dropped, and so did the average temperature of the concrete. As a result, the average heat loss per day was ~5% lower due to the mass of the ICF. In January, there was only a small difference (1.3%) between the performance of the ICF and the wall without mass. From February to May, the average exterior temperature and the average temperature of the concrete increased. During this warming trend, the average heat loss per day was greater due to the mass of the ICF.
CONCLUSIONS
The study showed the importance of the location of the sensors and especially the heat flux transducers (HFTs). Each side of the HFT should be in contact with homogeneous material. Once the positioning of the sensors was corrected, the heat flux transducers provided a good means of evaluating the performance of an ICF wall specimen. With a known R-value of the insulation in the ICF, thermocouples could also be used as an inexpensive alternative for determining heat flux analysis – this method was used to effectively predict heat flux in the first half of the experiment.
The R-value measurements of the assembly and the EPS reported in this paper were based on in-situ field measurements. For a true assessment of the steady state thermal performance of the assembly, a guarded hot box test must be performed following ASTM-C1363 (ASTM, 2005). To obtain the true steady state R-value of the EPS, thermal conductivity must be measured using a standard heat flow meter apparatus and the standard test method ASTM C518 (ASTM, 2004). Subsequent to the analytical analysis reported in this paper, the thermal conductivity of the EPS was measured to support modeling activities, as reported by Saber et al, 2010. The exact measurement of the ICF specimen’s EPS was required, since the thermal conductivity of EPS can range from 0.037 – 0.033 W/(m.K) (ASHRAE, 2009).
Based on in-situ measurements, the pseudo-steady state R-value of the ICF in this study was RSI 3.77 (R21.4). The steady-state R-value does not capture the dynamic performance of the wall and the impact of the mass of the concrete in the ICF.
During transient conditions, the data demonstrated that the concrete significantly moderated heat loss from the interior, storing the heat originating from the interior and later releasing it when there was a dip in outdoor temperature. In doing so, the ICF wall was shown to reduce the 15-minute peak in heat flux leaving the room. The measured peak in heat flux was 8.3 W/ m2, below the expected peak in a wall without mass of the same R-value: 10.3 W/m2. Thus, ICF walls have the potential to reduce the peak heating requirement of the furnace, and may have consequences for the sizing of mechanical equipment. Seasonal storage effects were shown through the comparison of the measured ICF performance with the expected performance without thermal mass effect. In the fall, the ICF is expected to reduce daily heat from the interior by ~5%, due to the thermal mass slowly cooling down. In January there was little expected difference caused by the thermal mass (~1%). In late winter and early spring, the thermal mass slowly heated up and caused more heat to be lost from the interior: an expected increase in heat loss of 6.8% in February, 3.5% in March, and 6.8% in April.
This analysis involved comparing the measured heat losses/gain through an ICF wall to the expected heat losses/gains through a wall with no mass effect and an identical steady state R-value (RSI 3.77 [R21.4]). This “no mass” wall is purely theoretical, but could be representative of light construction.
This research is on-going. Future work including the cooling season performance will be presented in later publications. The experimental data in this paper is being provided for the use of refining energy simulation models. The results from benchmarking a detailed 3 dimensional model and simulation results were presented at the Buildings XI conference (Saber, 2010).
ACKNOWLEDGEMENTS
The authors wish to thank Anil Parekh at Natural Resources Canada (NRCan) and Silvio Plescia at Canada Mortgage and Housing Corporation (CMHC) for providing guidance and contributing funding for this project. Funding from NRC has enabled NRC-IRC to build, operate and maintain a state-of-the-art Field Exposure of Walls facility. Our thanks are also extended to Ross Monsour at Ready Mix Concrete Association of Ontario (RMCAO) for his contribution in providing the test specimens, and NRC-IRC colleague Mike Nicholls for his precious technical contribution.
REFERENCES
ASHRAE. 2009. 2009 ASHRAE Handbook –Fundamentals (SI). 26.5. Atlanta: American Society of Heating, Refrigerating, and Air-Conditioning Engineers Inc.
ASTM 2004. ASTM C 518 Steady-State Thermal Transmission Properties by Means of the Heat Flow
Meter Apparatus, Section 4, Volume 04.06, Philadelphia: American Society for Testing and Materials.
ASTM 2005. ASTM C1363 Standard Test Method for Thermal Performance of Building Materials and
Envelope Assemblies by Means of a Hot Box Apparatus, Philadelphia: American Society for Testing and
Materials.
Enermodal. 2006. Monitored Performance of an Insulating Concrete Form Multi-Unit Residential
Building. Final Report. Canada Mortgage and Housing Corporation. Canada. PP 1-45.
Environment Canada, 2010. Canadian Climate Normals 1971-2000, Ottawa MacDonald Cartier
International Airport [online]. Available from: http://www.climate.weatheroffice.gc.ca [accessed 18
March 2010]
Gajda, J., 2001. Energy Use of Single-Family Houses with Various Exterior Walls. Research & Development Information Report. Portland Cement Association and Concrete Foundations Association. PCA CD026. PP 1-46.
Hersh Servo AG. 2010. Insulated Concrete Forms [online]. Available from: http://www.hirsch-gruppe.com [accessed 29 April 2010]
Saber, H.H., et al. 2010. Benchmarking Three-Dimensional Thermal Model against Field Measurement on the Thermal Response of an Insulating Concrete Form (ICF) Wall in Cold Climate. Proceedings of
Thermal Performance of the Exterior Envelopes of Whole Buildings XI International Conference.
Clearwater, Florida. December 5-9, 2010.
13th Canadian Conference on Building Science and Technology - Winnipeg, Canada, 2011