Publisher’s version / Version de l'éditeur:
Vous avez des questions? Nous pouvons vous aider. Pour communiquer directement avec un auteur, consultez la première page de la revue dans laquelle son article a été publié afin de trouver ses coordonnées. Si vous n’arrivez Questions? Contact the NRC Publications Archive team at
PublicationsArchive-ArchivesPublications@nrc-cnrc.gc.ca. If you wish to email the authors directly, please see the first page of the publication for their contact information.
https://publications-cnrc.canada.ca/fra/droits
L’accès à ce site Web et l’utilisation de son contenu sont assujettis aux conditions présentées dans le site LISEZ CES CONDITIONS ATTENTIVEMENT AVANT D’UTILISER CE SITE WEB.
Client Report (National Research Council of Canada. Institute for Research in
Construction), 2011-03-23
READ THESE TERMS AND CONDITIONS CAREFULLY BEFORE USING THIS WEBSITE.
https://nrc-publications.canada.ca/eng/copyright
NRC Publications Archive Record / Notice des Archives des publications du CNRC : https://nrc-publications.canada.ca/eng/view/object/?id=400b4217-7269-40df-b0dc-60a86ec2c8e3 https://publications-cnrc.canada.ca/fra/voir/objet/?id=400b4217-7269-40df-b0dc-60a86ec2c8e3
NRC Publications Archive
Archives des publications du CNRC
For the publisher’s version, please access the DOI link below./ Pour consulter la version de l’éditeur, utilisez le lien DOI ci-dessous.
https://doi.org/10.4224/20373827
Access and use of this website and the material on it are subject to the Terms and Conditions set forth at
Assessing the Impact of Cold Climate on Basement Temperatures
Assessing the Impact of Cold Climate on Basement Temperatures
Contract: B-6042
Report B-6042.2
Armstrong M.M., Ruest, K., Swinton, M.C.
FINAL REPORT
The Canadian Centre for Housing Technology (CCHT)
Built in 1998, the Canadian Centre for Housing Technology (CCHT) is jointly operated by the National Research Council, Natural Resources Canada, and Canada Mortgage and Housing Corporation. CCHT's mission is to accelerate the development of new technologies and their acceptance in the marketplace.
The Canadian Centre for Housing Technology features twin research houses to evaluate the whole-house performance of new technologies in side-by-side testing. The twin houses offer an intensively monitored real-world environment with simulated occupancy to assess the performance of the residential energy technologies in secure premises. This facility was designed to provide a stepping-stone for manufacturers and developers to test innovative technologies prior to full field trials in occupied houses.
As well, CCHT has an information centre, the InfoCentre, which features a showroom, high-tech meeting room, and the CMHC award winning FlexHouse™ design, shown at CCHT as a demo home. The InfoCentre also features functioning state-of-the art equipment, and demo solar photovoltaic panels.
Acknowledgements
The funding for this project was provided by Canada Mortgage and Housing Corporation (CMHC). Thank you for making this project possible and enabling us to mine the valuable data that has been collected at the facility over the years. Thanks are also extended to Wahid Maref and Hamed Saber for their helpful insights.
Executive Summary
Since 2001, a wealth of temperature data has been collected at the Canadian Centre for Housing Technology (CCHT) twin house facility. This report analyzes 7.5 years (January 2003 to August 2010) of basement foundation surface temperature and ground temperature data from the CCHT Reference House. The purpose of this analysis is to develop
correlations between outdoor temperature and interior foundation wall surface temperature, and to identify conditions leading to the potential for condensation on the interior surface of the concrete foundation wall.
The Reference House features 200 mm poured concrete walls with RSI-3.5 (R-20) interior glass fibre batt insulation. Temperatures were measured at different depths and at four locations: buried in the ground 1.82 m (6 ft) from the foundation, on the exterior of the concrete wall, on the interior of the concrete wall, and on the interior of the insulated basement wall.
Basement wall surface temperatures and ground temperatures show a strong dependence on outdoor temperature. Temperatures near soil level react quickly to changes in outdoor temperature, while temperatures at greater depths depend on outdoor temperatures over a longer period of time. On the interior of the concrete foundation wall, surface temperature at soil level depends on the average outdoor temperature histories from the past 3 days, while surface temperature near the base of the wall depends on average outdoor temperature histories from the past 69 days. This can lead to cool conditions in the basement in the springtime, due to cold weather from the previous two months still impacting foundation temperatures.
The impact of snow on the foundation wall surface temperature is minimal compared to the relationship with outdoor temperature. Snow cover in excess of 60 cm was found to have
some impact – keeping the interior surface temperature of the concrete foundation wall
above freezing despite cold outdoor temperatures. However, the occurrence of this amount of snow cover was infrequent for the period studied, so no trends could be drawn from this data set.
Temperatures on the exterior of the basement foundation are usually warmer than the far field ground temperatures. This is particularly true in April, when the far ground is still in the process of thawing. The exterior temperature of the foundation wall was up to 10°C warmer than the ground surface temperature at this time of year.
Hourly outdoor and basement humidity levels were analyzed in detail for a one year period from July 2008 to June 2009 to determine the risk for condensation on the interior surface of the concrete wall. The Reference House basement air tended to be very dry, due to lack of humidification in winter, and the air conditioner removing moisture from the air in summer. As a result, the dew point of the basement air is almost always above the coldest measured surface temperature of the basement wall. However, 21°C house air would only have to be maintained at 20-30% relative humidity in winter to heighten the risk for condensation during this season. Additionally, if outdoor air was brought into the home unconditioned (e.g. through and open window), conditions were favourable for outdoor air to condense on the
interior surface of the concrete wall ~17% of the year – particularly in summer. A properly
installed air/vapour barrier on the interior of the basement wall assembly could help to prevent humid air from coming into contact with the cold concrete surface and minimize the potential for condensation.
Table of Contents
1 Introduction ... 1
2 Background ... 1
2.1 CCHT Twin House Facility ... 1
2.2 Basement construction ... 2
3 Methodology ... 6
3.1 Analysis period ... 6
3.2 Data collection ... 6
Weather Data ... 6
Hourly Outdoor and Indoor Conditions ... 6
Basement Wall Temperature Data ... 6
4 Results ... 8
4.1 Weather ... 8
4.2 Interior Basement Air Temperature ... 9
4.3 Ground and Basement Wall Surface Temperatures ... 12
4.4 Relationship with Outdoor Temperature ... 16
4.5 Impact of Snow cover ... 21
4.6 Spring trends and warming ... 24
4.7 Potential for Condensation ... 27
5 Conclusions ... 34
6 References ... 36
List of Figures
Figure 1 - CCHT Twin-House Facility during winter (Reference House shown at right) ... 2
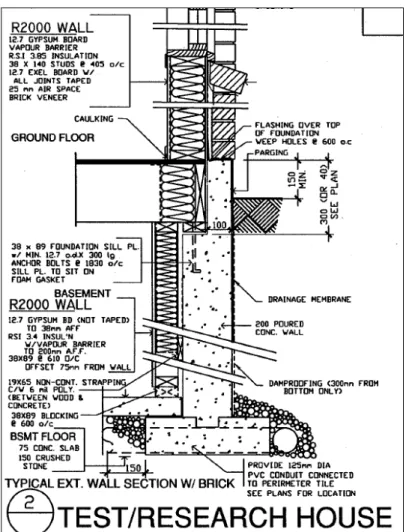
Figure 2 – As-built drawing of the CCHT Reference House Basement Section ... 3
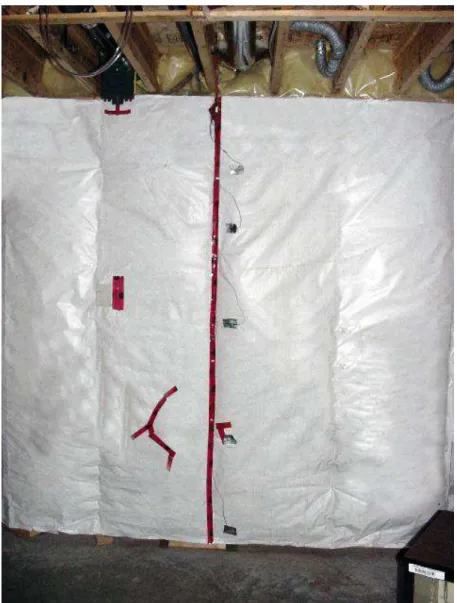
Figure 3 - Photo of the exterior of the instrumented basement wall section ... 3
Figure 4 – Gravel covering a drain at the foot of the basement wall during construction (photo taken in 1998) ... 4
Figure 5 – Backfill used during construction, a mixture of excavated topsoil and clay (photo taken in 1998) ... 4
Figure 6 - Photo of the interior of the instrumented basement wall section (note: this is an experimental assembly with no interior air/vapour barrier) ... 5
Figure 7 – Detailed basement wall section, showing thermocouple locations (note: the thermocouples on either side of the interior wood stud wall were not directly aligned and were separated by a stud as shown) ... 7
Figure 8 – Average daily outdoor temperature data for the analysis period (Environment Canada data from the Ottawa International Airport) ... 8
Figure 9 – Ground snow cover data for the analysis period (Environment Canada data from the Ottawa International Airport) ... 9
Figure 10 – Hourly basement air temperature ... 9
Figure 11 – Winter detail of hourly outdoor, main floor and basement air temperatures 10 Figure 12 – Summer detail of hourly outdoor and basement air temperatures ... 11
Figure 13 – Spring detail of hourly outdoor and basement air temperatures ... 11
Figure 14 – Ground Temperatures ... 12
Figure 15 – Foundation Exterior Surface Temperatures ... 13
Figure 16 – Foundation Interior Surface Temperatures ... 14
Figure 17 – Basement Wall Interior Surface Temperatures ... 15
Figure 18 - Relationship between average daily foundation surface temperature T168 and average daily outdoor air temperature ... 17
Figure 19 - Relationship between average daily foundation surface temperature T168 and moving 3 day average of outdoor air temperature ... 17
Figure 20 - Relationship between average daily foundation surface temperature T155 and average daily outdoor air temperature ... 18
Figure 21 - Relationship between average daily foundation surface temperature T155 and moving 69 day average of outdoor air temperature ... 18
Figure 22 – Temperature is dependent on average outdoor temperature over previous x number of days ... 19
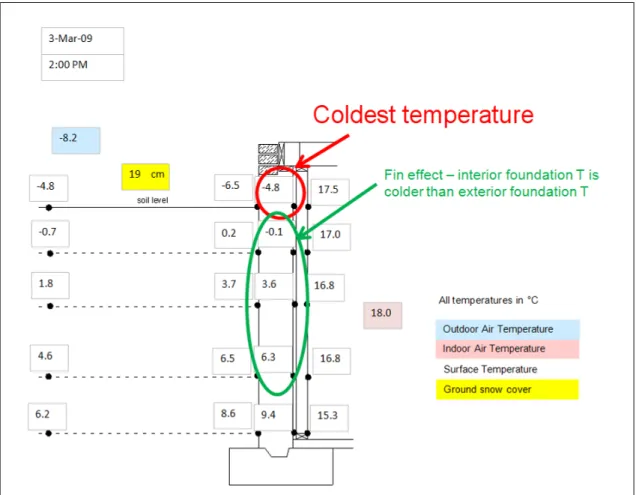
Figure 23 - Snapshot of temperatures on the day with the coldest surface temperature on the interior of the concrete foundation wall ... 20
Figure 24 - T168 VS Average outdoor air temperature for past 3 days, coloured based on snow cover. ... 21
Figure 25 - T168 VS Average outdoor air temperature for past 3 days, coloured based on snow cover. ... 22
Figure 26 – Sample foundation temperatures on a cold day with high snow cover. ... 23
Figure 27 – Sample foundation temperatures on a cold day with low snow cover. ... 23
Figure 28 – Difference between the outdoor air dew point temperature and the minimum measured foundation temperature... 24
Figure 29 – Comparison between the temperature at the top of the foundation (T144) and the temperature at the surface of the ground (T145) ... 25
Figure 30 – One year detail (2004-2005) from the comparison between the temperature at the top of the foundation (T144) and the temperature at the surface of the ground (T145) ... 26
Figure 31 – Difference between the temperature at the top of the foundation (T144) and the temperature at the surface of the ground (T145) ... 26 Figure 32 - Relationship between average daily foundation surface temperature T145
and moving 25 day average of outdoor air temperature ... 27 Figure 33 – Hourly outdoor and basement air temperatures for 2008/2009 ... 28 Figure 34 – Hourly outdoor and basement air relative humidity for 2008/2009 ... 29 Figure 35 – Hourly outdoor and basement absolute humidity (in grams of water vapour
per kg dry air) for 2008/2009 ... 29 Figure 36 – Hourly surface temperatures at the interior of the foundation wall, behind the insulation ... 30 Figure 37 – Dew point temperature of basement air and minimum interior surface
temperature of the foundation (behind the insulation), 2008/2009 ... 31 Figure 38 – Difference between basement air dew point temperature and the minimum
measured foundation wall interior surface temperature (behind the insulation)... 31 Figure 39 – Relative humidity of air at 21°C that could lead to condensation on the
interior of the basement foundation wall (behind the insulation) ... 32 Figure 40 – Dew point temperature of outdoor air and minimum interior surface
temperature of the foundation, 2008/2009 ... 33 Figure 41 – Difference between the outdoor air dew point temperature and the minimum
measured foundation wall interior surface temperature (behind the insulation)... 33 Figure A-1 - Relationship between average daily foundation surface temperature T158
and average daily outdoor air temperature ... 37 Figure A-2 - Relationship between average daily foundation surface temperature T158
and moving 10 day average of outdoor air temperature ... 37 Figure A-3 - Relationship between average daily foundation surface temperature T157
and average daily outdoor air temperature ... 38 Figure A-4 - Relationship between average daily foundation surface temperature T157
and moving 31 day average of outdoor air temperature ... 38 Figure A-5 - Relationship between average daily foundation surface temperature T156
and average daily outdoor air temperature ... 39 Figure A-6 - Relationship between average daily foundation surface temperature T156
and moving 50day average of outdoor air temperature ... 39 Figure A-7 - Relationship between average daily foundation surface temperature T144
and average daily outdoor air temperature ... 40 Figure A-8 - Relationship between average daily foundation surface temperature T144
and moving 4 day average of outdoor air temperature ... 40 Figure A-9 - Relationship between average daily foundation surface temperature T154
and average daily outdoor air temperature ... 41 Figure A-10 - Relationship between average daily foundation surface temperature T154
and moving 20 day average of outdoor air temperature ... 41 Figure A-11 - Relationship between average daily foundation surface temperature T153
and average daily outdoor air temperature ... 42 Figure A-12 - Relationship between average daily foundation surface temperature T153
and moving 39 day average of outdoor air temperature ... 42 Figure A-13 - Relationship between average daily foundation surface temperature T152
and average daily outdoor air temperature ... 43 Figure A-14 - Relationship between average daily foundation surface temperature T152
Figure A-15 - Relationship between average daily foundation surface temperature T151 and average daily outdoor air temperature ... 44 Figure A-16 - Relationship between average daily foundation surface temperature T151
and moving 75 day average of outdoor air temperature ... 44 Figure A-17 - Relationship between average daily foundation surface temperature T145
and average daily outdoor air temperature ... 45 Figure A-18 - Relationship between average daily foundation surface temperature T145
and moving 25 day average of outdoor air temperature ... 45 Figure A-19 - Relationship between average daily foundation surface temperature T146
and average daily outdoor air temperature ... 46 Figure A-20 - Relationship between average daily foundation surface temperature T146
and moving 46 day average of outdoor air temperature ... 46 Figure A-21 - Relationship between average daily foundation surface temperature T147
and average daily outdoor air temperature ... 47 Figure A-22 - Relationship between average daily foundation surface temperature T147
and moving 66 day average of outdoor air temperature ... 47 Figure A-23 - Relationship between average daily foundation surface temperature T148
and average daily outdoor air temperature ... 48 Figure A-24 - Relationship between average daily foundation surface temperature T148
and moving 96 day average of outdoor air temperature ... 48 Figure A-25 - Relationship between average daily foundation surface temperature T149
and average daily outdoor air temperature ... 49 Figure A-26 - Relationship between average daily foundation surface temperature T149
and moving 117 day average of outdoor air temperature ... 49
List of Tables
1 Introduction
The Canadian climate presents a challenge for residential construction. Throughout the year, the building envelope has to minimize energy losses while continuing to ensure occupant health and comfort. Surface temperatures of the foundation wall can be
particularly problematic – since the foundation is often a location of thermal bridging, and the mass of concrete and the soil surrounding it are slow to respond to changes in outdoor conditions. If sufficiently humid air comes into contact with the cold surface of the foundation wall, there is opportunity for water vapour in the air to condense and the potential to cause moisture problems.
At the Canadian Centre for Housing Technology in Ottawa, Canada, a cross section of the Reference House North foundation wall (featuring interior glass fibre batt insulation) was instrumented at the time of construction in 1998. Since then, foundation surface temperatures and ground temperatures have been continuously monitored and collected. This valuable database is ideal for determining the interaction between the basement foundation wall and outdoor climate, and also for predicting the indoor humidity threshold for condensation.
This report analyzes over seven years of foundation temperature data in order to quantify relationships between outdoor temperature, snow cover and basement
foundation temperatures, and to identify conditions where these temperatures may lead to the risk of condensation.
2 Background
2.1 CCHT Twin House Facility
Built in 1998, the Canadian Centre for Housing Technology (CCHT)
(www.ccht-cctr.gc.ca) is jointly operated by National Research Council (NRC), Natural Resources Canada (NRCan), and Canada Mortgage and Housing Corporation (CMHC). CCHT’s mission is to accelerate the development of new technologies and their acceptance in the marketplace. Since its launch, CCHT has been the assessment site for more than 50 housing-related technologies, ranging from compact fluorescent light bulbs and high-performance windows to innovative natural gas-fired engines and a fuel cell.
The CCHT features twin research houses to evaluate the whole-house performance of new technologies in side-by-side testing (Figure 1). These houses were designed and built by a local builder to the R-2000 standard (NRCan, 2001) and were built with the same crews and techniques normally used by the builder.
The CCHT twin houses are fully instrumented and include a simulated occupancy system that simulates the daily water draws and electrical loads of a family of four. The internal heat gains from the occupants are also simulated, through the use of 60 W (adult) and 40 W (children) light bulbs. The CCHT twin houses feature over 300 sensors per house, including thermocouples and humidity sensors (Swinton, 2001).
The houses have a central forced air system to provide space heating and cooling. The system is controlled by a centrally located thermostat on the main floor. Three supply ducts and one return duct from this single zone system condition the air in the basement
whenever there is a call for heat or cooling from the central thermostat. While the temperatures on the main floor are held within a tight band by the thermostat, temperatures on the basement are allowed to drift. This can lead to daily air temperature swings as discussed in Section 4.2.
Figure 1 - CCHT Twin-House Facility during winter (Reference House shown at right)
2.2 Basement construction
The data analyzed in this report was collected from the CCHT Reference House. The house features a full basement with interior-insulated 200 mm poured concrete walls (Figure 2). A full-height 2x4 stud wall with glass fibre batt insulation (RSI-3.4, R-19) sits on the interior side of the concrete, elevated from the basement slab by 2x4s, with a 25 mm (1 in) air gap between the stud wall assembly and the concrete. A spun-bonded polyolefin (SBPO) membrane wraps the entire stud wall assembly, attached to the interior side of the concrete and also to the interior side of the stud wall. The interior of the assembly is unfinished – the SBPO membrane is exposed to the basement air. The concrete foundation is exposed by approximately 30 cm (1 ft) above ground. The exposure at the time of construction was 15 cm (6 in), however, over time the soil around the foundation wall has settled. The exterior of the instrumented basement is shown in Figure 3. During construction, a drainpipe was laid around the footing of the foundation and covered in gravel. The area adjacent to the basement was then back filled with a mixture of excavated topsoil and clay (see Figure 4 and Figure 5).
A photo of the interior of the instrumented wall is shown in Figure 6. This is not a typical basement assembly, due to the breathable SBPO membrane on the interior side of the basement wall assembly. Typically an air/vapour barrier is required at this location (e.g. a polyethylene membrane). This experimental basement wall assembly without
air/vapour barrier was shown to perform well in dry basement conditions such as those present in the research house. However, it would likely not be suitable for more humid interior environments.
Figure 2 – As-built drawing of the CCHT Reference House Basement Section
Figure 4 – Gravel covering a drain at the foot of the basement wall during construction (photo taken in 1998)
Figure 5 – Backfill used during construction, a mixture of excavated topsoil and clay (photo taken in 1998)
Figure 6 - Photo of the interior of the instrumented basement wall section (note: this is an experimental assembly with no interior air/vapour barrier)
3 Methodology
3.1 Analysis period
Data for this analysis was collected from the CCHT Reference House over a 7.5 year period from 02-Jan-03 to 03-Aug-10, including seven full heating seasons.
3.2 Data collection Weather Data
Environment Canada weather data from the Ottawa International Airport, located approximately 15 km south of the twin house site, was used in this analysis
(Environment Canada, 2011). Average daily temperature data from the airport was chosen over local temperature data since airport data was more complete.
Temperatures from the Environment Canada data agreed closely with temperatures measured by thermocouples at the Reference House location. The total daily snow cover records from the airport were also used in the analysis. These give a general indication of the amount of snow likely to be found at the twin house facility, however, local snow effects including drifting and melting may result in different actual snow cover amounts at the Reference House location.
Hourly Outdoor and Indoor Conditions
One year of hourly temperature and relative humidity data from the basement and the exterior were analyzed in the detailed dew point temperature analysis in Section 4.7. For this analysis, the outdoor conditions were recorded locally at the twin house facility. The accuracy of relative humidity data is ± 2% RH.
Basement Wall Temperature Data
Ground temperatures, exterior foundation surface temperatures, interior foundation surface temperatures and interior basement wall temperatures were collected hourly. The monitored foundation cross section is located on the north side of the house. Ground and surface temperatures were measured by thermocouples at 5 depths (0 mm [0 in], 390 mm [15.5 in], 850 mm [33.5 in], 1460 mm [57.5 in], and 1990 mm [78.5 in]) below the ground surface at 4 locations: buried in the ground 1.82 m (6 ft) from the foundation; attached to the exterior surface of the foundation; attached to the interior surface of the foundation; and attached to the interior surface of the basement wall (fixed to the surface of the SBPO membrane). The accuracy of temperature measurements was +/-0.2°C. The numbered sensors and locations are presented in Figure 7. Thermocouples are numbered based on the numbering norm for the full house data acquisition system, which includes over 300 sensors.
Figure 7 – Detailed basement wall section, showing thermocouple locations (note: the thermocouples on either side of the interior wood stud wall were not directly aligned and
were separated by a stud as shown)
Thermocouples 169, 170, 171, 172 and 173 are located on the inner side of the inner spun bonded polyolefin membrane (SBPO). Thermocouples 168, 158, 157 and 156 are located on the inner side of the outer SBPO membrane. Thermocouple 155 is located on the inner side of the concrete wall. Thermocouples 144, 154, 153, 152, and 151 are located on the outer side of the concrete wall. Thermocouples 145, 146, 147, 148, and 149 are located in the ground, 1830 mm (72 in.) from the foundation wall. As shown in the above figure, the thermocouples on either side of the interior wood stud wall were not directly aligned and were separated by a stud.
Section View Front View
Slab 155 156 157 158 168 2x4 with Gla ss F ibre B att Spac e Ground Level 151 152 153 154 144 145 146 147 148 149 Concrete W al l Footing SBPO membrane Polyethylene 169 168 158 170 2x4 Wood S tu d SBPO membrane 156 172 2x4 155 173 157 171 2x4 Wood S tu d 2x4 Space 2x4 610 mm (24 in) 300 m m (12 in ) 390 m m (15.5 in) 169 170 25 mm (1 in) space 1830 mm (72 in) 1460 mm (57. 5 in ) 1990 mm (78. 5 in ) 172 173 110 m m (4.3 in ) 171 850 mm (33. 5 in )
4 Results
4.1 Weather
The basement assembly was exposed to a variety of weather conditions throughout the analysis period (see Table 1). Environment Canada data (1971-2000) indicates that the average Celsius heating degree days <18°C for Ottawa is 4602. Winter 2008-2009 is very close to this average. The remaining heating seasons in the analysis were warmer than average. 2009-2010 was the warmest of all, with 3983 HDD <18°C. Average daily temperatures ranged from -27.8°C to 29.3°C (Figure 8).
Table 1 – Heating degree days and snow cover for the analysis period
Year HDD<18°C Max snow cover (cm)
Average snow cover (cm)
Jan Feb Mar
2003-2004 4556 30 11 20 2 2004-2005 4522 40 16 12 20 2005-2006 4116 41 21 15 7 2006-2007 4327 24 7 18 10 2007-2008 4386 87 23 40 67 2008-2009 4600 69 40 40 3 2009-2010 3983 47 35 11 2
The maximum snow cover and the average monthly snow cover for January, February, and March are also shown in Table 1. 2007-2008 was by far the season with the highest snow cover, as shown in Figure 9. This winter experienced the second highest snowfall on record, with a total of 432 cm recorded.
-40 -30 -20 -10 0 10 20 30 40 5 -D ec -01 5 -M a r-02 3 -J u n -02 1 -S ep -02 30 -N o v -02 28 -F eb -03 29 -M a y -03 27 -A u g -03 25 -N o v -03 23 -F eb -04 23 -M a y -04 21 -A u g -04 19 -N o v -04 17 -F eb -05 18 -M a y -05 16 -A u g -05 14 -N o v -05 12 -F eb -06 13 -M a y -06 11 -A u g -06 9 -N o v -06 7 -F e b -07 8 -M a y -07 6 -A u g -07 4 -N o v -07 2 -F e b -08 2 -M a y -08 31 -J u l-08 29 -O c t-08 27 -J a n -09 27 -A p r-09 26 -J u l-09 24 -O c t-09 22 -J a n -10 22 -A p r-10 21 -J u l-10 19 -O c t-10 A ve ra ge d a il y te m p e ra tu re , ° C Date Outdoor Temperature
Figure 8 – Average daily outdoor temperature data for the analysis period (Environment Canada data from the Ottawa International Airport)
0 10 20 30 40 50 60 70 80 90 100 1 -J a n -02 1 -A p r-02 1 -J u l-02 1 -O c t-02 1 -J a n -03 1 -A p r-03 1 -J u l-03 1 -O c t-03 1 -J a n -04 1 -A p r-04 1 -J u l-04 1 -O c t-04 1 -J a n -05 1 -A p r-05 1 -J u l-05 1 -O c t-05 1 -J a n -06 1 -A p r-06 1 -J u l-06 1 -O c t-06 1 -J a n -07 1 -A p r-07 1 -J u l-07 1 -O c t-07 1 -J a n -08 1 -A p r-08 1 -J u l-08 1 -O c t-08 1 -J a n -09 1 -A p r-09 1 -J u l-09 1 -O c t-09 1 -J a n -10 Sn o w C o ve r o n G ro u n d , cm Date Snow Cover
Figure 9 – Ground snow cover data for the analysis period (Environment Canada data from the Ottawa International Airport)
4.2 Interior Basement Air Temperature
In winter, the Reference House indoor temperature was maintained at approximately 21°C by a thermostat located on the main floor of the home that is set to 22°C. Summer temperature settings varied due to individual experiment requirements. The summer setting prior to 2006 was 22°C, in 2006 was 26°C, in 2007 was 22°C, and was 24°C in 2008 and 2009. Due to the central location of the thermostat, temperatures in the basement are free to drift (Figure 10).
0 5 10 15 20 25 30 8 -J ul -01 4 -J a n -02 3 -J ul -02 30 -D e c-02 28 -J un -03 25 -D e c-03 22 -J un -04 19 -D e c-04 17 -J un -05 14 -D e c-05 12 -J un -06 9 -D e c-06 7 -J un -07 4 -D e c-07 1 -J un -08 28 -N ov -08 27 -M a y -09 23 -N ov -09 22 -M a y -10 18 -N ov -10 Te m p e ra tu re , °C Date
Basement Air Temperature
Sample temperatures from the winter are shown in Figure 11. The basement air temperature (green) and main floor air temperature (orange) are plotted on the left y-axis, and the outdoor air temperature is plotted in blue on the right y-axis. In winter, the basement air temperature dips down to 15°C on occasion. Even though there are three supply ducts for hot air and one return duct in the basement, if the temperature at the thermostat on the main floor is satisfied, the central heating system shuts off. This happens primarily on sunny days. This phenomenon is most evident in February (near the end of the plotted period): the outdoor temperatures dips daily below -10°C, while the basement temperature fluctuates between 17°C and 20°C. On these cold days, the thermostat calls for heat at night, and the basement receives the benefit of high amounts of heating. During the day, solar gains satisfy the thermostat on the main floor and the basement cools. The basement air temperature was measured just 30 cm (1 ft) below the basement ceiling. It is likely that temperatures at lower heights would be cooler. However, these were not measured.
-30 -25 -20 -15 -10 -5 0 5 10 15 20 25 30 35 40 12 13 14 15 16 17 18 19 20 21 22 23 24 25 26 13 -Ja n -06 18 -Ja n -06 23 -Ja n -06 28 -Ja n -06 2 -F e b -06 7 -F e b -06 12 -F e b -06 O u td o o r A ir T e m p e ra tu re , °C B a se m e n t o r M a in F lo o r Te m p e ra tu re , °C Date
Basement, Main Floor and Outdoor Air Temperatures
Main Floor air T Basement air T Outdoor T
Figure 11 – Winter detail of hourly outdoor, main floor and basement air temperatures
A sample of summer basement air temperature is shown in Figure 12. This cooling season, the central thermostat setting was 24°C. Basement temperature fluctuates on a daily basis, in an inverse relationship with outdoor temperature. When the outdoor temperature is high, the central thermostat calls for cooling. While this cooling is needed on the main floor, it is not necessary for the basement. As a result, the basement cools to 19°C on occasion. At night, the outdoor air cools and the cooling system shuts off. The basement air then warms up to above 21°C.
In spring, basement temperatures drift more freely (Figure 13). This time of year, there is often overheating of the house on the main floor due to warm days and high solar gains. These houses are operated with closed windows year round, so heat can build up during the days and dissipate at night. The thermostat is satisfied the majority of the
time, and does not call for heating. During the plotted period, the basement air
temperature ~30 cm below the ceiling remains around 20°C. Again, air temperatures at lower heights in the basement may be cooler, but these were not measured.
0 5 10 15 20 25 30 35 40 18 19 20 21 22 23 24 25 26 21 -J ul -08 26 -J ul -08 31 -J ul -08 5 -Aug -08 10 -Aug -08 15 -Aug -08 20 -Aug -08 O u td o o r A ir T e m p e ra tu re , °C B a se me n t o r M a in F lo o r A ir Te mp e ra tu re , °C Date
Basement, Main Floor and Outdoor Air Temperatures Main Floor air T Basement air T Outdoor T
Figure 12 – Summer detail of hourly outdoor and basement air temperatures
0 5 10 15 20 25 30 35 40 18 19 20 21 22 23 24 25 26 17 -Apr -09 22 -Apr -09 27 -Apr -09 2 -M a y -09 7 -M a y -09 12 -M a y -09 17 -M a y -09 O u td o o r A ir T e m p e ra tu re , °C B a se me n t o r M a in F lo o r A ir Te mp e ra tu re , °C Date
Basement, Main Floor and Outdoor Air Temperatures
Main Floor air T Basement air T Outdoor T
4.3 Ground and Basement Wall Surface Temperatures
The average daily temperatures recorded by the thermocouples at the four different layers in the basement assembly are presented in Figure 14 through Figure 17.
The ground has a buffering effect. While temperatures at the surface of the soil fluctuate between -5°C and 23°C, temperatures deeper in the ground are steadier. At the
deepest measured location, 1990 mm (78.5 in) below soil level, the temperature fluctuates between 6°C and 16°C. The peak occurs in September, and the minimum occurs in April (Figure 14). At the surface, the ground temperature follows the outdoor temperature closely: peaking above 20°C in July, and diving below 0°C in February. During the analysis period, the temperature never fell below freezing at the
measurement location 850 mm (33.5 in) below soil level.
-10 -5 0 5 10 15 20 25 30 35 08 -J u l-01 04 -J a n -02 03 -J u l-02 30 -D ec -02 28 -J u n -03 25 -D ec -03 22 -J u n -04 19 -D ec -04 17 -J u n -05 14 -D ec -05 12 -J u n -06 09 -D ec -06 07 -J u n -07 04 -D ec -07 01 -J u n -08 28 -N o v -08 27 -M a y -09 23 -N o v -09 22 -M a y -10 18 -N o v -10 17 -M a y -11 A v e ra g e D a il y T e mp e ra tu re , °C Date
Average Daily Ground Temperatures
145) Ground 0 mm (0 in) 146) Ground 390 mm (15.5 in) 147) Ground 850 mm (33.5 in) 148) Ground 1460 mm (57.5 in) 149) Ground 1990 mm (78.5 in)
Temperatures from the exterior of the foundation are plotted in Figure 15. Temperatures at this location are influenced by ground temperatures, air temperatures and basement temperatures to varying degrees. Like the ground temperatures, the temperatures at the top of the foundation respond more rapidly to changes in outdoor temperature. This relationship is explored in Section 4.4. As a result, the coldest winter and warmest summer temperatures on the exterior foundation are recorded at ground level. By contrast, the temperatures near the base of the foundation wall relate most closely to ground temperatures. At the deepest location, the temperature fluctuates annually between 10°C and 17°C – slightly warmer than the temperatures at the same depth in the far ground location.
-10 -5 0 5 10 15 20 25 30 35 08 -J u l-01 04 -J a n -02 03 -J u l-02 30 -D e c -02 28 -J u n -03 25 -D e c -03 22 -J u n -04 19 -D e c -04 17 -J u n -05 14 -D e c -05 12 -J u n -06 09 -D e c -06 07 -J u n -07 04 -D e c -07 01 -J u n -08 28 -N o v -08 27 -M a y -09 23 -N o v -09 22 -M a y -10 18 -N o v -10 17 -M a y -11 A ve ra ge D a il y Su rf a ce T e m p e ra tu re , °C Date
Average Daily Foundation Exterior Surface Temperatures 144) Ext foundation 0 mm (0 in) 154) Ext foundation 390 mm (15.5 in) 153) Ext foundation 850 mm (33.5 in) 152) Ext foundation 1460 mm (57.5 in) 151) Ext foundation 1990 mm (78.5 in)
153 144 154 152 151 168 158 157 156 155 169 170 171 172 173
Temperatures at the interior surface of the concrete foundation wall behind the insulation layer follow similar trends as those on the exterior surface of the foundation (Figure 16). The coldest location in winter is again at soil level, and the coldest location during summer is at the base of the wall. Note: the thermocouple at the base of the wall is in direct contact with the concrete, unlike the four other thermocouples on this layer, which are adhered to the SBPO membrane (see Figure 7). Additionally, the thermocouple at the base of the wall is adjacent to the base plate of the interior insulated wall. This likely contributes to maintaining temperatures at this location above 9°C throughout the year. The temperatures of the interior surface of the foundation wall are of particular interest in determining potential for condensation. If humid air were to find its way to this surface, cold temperatures could result in condensation. A full analysis of this phenomenon is presented in Section 4.7. -10 -5 0 5 10 15 20 25 30 35 08 -J u l-01 04 -J a n -02 03 -J u l-02 30 -D ec -02 28 -J u n -03 25 -D ec -03 22 -J u n -04 19 -D ec -04 17 -J u n -05 14 -D ec -05 12 -J u n -06 09 -D ec -06 07 -J u n -07 04 -D ec -07 01 -J u n -08 28 -N o v -08 27 -M a y -09 23 -N o v -09 22 -M a y -10 18 -N o v -10 17 -M a y -11 A v e ra g e D a il y S u rf a ce T e mp e ra tu re , °C Date
Average Daily Foundation Interior Surface Temperatures 168) Int foundation 0 mm (0 in) 158) Int foundation 390 mm (15.5 in) 157) Int foundation 850 mm (33.5 in) 156) Int foundation 1460 mm (57.5 in) 155) Int foundation 1990 mm (78.5 in)
153 144 154 152 151 168 158 157 156 155 169 170 171 172 173
Temperatures on the interior surface of the insulated basement wall are generally warmer than temperatures on the surface of the concrete, as they are most influenced by basement air temperature (Figure 17). Temperatures are coldest at the base of the wall, and warmest at the top of the wall. The gradation in temperature from the base to the top of the wall is likely influenced by the uninsulated slab and resultant basement air temperature stratification. Additionally, the thermocouple at the base of the wall is attached to the 2x4 base plate of the wood stud wall assembly. The wood frame creates a thermal bridge from the slab to the thermocouple location, causing this to be the coldest measured location on the interior surface of the wall year-round.
-10 -5 0 5 10 15 20 25 30 35 08 -J u l-01 04 -J a n -02 03 -J u l-02 30 -D ec -02 28 -J u n -03 25 -D ec -03 22 -J u n -04 19 -D ec -04 17 -J u n -05 14 -D ec -05 12 -J u n -06 09 -D ec -06 07 -J u n -07 04 -D ec -07 01 -J u n -08 28 -N o v -08 27 -M a y -09 23 -N o v -09 22 -M a y -10 18 -N o v -10 17 -M a y -11 A v e ra g e D a il y S u rf a ce T e mp e ra tu re , °C Date
Average Daily Basement Wall Interior Surface Temperatures 169) Int Basement 0 mm (0 in) 170) Int Basement 390 mm (15.5 in) 171) Int Basement 850 mm (33.5 in) 172) Int Basement 1460 mm (57.5 in) 173) Int Basement 1990 mm (78.5 in)
153 144 154 152 151 168 158 157 156 155 169 170 171 172 173
4.4 Relationship with Outdoor Temperature
Ground temperatures and temperatures either side of the concrete foundation wall are strongly influenced by fluctuations in outdoor temperature. However, as shown in the previous section, the deeper the location, the longer the delay in temperature response. In order to determine the relationship between outdoor temperature and ground and foundation temperatures, the average daily measured temperature data was plotted against average outdoor temperature for all ground and foundation locations. The plot for thermocouple #168 (T168 - located at the top of the interior of the foundation wall, behind the insulation) is shown in Figure 18. Subsequently, the average temperature was plotted against a moving average of the outdoor temperature for the previous 2 days, 3 days, 4 days, etc., until the relationship with the strongest correlation was
identified (with the highest R-squared value). For example, at T168 the relationship was strongest for a running average temperature from the past 3 days – as shown in Figure 19. This correlation has an R-squared value of 0.9712, the correlation with a moving average temperature for the past 2 days was 0.9654, and for the past 4 days was 0.9681. Thus, cold snaps 3 or more days in length will result in cold temperatures at the top of the foundation wall.
A second example is shown in Figure 20 and Figure 21. These plots are both for T155, the thermocouple near the base of the interior of the foundation wall, behind the
insulation. In this location, the straight correlation between average daily surface temperature and average daily outdoor temperature is weaker than the correlation for T168 (Figure 18), with more scatter. However, when the average daily surface
temperature at T155 is plotted against the running average temperature over the past 69 days, the correlation is strong (R-value: 0.959). Thus, the temperature at the base of the wall is dependent on the average outdoor temperature over the past 69 days.
y = 0.0061x2+ 0.4932x + 6.7018 R² = 0.9331 -10 -5 0 5 10 15 20 25 30 -30 -20 -10 0 10 20 30 40 F o u n d a ti o n T e mp e ra tu re , °C
Average Daily Outdoor Air Temperature, °C
Interior Foundation Temperature 168 VS Outdoor Air Temperature
153 144 154 152 151 168 158 157 156 155 169 170 171 172 173
Figure 18 - Relationship between average daily foundation surface temperature T168 and average daily outdoor air temperature
y = 0.0067x2+ 0.508x + 6.5483 R² = 0.9712 -10 -5 0 5 10 15 20 25 30 -30 -20 -10 0 10 20 30 40 F o u n d a ti o n T e m p e ra tu re , °C
Moving Average Outdoor Air Temperature for past 3 days, °C
Interior Foundation Temperature 168 VS Outdoor Air Temperature
153 144 154 152 151 168 158 157 156 155 169 170 171 172 173
Figure 19 - Relationship between average daily foundation surface temperature T168 and moving 3 day average of outdoor air temperature
y = 0.0014x2+ 0.1607x + 12.542 R² = 0.5899 -10 -5 0 5 10 15 20 25 30 -30 -20 -10 0 10 20 30 40 F o u n d a ti o n T e mp e ra tu re , °C
Outdoor Air Temperature, °C
Interior Foundation Temperature 155 VS Outdoor Air Temperature
153 144 154 152 151 168 158 157 156 155 169 170 171 172 173
Figure 20 - Relationship between average daily foundation surface temperature T155 and average daily outdoor air temperature
y = 0.0013x2+ 0.2425x + 12.121 R² = 0.959 -10 -5 0 5 10 15 20 25 30 -30 -20 -10 0 10 20 30 40 F o u n d a ti o n T e m p e ra tu re , °C
Moving Average Outdoor Air Temperature for past 69 days, °C
Interior Foundation Temperature 155 VS Outdoor Air Temperature
153 144 154 152 151 168 158 157 156 155 169 170 171 172 173
Figure 21 - Relationship between average daily foundation surface temperature T155 and moving 69 day average of outdoor air temperature
The same procedure was repeated for all the temperature measurement locations in the ground, on the exterior of the foundation wall, and on the interior of the foundation wall behind the insulation. The full set of resulting curves is included in Appendix A. The surface temperature at each location is dependent on the average outdoor temperature for the number of days listed in Figure 22. For example, the temperature measurement at location 149 (the deepest ground temperature location) is dependent on the average outdoor temperature from the previous 117 days. This figure shows the impact of the thermal conductivity of the foundation wall on the response to outdoor temperature. It is postulated that due to the conduction “fin” effect of the concrete in the foundation wall, temperatures on the interior of the wall react slightly faster to changes in outdoor
temperature than the temperatures at the exterior of the wall (which are attenuated more by ground temperatures), and much faster than temperatures in the ground.
Even so, the temperatures at the base of the basement wall apparently depend on 69 days (over 2 months) of outdoor weather. This suggests that the temperature at this location in early April is dependent on the outdoor temperature histories of February and March.
Figure 22 – Temperature is dependent on average outdoor temperature over previous x number of days 147 145 146 148 149 153 144 154 152 151 168 158 157 156 155 soil level 25 days 46 days 66 days 96 days 117 days 4 days 20 days 39 days 59 days 75 days 3 days 10 days 31 days 50 days 69 days
A snapshot of the wall assembly on the day with the coldest temperature on the interior of the foundation wall is shown in Figure 23. On this day, the interior surface of the concrete reached -4.8°C. At this same instant, the basement wall shows an apparent “fin effect”, whereby the concrete in the foundation wall is acting as a thermal bridge – conducting heat out of the basement wall assembly, to the top of the wall and to the exterior. The temperatures at the three middle locations (circled in green) are cooler than both the basement interior temperatures and the temperatures at the
foundation/ground interface – an indication of heat being drawn out of the basement wall by the fin effect.
Figure 23 - Snapshot of temperatures on the day with the coldest surface temperature on the interior of the concrete foundation wall
4.5 Impact of Snow cover
The previous section described the relationship between the foundation interior surface temperatures and outdoor temperature histories. It is hypothesized that snow could help to insulate the foundation wall and increase interior foundation surface temperatures. The location at the top of the wall is of particular interest, since it responds the fastest to changes in outdoor conditions. To determine whether snow also affects foundation temperatures, the points in the foundation temperature VS moving average outdoor air temperature plot for T168 (Figure 19) were coloured based on degree of snow cover. The resulting graph is shown in Figure 24. As shown in this figure, there is no strong correlation with snow cover. Some of the coldest foundation temperatures still occur with some degree of snow cover. Even with more than 40 cm of snow, the interior surface temperature drops below 0°C on occasion.
With snow cover in excess of 50 cm, the interior basement foundation remained above freezing (Figure 25). However, during the analysis period this happened infrequently, resulting in limited data points: only 85 days with >50 cm snow, 49 days > 60 cm, and 19 days> 70 cm. Additionally - since the snow data is from the Ottawa International Airport and not measured locally, local effects such as drifting and melting away from the foundation wall are not captured. Therefore it is difficult to draw any useful relationships between surface temperature and snow cover from this data set.
-10 -5 0 5 10 15 20 25 30 -30 -20 -10 0 10 20 30 40 F o u n d a ti o n T e m p e ra tu re , °C
Moving Average Outdoor Air Temperature for past 3 days, °C
Interior Foundation Temperature 168 VS Outdoor Air Temperature
Average of 168) Int foundation 0
168 with snow > 10 cm 168 with snow > 20 cm 168 with snow > 30 cm 168 with snow > 40 cm 168 with snow > 50 cm 168 with snow > 60 cm 153 144 154 152 151 168 158 157 156 155 169 170 171 172 173
Figure 24 - T168 VS Average outdoor air temperature for past 3 days, coloured based on snow cover.
-10 -5 0 5 10 15 20 25 30 -30 -20 -10 0 10 20 30 40 F o u n d a ti o n T e m p e ra tu re , °C
Moving Average Outdoor Air Temperature for past 3 days, °C
Interior Foundation Temperature 168 VS Outdoor Air Temperature
Average of 168) Int foundation 0
168 with snow > 50 cm 168 with snow > 60 cm 168 with snow > 70 cm 153 144 154 152 151 168 158 157 156 155 169 170 171 172 173 Temperature kept above 0 C
Figure 25 - T168 VS Average outdoor air temperature for past 3 days, coloured based on snow cover.
Example foundation and ground temperatures on a cold day with high amounts of snow cover are given in Figure 26. On this occasion, the outdoor temperature has dropped to -15.5°C, and the ground is covered by 72 cm of snow. The temperature at the top of the exterior of the foundation is 0.0°C. This indicates significant insulating effects from the snow, and potentially snow melting at the interface with the foundation wall. The lowest surface temperature on the interior side of the foundation (behind the insulation) is 2.4°C.
By contrast, sample data from a day with low snow accumulation and cold outdoor temperatures is presented in Figure 27. At the time shown, there is 12 cm of snow cover, and the outdoor temperature is -20.4°C. While the temperature at the surface of the ground is just below 0°C, the temperature at the top of the exterior of the foundation is -7.4°C. Without large amounts of snow cover, the exposed foundation wall and brick façade conducts heat out of the assembly, acting as a fin.
Figure 26 – Sample foundation temperatures on a cold day with high snow cover.
4.6 Spring trends and warming
In the spring, the foundation wall warms more rapidly than the soil in the far ground location. Sample temperatures from this time of year are shown in the cross section in Figure 28. In this instance, the temperature at the surface of the ground is just above freezing, while the exterior foundation temperature at soil level is 11°C. The ground is in the process of thawing, as shown by the sub-zero temperatures 390 mm (15.5 in) below soil level.
Figure 28 – Difference between the outdoor air dew point temperature and the minimum measured foundation temperature
The temperatures at the soil level in the ground (T144) and at the exterior of the
foundation wall (T145) are compared for the full analysis period in Figure 29. The circled section on this graph is presented in more detail in Figure 30. Differences between the two temperatures are plotted in Figure 31. The spring temperature difference occurs annually and the peak difference occurs in mid April every year. This is evidence that on warm days the basement wall conducts heat into the ground from the basement and from the exposed above ground section of the foundation wall. This causes the ground around the foundation to thaw and heat up more rapidly than the soil in the far ground location. This can result in up to a 10°C temperature difference between these two locations in the spring.
The opposite phenomenon occurred once during the analysis period – on 18-Jan-05. On this day, a cold snap occurred with low amounts of snow on the ground. The foundation cooled rapidly, while the surface of the ground remained warm due to the small amount of snow cover and heat stored in the ground. Temperatures in the basement cross section for this occasion are shown in Figure 27.
-15 -10 -5 0 5 10 15 20 25 30 35 16 -J u l-01 15 -N o v -01 17 -M a r-02 17 -J u l-02 16 -N o v -02 18 -M a r-03 18 -J u l-03 17 -N o v -03 18 -M a r-04 18 -J u l-04 17 -N o v -04 19 -M a r-05 19 -J u l-05 18 -N o v -05 20 -M a r-06 20 -J u l-06 19 -N o v -06 21 -M a r-07 21 -J u l-07 20 -N o v -07 21 -M a r-08 21 -J u l-08 20 -N o v -08 22 -M a r-09 22 -J u l-09 21 -N o v -09 Te m p e ra tu re , °C Date
Temperature at top of foundation (144) and Temperature at top of ground (145)
145) Ground 0 144) Ext foundation 0 145 146 144 154 168 158 169 170 soil level
Every spring, the ground further away from the foundation stays cooler than the foundation
Figure 29 – Comparison between the temperature at the top of the foundation (T144) and the temperature at the surface of the ground (T145)
-10 -5 0 5 10 15 20 25 30 1 -Aug -04 1 -S e p -04 2 -O ct -04 2 -N ov -04 3 -D e c-04 3 -Ja n -05 3 -F e b -05 6 -M a r-05 6 -Apr -05 7 -M a y -05 7 -Jun -05 8 -Jul -05 8 -Aug -05 Te m p e ra tu re , °C Date
Temperature at top of foundation (144) and Temperature at top of ground (145)
145) Ground 0 144) Ext foundation 0 145 146 144 154 168 158 169 170 soil level
Figure 30 – One year detail (2004-2005) from the comparison between the temperature at the top of the foundation (T144) and the temperature at the surface of the ground (T145)
-8 -6 -4 -2 0 2 4 6 8 10 12 14 16 -J u l-01 15 -N o v -01 17 -M a r-02 17 -J u l-02 16 -N o v -02 18 -M a r-03 18 -J u l-03 17 -N o v -03 18 -M a r-04 18 -J u l-04 17 -N o v -04 19 -M a r-05 19 -J u l-05 18 -N o v -05 20 -M a r-06 20 -J u l-06 19 -N o v -06 21 -M a r-07 21 -J u l-07 20 -N o v -07 21 -M a r-08 21 -J u l-08 20 -N o v -08 22 -M a r-09 22 -J u l-09 21 -N o v -09 D if fe re n ce , °C Date
Difference: Temperature at top of foundation (144) -Temperature at top of ground (145)
Maximum difference ~April 20th every year, coincides with warm outdoor T, no snow, and fin effect bringing heat down into the wall
January 18th 2005, cold snap, -20°C with only 11 cm of snow on ground -enough snow to insulate the ground, but not the foundation wall
Figure 31 – Difference between the temperature at the top of the foundation (T144) and the temperature at the surface of the ground (T145)
Evidence for freezing and thawing of the ground is also apparent in the ground temperature VS air temperature history graphs in Appendix A. The graph for location T145 (at soil level in the far ground) is repeated in Figure 32. The temperature at this location shows dependence on the air temperature history from the past 25 days. In this graph, there is a scattering of points centered about 0°C ground temperature. A
plausible explanation for this scattering is the freezing and thawing of the ground requiring additional energy to change phase, and delaying the response to changes in air temperature. This same effect is seen to a lesser extent in deeper ground
temperature measurement locations (see Figure A-20 to Figure A-26). However, no freeze/thaw scatter is seen for the measurement locations adjacent to the foundation wall. This suggests that the foundation wall conducts heat into and out of the wall and surrounding ground, accelerating response to changes in outdoor temperature, and increasing the speed of freezing and thawing.
y = 0.0147x2+ 0.546x + 2.0165 R² = 0.964 -10 -5 0 5 10 15 20 25 -30 -20 -10 0 10 20 30 40 G ro u n d T e m p e ra tu re , °C
Moving Average Outdoor Air Temperature for past 25 days, °C
Ground Temperature 145 VS Outdoor Air Temperature
The band of data around 0°C ground temperature could indicate freezing/thawing
Figure 32 - Relationship between average daily foundation surface temperature T145 and moving 25 day average of outdoor air temperature
4.7 Potential for Condensation
Cold surface temperatures on the interior of the foundation wall have the potential to lead to condensation if: a) the surface temperature is below the dew point of room air, and b) there is a means for that air to come into contact with the surface.
One year of data, from 01-Jul-08 to 30-Jun-09, was selected for detailed analysis in order to determine the potential for conditions that could lead to condensation. 2008/2009 was chosen due to the fact that this year contained the coldest interior surface temperature event out of the whole analysis period, and recently calibrated
relative humidity data was available for both the onsite exterior and basement
conditions. Hourly temperature and humidity conditions for the 2008/2009 period are shown in Figure 33 and Figure 34 respectively. The indoor air temperature plotted for the basement was measured ~300 mm (1 ft) below the basement ceiling.
The large fluctuations in outdoor relative humidity (Figure 34) are due in large part to fluctuations in outdoor temperature. A plot of absolute humidity in grams of water vapour per kilogram dry air (gv/kgda) provides a better comparison between indoor and
outdoor humidity levels (Figure 35). In summer, the Reference House basement humidity is generally lower than outdoor conditions, due to the removal of humidity from indoor air by the air conditioning system. In winter, the absolute basement humidity is slightly higher than the outdoor humidity. This is due to some added moisture from the actions that are generated by the simulated occupancy system (such as showers, running the dishwasher, etc.). Despite this small amount of moisture generation, indoor winter humidity levels are still very low due to the lack of a humidification system. Health Canada (1987) recommends humidity levels be maintained between 30-55% in winter, unless constrained by window condensation.
-30 -20 -10 0 10 20 30 40 7 -J un -08 19 -J ul -08 30 -Au g -08 11 -O ct -08 22 -N ov -08 3 -J a n -09 14 -F e b -09 28 -M a r-09 9 -M a y -09 20 -J un -09 1 -Aug -09 Te m p e ra tu re , °C
Air Temperature - Outdoor and Basement 2008/2009
Outdoor Basement
0 10 20 30 40 50 60 70 80 90 100 7 -Jun -08 19 -J ul -08 30 -Aug -08 11 -O ct -08 22 -N ov -08 3 -Ja n -09 14 -F e b -09 28 -M a r-09 9 -M a y -09 20 -J un -09 1 -Aug -09 R e la ti v e H u m id it y, %
RH - Outdoor and Basement 2008/2009
Outdoor RH Basement RH
Figure 34 – Hourly outdoor and basement air relative humidity for 2008/2009
0 2 4 6 8 10 12 14 16 18 20 7 -Jun -08 19 -J ul -08 30 -Aug -08 11 -O ct -08 22 -N ov -08 3 -Ja n -09 14 -F e b -09 28 -M a r-09 9 -M a y -09 20 -J un -09 1 -Aug -09 A b so lu te H u m id it y, gv /k gda
Absolute Humidity - Outdoor and Basement 2008/2009
Outdoor Basement
Figure 35 – Hourly outdoor and basement absolute humidity (in grams of water vapour per kg dry air) for 2008/2009
Hourly surface temperatures on the interior of the foundation wall, behind the insulation, are shown in Figure 36. The coldest locations have the greatest potential for
condensation. In summer, the minimum measured temperature is at the base of the foundation wall (T155). Throughout fall, winter and spring, the minimum temperature is at the top of the foundation wall (T168). Temperatures may be lower at locations other than those measured. In winter, locations above ground level (higher up than the location of T168) or in the header area may be even colder.
-10 -5 0 5 10 15 20 25 30 7 -J un -08 19 -J ul -08 30 -Aug -08 11 -O ct -08 22 -N ov -08 3 -J a n -09 14 -F e b -09 28 -M a r-09 9 -M a y -09 20 -J un -09 1 -Aug -09 Te mp e ra tu re , °C Date
Temperature at Interior of Foundation - Behind Insulation
168) Int foundation 0 mm (0 in) 158) Int foundation 390 mm (15.5 in) 157) Int foundation 850 mm (33.5 in) 156) Int foundation 1460 mm (57.5 in) 155) Int foundation 1990 mm (78.5 in)
153 144 154 152 151 168 158 157 156 155 169 170 171 172 173 Minimum temperature in fall/winter/spring at top of foundation Minimum temperature in summer at base of foundation
Figure 36 – Hourly surface temperatures at the interior of the foundation wall, behind the insulation
The coldest measured temperature on the foundation wall is plotted in multiple colours in Figure 37. The colours indicate the location where the coldest temperature occurs. Generally, this line follows the measured temperature at the base of the wall in summer (T155) and the top of the foundation wall in fall, winter and spring (T168). The calculated dew point temperature of the basement air (calculated from measured relative humidity and temperature) is plotted in black. When the minimum foundation temperature drops below the dew point temperature of basement air, there is the potential for condensation. The difference between these two temperatures is shown in Figure 38. A negative difference indicates that the minimum surface temperature is below the dew point temperature. This occurs rarely, for a total of 3.6 days during the 365 day period (~1.0%).
-30 -20 -10 0 10 20 30 11 -J un -08 23 -J ul -08 3 -S e p -08 15 -O ct -08 26 -N ov -08 7 -Ja n -09 18 -F e b -09 1 -Apr -09 13 -M a y -09 24 -J un -09 5 -Aug -09 Te m p e ra tu re , °C
DewPoint Temperature of Basement Air and Minimum Foundation Temperature, 2008/2009
DewPoint Temperature of Basement Air
Minimum Foundation T occurs at 168) Int foundation 0 mm (0 in) Minimum Foundation T occurs at 158) Int foundation 390 mm (15.5 in) Minimum Foundation T occurs at 157) Int foundation 850 mm (33.5 in) Minimum Foundation T occurs at 156) Int foundation 1460 mm (57.5 in) Minimum Foundation T occurs at 155) Int foundation 1990 mm (78.5 in)
Potential for Condensation when minimum foundation temperature dips below the dew point temperature of
basement air (black line) 153 144 154 152 151 168 158 157 156 155 169 170 171 172 173
Figure 37 – Dew point temperature of basement air and minimum interior surface temperature of the foundation (behind the insulation), 2008/2009
-4 -2 0 2 4 6 8 10 12 11 -J un -08 23 -J ul -08 3 -S e p -08 15 -O ct -08 26 -N ov -08 7 -J a n -09 18 -F e b -09 1 -Apr -09 13 -M a y -09 24 -J un -09 5 -Aug -09 Te mp e ra tu re D if fe re n ce ( F o u n d a ti o n S u rf a ce T -B a se me n t A ir D e w P o in t T ), ° C Date
Difference between Basement Air DewPoint temperature and the minimum measured Foundation Wall Surface Temperature
Potential for Condensation when below 0
Figure 38 – Difference between basement air dew point temperature and the minimum measured foundation wall interior surface temperature (behind the insulation)
The research house was not humidified in winter, resulting in dry indoor conditions and low risk for condensation on the interior surface of the concrete foundation wall. However, as shown in Figure 39, the relative humidity of indoor air does not have to be very high in winter in order to have the potential for condensation on the interior of the basement foundation wall (behind the insulation). This figure shows the relative humidity of air at 21°C (the setting of a humidistat on the main floor of the home) that is likely to cause condensation at the coldest measured location on the basement foundation wall. This graph assumes the air from the main floor of the home is circulated to the
basement, and could come into contact with the concrete surface of the basement foundation wall. Throughout the winter months, this threshold was mainly between 20 and 30% RH, dropping as low as 16%. This is below Health Canada’s recommended indoor RH of 30%. 0 10 20 30 40 50 60 70 80 90 100 11 -J un -08 23 -J ul -08 3 -S e p -08 15 -O ct -08 26 -N ov -08 7 -Ja n -09 18 -F e b -09 1 -Apr -09 13 -M a y -09 24 -J un -09 5 -Aug -09 R e la ti ve H u m d it y, %
RH of Air at 21°C that could lead to condensation 2008/2009
Figure 39 – Relative humidity of air at 21°C that could lead to condensation on the interior of the basement foundation wall (behind the insulation)
The calculated dew point temperature of the outdoor air is plotted in black alongside the minimum measured interior surface temperature of the foundation wall (behind the insulation) in Figure 40. The difference between the two curves is plotted in Figure 41. The minimum foundation temperature is below the dew point temperature of outdoor air ~45% of the summer, and ~8% of the time in the remaining months of the year (~17% of the analysis period in total). On these occasions, if the outdoor air entered the basement and came into contact with the surface of the foundation wall at the measurement
location, there would be potential for condensation. For example, outdoor air could enter the basement through an open window, or could enter unconditioned through a
ventilation system. In summer, the air conditioning system dehumidifies the air
(moisture is removed as air conditioner condensate), lowering the dew point of interior air and reducing the potential for condensation.
-30 -20 -10 0 10 20 30 11 -J un -08 23 -J ul -08 3 -S e p -08 15 -O ct -08 26 -N ov -08 7 -Ja n -09 18 -F e b -09 1 -Apr -09 13 -M a y -09 24 -J un -09 5 -Aug -09 D e w P o in t Te m p e ra tu re , °C
DewPoint Temperature of Basement Air and Minimum Foundation Temperature, 2008/2009
DewPoint Temperature of Basement Air
Minimum Foundation T occurs at 168) Int foundation 0 mm (0 in) Minimum Foundation T occurs at 158) Int foundation 390 mm (15.5 in) Minimum Foundation T occurs at 157) Int foundation 850 mm (33.5 in) Minimum Foundation T occurs at 156) Int foundation 1460 mm (57.5 in) Minimum Foundation T occurs at 155) Int foundation 1990 mm (78.5 in)
Potential for Condensation when minimum foundation temperature dips below the dew point temperature of
basement air (black line) 153 144 154 152 151 168 158 157 156 155 169 170 171 172 173
Figure 40 – Dew point temperature of outdoor air and minimum interior surface temperature of the foundation, 2008/2009
-15 -10 -5 0 5 10 15 20 25 30 35 11 -J un -08 23 -J ul -08 3 -S e p -08 15 -O ct -08 26 -N ov -08 7 -J a n -09 18 -F e b -09 1 -Apr -09 13 -M a y -09 24 -J un -09 5 -Aug -09 Te m p e ra tu re D if fe re n ce ( F o u n d a ti o n S u rf a ce T -O u td o o r A ir D e w P o in t T ), ° C Date
Difference between Outdoor Air Dew Point temperature and the minimum measured Foundation Wall Surface Temperature
Potential for Condensation when below 0
Figure 41 – Difference between the outdoor air dew point temperature and the minimum measured foundation wall interior surface temperature (behind the insulation)


![Simulation numérique des écoulements à surface libre dans des canaux à géométrie variable en utilisant le schéma de Beam et Warming [ressource textuelle, sauf manuscrits]](data:image/gif;base64,R0lGODlhAQABAIAAAP///wAAACH5BAEAAAAALAAAAAABAAEAAAICRAEAOw==)