Publisher’s version / Version de l'éditeur:
Electrochemical and Solid-State Letters, 13, 6, pp. B58-B62, 2010-04
READ THESE TERMS AND CONDITIONS CAREFULLY BEFORE USING THIS WEBSITE. https://nrc-publications.canada.ca/eng/copyright
Vous avez des questions? Nous pouvons vous aider. Pour communiquer directement avec un auteur, consultez la première page de la revue dans laquelle son article a été publié afin de trouver ses coordonnées. Si vous n’arrivez pas à les repérer, communiquez avec nous à PublicationsArchive-ArchivesPublications@nrc-cnrc.gc.ca.
Questions? Contact the NRC Publications Archive team at
PublicationsArchive-ArchivesPublications@nrc-cnrc.gc.ca. If you wish to email the authors directly, please see the first page of the publication for their contact information.
NRC Publications Archive
Archives des publications du CNRC
This publication could be one of several versions: author’s original, accepted manuscript or the publisher’s version. / La version de cette publication peut être l’une des suivantes : la version prépublication de l’auteur, la version acceptée du manuscrit ou la version de l’éditeur.
For the publisher’s version, please access the DOI link below./ Pour consulter la version de l’éditeur, utilisez le lien DOI ci-dessous.
https://doi.org/10.1149/1.3355233
Access and use of this website and the material on it are subject to the Terms and Conditions set forth at
Estimation of local relative humidity in cathode catalyst layers of PEFC
Gazzarri, Javier; Eikerling, Michael; Wang, Qianpu; Liu, Zhong-Sheng
https://publications-cnrc.canada.ca/fra/droits
L’accès à ce site Web et l’utilisation de son contenu sont assujettis aux conditions présentées dans le site LISEZ CES CONDITIONS ATTENTIVEMENT AVANT D’UTILISER CE SITE WEB.
NRC Publications Record / Notice d'Archives des publications de CNRC:
https://nrc-publications.canada.ca/eng/view/object/?id=1cca8afe-0591-4ac8-8a1f-cb1c9aa0604e
https://publications-cnrc.canada.ca/fra/voir/objet/?id=1cca8afe-0591-4ac8-8a1f-cb1c9aa0604e
Estimation of Local Relative Humidity in Cathode Catalyst
Layers of PEFC
Javier Gazzarri,a,
*
,zMichael Eikerling,a,b,*
Qianpu Wang,aand Zhong-Sheng Liuaa
National Research Council, Institute for Fuel Cell Innovation, Vancouver, British Columbia V6T 1W5, Canada
b
Department of Chemistry, Simon Fraser University, Burnaby, British Columbia V5A1S6, Canada
A simple method is presented to estimate the local relative humidity 共RH兲 in cathode catalyst layers 共CCLs兲 of polymer electrolyte fuel cells 共PEFCs兲. Based on impedance measurements under different experimental conditions, this technique provides a means to estimate the average value for RH using a correlation with the catalyst layer effective proton resistance. At zero current, a fully humidified anode raises the RH inside the CCL from a nominal 30% to almost 70%. A current density of up to 0.4 A/cm2also
humidifies the cathode, while drying is observed between 0.4 and 1.0 A/cm2.
© 2010 The Electrochemical Society. 关DOI: 10.1149/1.3355233兴 All rights reserved.
Manuscript submitted November 10, 2009; revised manuscript received December 23, 2009. Published April 2, 2010. This was Paper 1017 presented at the Vienna, Austria, Meeting of the Society, October 4–9, 2009.
High proton conductivity in cathode catalyst layers 共CCLs兲 of polymer electrolyte fuel cells 共PEFCs兲 is desirable to ensure a large reaction penetration depth, which in turn enhances catalyst utiliza-tion and overall performance. Sufficiently high proton conductivity relies on an appropriate humidification of the ionomer in the catalyst layer. Several cell phenomena concomitantly take place within the CCL domain, making the local water activity and, thus, proton con-ductivity very difficult to determine accurately. Such phenomena include ionomer humidification from the cathode feed stream, elec-trochemical water production, electro-osmotic drag, vapor diffusion, hydraulic flux of liquid water, and evaporation and condensation processes.
A thorough understanding of water transport in the CCL and its influence on performance lie at the heart of improving the design of the membrane electrode assembly 共MEA兲 that can meet current de-mands for decreasing cost and improving power density and voltage efficiency. Moreover, understanding the conditions for an optimal water balance in the CCL could simplify the overall layout of the fuel cell system. A rather desirable simplification would be the elimination of external gas humidifiers, which would significantly reduce the balance of plant, while demanding sufficient self-humidification of the proton-conducting and porous domains of the MEA.
Under the steady-state operation with fluxes of liquid water and water vapor, as well as water production, relative humidity 共RH兲 should be considered a spatially strongly varying function in the MEA. Equating local RH in the CCL to the humidity in the inlet gas stream is inadequate in the case of different humidification on each side of the membrane, or in the presence of a finite current density. Because direct measurements of the local humidity in the CCLs are not feasible, there is a dire need for a technique that relates the actual RH to a measurable local physical property.
In this article, we present a method to estimate the average RH inside the CCL based on impedance spectroscopy measurements. It exploits the correlation between the proton resistance, water content in the CCL, and water vapor activity. In our approach, we neglect the contribution from the anode to polarization losses. For the sake of simplicity, we assume that there is no temperature gradient across the cell.
This article is organized as follows. First, the impedance data in a hydrogen/nitrogen atmosphere and equally humidified electrodes are analyzed to obtain an estimate of the effective proton resistance of the CCL. This correlation gives a baseline for the relation be-tween effective proton resistance and RH. Second, the measurement is repeated for a dry 共30% RH兲 cathode and an increasingly humid
anode using the same gas feed composition. The measured proton resistance is then used to calculate the average actual humidity based on the previously measured baseline. The method is then ap-plied to PEFC operation at a finite current density under oxygen atmosphere, where capabilities and limitations of the method’s ap-plicability become apparent.
Experimental
The impedance spectra of a PEFC assembly 共Nafion 211 mem-brane, Pt loading of 0.4 mg/cm2, mass ratio of ionomer to carbon
共I/C ratio兲 of 0.79, mass ratio of Pt to Ketjen black carbon of 0.46 were measured under several humidity and current density condi-tions, in nitrogen or oxygen 共cathode side兲 and hydrogen 共anode side兲. The nominal cell temperature was 80°C in all cases, and the flow rates to the anode and cathode were 0.5 and 1.0 L/min, respec-tively. The cell active area was 5 cm2. TableIsummarizes the
hu-midity conditions for all cases.
During the hydrogen/nitrogen experiment, the dc potential was held at 0.45 V to avoid unwanted side reactions such as hydrogen and OH− adsorption–desorption. Before each impedance
measure-ment, the cell conditions were held unchanged for approximately 30 min to ensure a steady state measurement. The total gas pressure on both sides of the cell was 101.3 kPa 共atmospheric兲 at all times.
The method presented here consists of estimating an average humidity within the CCL by measuring its total proton resistance and inferring the actual humidity using a previously determined hu-midity vs resistance relation. This baseline was first obtained by measuring the proton resistance of the CCL under equal humidifi-cation conditions at both the anode and the cathode, in which case it can be assumed that the actual CCL humidity coincides with the externally set RH. Subsequent measurements of resistance under unequal humidity conditions were then used to determine the actual humidity from the baseline data set.
An underlying assumption of this method is that the vaporization–condensation rate is fast compared to other water transport phenomena, allowing us to relate proton resistance directly to RH. In principle, resistivity is a direct function of water content and not of RH. For rapid vaporization–condensation, the relation between RH and water content is given by the sorption isotherm, which can be employed to eliminate water content. Another under-lying assumption is that the proton resistivity in the catalyst layer can be well represented by an effective value. This implies that the variations in the liquid water saturation and, consequently, in the ionomer hydration are moderate. Obviously, the method would work best for constant liquid saturation and rapid vaporization exchange. It would still give a meaningful estimate of the RH in the catalyst layer if the gradient in the liquid water saturation were small in the parts of the layer that make the main contribution to the proton resistance. Current work in our group focuses on water transport
*Electrochemical Society Active Member.
z
phenomena in the CCL, including liquid permeation, vapor diffu-sion, and vaporization exchange under diverse experimental condi-tions. The results of these efforts would provide detailed distribu-tions of liquid water saturation and water vapor in the CCL; they would allow testing the above-mentioned assumptions of quasi equi-librium between liquid and vapor in the CCL. Moreover, the mea-sured impedance was assumed to originate solely at the cathode, with a negligible anode contribution.
Results and Discussion
Cathode humidification at zero current.— The first step toward estimating the local RH using this method is to characterize the CCL in terms of its effective proton resistance. In this work, the term effective proton resistance denotes the proton resistance averaged over the CCL thickness, which depends on the distribution and self-organized structure of the ionomer in the CCL and the degree of liquid saturation. The proton resistance can be found from the im-pedance response of the CCL.1-3
Figure1shows the result of the impedance measurement in a H2
共anode兲–N2 共cathode兲 atmosphere for the 30% setup RH on both
sides of the cell and illustrates the procedure for the estimation of the effective proton resistance of the CCL. When the polarization resistance is much larger than the proton resistance 共as is the case for a H2–N2 experiment兲, the CCL impedance Z can be
approxi-mated by1 Z⬇
冑
R H+ jCdl coth共冑
jCdlRH + 兲Here, RH+ is the average proton resistance 共⍀ cm2兲, C dl is the
double-layer capacitance 共F/cm2兲, and is the angular frequency
共1/s兲. Two distinct regions characterize an impedance spectrum with this functional form a straight line at high frequency, theoretically at 45° with respect to the real axis and representative of proton trans-port, and a vertical line at low frequency, typical of capacitive be-havior. Double-layer charging dominates the high frequency portion, and the impedance dependence on frequency reflects the increasing ac signal penetration depth. Within the low frequency region, the ac signal penetrates the whole catalyst layer thickness; thus, its real part is proportional to the total proton resistance contribution, while its imaginary part reflects almost purely capacitive charge and dis-charge behavior. The real axis intercept of the typical impedance spectrum shown in Fig.1corresponds to the sum of the membrane and electronic resistance contributions and the contact resistances between the MEA layers. The extrapolation of the asymptotic be-haviors in the low and high frequency regions 共straight lines in Fig. 1兲 results in an intercept at intermediate frequencies. The projection of the intercept onto the real axis minus the high frequency intercept 共Fig.1兲, multiplied by 3, constitutes the total proton resistance of the CCL.1,2
Figure2shows the set of resistance data for equal humidifica-tions, namely, 100–100, 70–70, 50–50, and 30–30. Applying the aforementioned procedure to these cases results in four values of CCL effective proton resistance and four values of membrane + other ohmic resistances. These four cases constitute the calibration baseline.
Although, in theory, the low frequency impedance in this experi-ment should be purely capacitive 共a vertical line in the Nyquist diagram兲, a deviation from this ideal state is expected due to the traces of oxygen in the cathode stream, giving rise to a finite dc resistance in the low frequency limit and therefore a deviation from a vertical line within the range of frequencies of interest. Deviations from a 45° angle in the high frequency limit have been attributed to
Table I. Anode and cathode stream humidity for the seven tested cases. T = 80°C. Flow rates: anode, 0.5 L/min and cathode, 1 L/min.
Anode relative humidity 100 70 50 30 100 70 50
Cathode relative humidity 100 70 50 30 30 30 30
-1.0
-0.8
-0.6
-0.4
-0.2
0.0
0.2
0.4
0.0
0.2
0.4
0.6
0.8
1.0
Z' / Ω cm
2Z
''
/
Ω
c
m
230 30
high
freq.
line
low frequency line
R
proton/ 3
R
PEM+
R
ELE+
R
CONTFigure 1. 共Color online兲 Impedance spectrum in H2/N2atmosphere for the
30% inlet RH on both anode and cathode sides, illustrating the method for extracting the proton resistance. The straight lines extrapolating low and high frequency behaviors are determined by visual inspection. The intersection of the line in the high frequency limit with the real axis determines the mem-brane resistance plus electronic and contact resistance contributions, and the real component at the intersection of both lines, minus the high frequency limit, is proportional to the total proton resistance contribution of the CCL.
-1.0 -0.8 -0.6 -0.4 -0.2 0.0 0.0 0.2 0.4 0.6 0.8 1.0 Z' / Ω cm2 Z '' / Ω c m 2 100 100 70 70 50 50 30 30
Figure 2. Impedance in H2/N2atmosphere 共zero dc current兲 under
condi-tions of equal relative humidity on anode and cathode used for the determi-nation of the baseline relation between proton resistance and RH 共TableI, columns 1–4兲. Labels indicate RH 共in percent兲 at anode and cathode.
B59
nonuniformities in the proton resistance4-6and hierarchical branch-ing of pores 共Ref.7, p. 78兲, although it is not clear whether these causes apply to the present case.
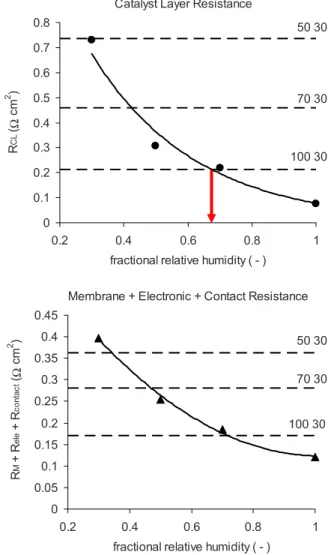
The CCL proton resistance and the bulk resistance of the poly-mer electrolyte membrane 共PEM兲 strongly depend on both the cath-ode and ancath-ode inlet RHs, as shown in Fig. 3a and b. Figure 3a shows the effective catalyst layer proton resistance as a function of RH for the four baseline cases 共쎲兲, and the three horizontal dashed lines indicate the resistance determined for the unequal humidi-fication, as indicated in the plot. Our calculation of the proton resistance agrees well with the results reported in Fig. 8 of Ref. 8 if the resistivity reported in that work 共from 600 ⍀ cm at 35% RH to 100 ⍀ cm at 75% RH for an IC ratio of 0.79兲 is affected by an average nominal thickness of 12 m, resulting in CCL proton resistances from 0.72 ⍀ cm2 at 35% RH
to 0.12 ⍀ cm2 at 75% RH. Similarly, Fig. 3b shows the
resis-tance of the bulk membrane plus other ohmic resisresis-tance contribu-tions共electronic + contact兲 for the baseline cases 共䉱兲 and the cal-culated resistances for 100–30, 70–30, and 50–30 RH as horizontal dashed lines.
The CCL proton resistance decreases with increasing inlet RH on both sides as expected. More remarkably, proton resistance at the cathode also decreases with increasing anode inlet RH when a con-stant 30% humidity is set at the cathode. The latter observation is an indication of a very effective water transport process through the membrane and the cathode. The bulk membrane resistance shows a similar trend.
Estimation of local RH at the CCL at zero current.— The sec-ond step of this method is to estimate the average CCL humidity. The baseline determined by the four equal-humidity cases used to generate Fig.3aand brelates the CCL effective proton resistance 共⍀ cm2兲 and fractional relative humidity x
RH共nondimensional兲 by
an empirical relation
RCL= 1.70 exp共− 3.08xRH兲
These quantities correlate with r2= 0.98 using four data points.
Us-ing the high frequency intercepts, a separate empirical relation is obtained for the membrane + electronic + contact resistance 共⍀ cm2兲
RMEM+ Rele+ Rcont= 0.525xRH2 –1.068xRH+ 0.667
The correlation factor is r2= 0.99 for the four data points. The solid
lines in Fig.3aandbcorrespond to the fitting functions and consti-tute the baseline of our calculation. The unequal anode and cathode RHs correspond to the nonuniform water distributions across the MEA. We assume that, nevertheless, water distributions inside of the PEM and CCL can be presented reasonably well by single effective values. This implies that variations in liquid water saturation inside of each of these media are negligible. The effective liquid water saturation of PEM or CCL corresponds to an effective RH of water vapor that would be in equilibrium with the PEM at the given water content. This effective equilibrium RH deviates from the real pre-vailing RH due to vaporization/condensation fluxes at liquid/vapor interfaces. The effective equilibrium RH value can be determined from the plots in Fig.3; it is given by the intercept between the dashed line, representing the unequal anode/cathode RH conditions, and the baseline, projected onto the real axis. This step is indicated in Fig. 3a, where the arrow indicates the RH calculated at the 100% RHanode/30% RHcathode conditions. Thereafter, the
equilib-rium sorption isotherms of the PEM and CCL could be used to relate the effective equilibrium RH values, thus determined, to liquid water saturations.
TableIIshows the predicted local effective equilibrium RHs for the three nonequal humidifications, both for the CCL 共first row兲 and the membrane 共second row兲. The effective equilibrium RH for a bulk polymer 共second row兲 represents the RH of water vapor that is in equilibrium with the membrane to yield the observed proton re-sistance. It can be related to the real water content in the membrane using the sorption isotherm.
The method suggests the suitability of impedance spectroscopy for the indirect estimation of RH and liquid saturation in compo-nents such as the CCL, inaccessible to a humidity probe. Higher humidification at the anode side incurs a water flux toward the cath-ode, which leads to a rise in the water content at the cathode side of the PEM and an increase in the liquid saturation of the CCL, im-proving the proton conductivity of the latter. The low effective equi-Catalyst Layer Resistance
0 0.1 0.2 0.3 0.4 0.5 0.6 0.7 0.8 0.2 0.4 0.6 0.8 1 fractional relative humidity ( - )
R C L ( Ω cm 2 ) 100 30 70 30 50 30
Membrane + Electronic + Contact Resistance
0 0.05 0.1 0.15 0.2 0.25 0.3 0.35 0.4 0.45 0.2 0.4 0.6 0.8 1 fractional relative humidity ( - )
R M+R e le+R co n ta ct ( Ω cm 2 ) 100 30 70 30 50 30
Figure 3. 共Color online兲 共a兲 Average proton resistance of the CCL and 共b兲
membrane resistance plus electronic and contact resistances as a function of RH 共equilibrated conditions兲. The solid lines constitute the baseline used to estimate apparent local RH for a given value of proton resistance. Horizontal dashed lines indicate experimentally determined resistances of PEM and CCL, respectively, for cases with different RHs on both sides 共RHanodeand
RHcathode, specified in the labels兲; projection of intercepts between horizontal lines and relevant baseline onto the abscissa provide effective equilibrium RHs for 共a兲 PEM and 共b兲 CCL. The arrow in 共a兲 points at the local average humidity corresponding to 100/30.
Table II. Predicted RH inside the CCL and effective RH in equi-librium with the membrane for a nominal 30% cathode RH.
These three cases correspond to the cases in TableIwith unequal
humidity conditions.
Anode stream RH 50 70 100
Local RH in the CCL 27 43 68 RH in equilibrium with the membrane 34 47 71
librium RH of 27% in the first row of TableII, which lies below the nominal cathode RH equal to 30%, is due to the error associated with this method共⫾5%兲. This estimation for the method’s uncer-tainty was done choosing two extreme cases of pair of points defin-ing the low frequency asymptotic line shown in Fig.1. Results con-firm that the effective equilibrium RH and thus the real liquid saturation in the CCL depend strongly on the anode RH and the water transport properties of the PEM. A fully humidified anode and a highly water-permeable membrane can keep the cathode in a well-humidified state, even at low nominal RH on the cathode side. This is especially so for thin共⬃10 m兲 membrane electrolytes, which minimize the membrane bulk resistance to water crossover. The similarity between the effective equilibrium RH values for the PEM and CCL 共row 1 vs row 2 in TableII兲 indicates a facile liquid water transport in the ionomer and the pores of the catalyst layer. More-over, this finding suggests that the resistance to liquid water trans-port at the PEM/CCL interface is negligible.
Catalyst layer RH estimation at nonzero current density.— A case of interest for the application of this method is that of finite current density because water is produced and transported across the layers of the MEA as a consequence of this current. We repeated the impedance measurement in H2/O2at current densities ranging
be-tween 0.02 and 1.6 A/cm2. The procedure herein described is
di-rectly applicable to H2/air. When current density is not close to zero,
the impedance spectrum has a semicircular or half teardrop shape as a result of the interplay between charge and mass transport resis-tances of the composite media and the faradaic resistance of the oxygen reduction reaction 共ORR兲. Increasing the cell current density decreases the proton resistance by humidification of the ionomer and also results in a reduction of the ORR faradaic resistance. As a consequence, the reaction penetration depth, or catalyst layer utili-zation, decreases with increasing current density. This results not only in a decrease in the size of the impedance arc, but also in the gradual disappearance of the transition point between the 45° straight line regime at high frequency 共Cdlcharging regime兲 and the
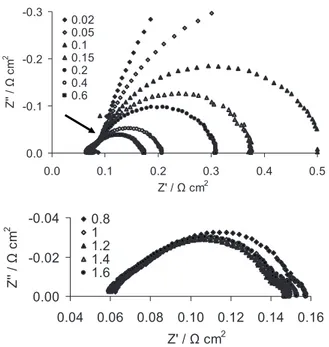
semicircular regime at medium to low frequency 共ORR dominated regime兲. Figure4exemplifies this statement showing the impedance
measured in H2/O2and fully humidified inlet gases. The arrow in
Fig.4aindicates the approximate transition frequency at which the impedance changes from the Cdlregime to the ORR regime. The
legend indicates the current density in A/cm2. In this case, the
tran-sition current density is approximately 0.4 A/cm2. Above this
cur-rent density, there is no observable slope change in the Nyquist plot of the impedance between the two regimes described above, reflect-ing a signal penetration depth smaller than the catalyst layer thick-ness.
If this transition is not apparent 共e.g., Fig.4b兲, the proton resis-tance needs to be estimated in some other way. As reported by Eikerling and Kornyshev in Ref.1, the impedance at high frequency depends on proton resistance and double-layer capacitance with this functional form
Z →⬁⬇
冑
RH+ jCdl
This relation means that proton resistance may be calculated if Cdlis
known by other means. If we assume that Cdlremains constant with
current density, we can easily estimate RH+using, for example, the
imaginary part of the equation above 共only valid at high frequency兲 and the Cdlcalculated at the RH values used to construct the
cali-bration baseline using the H2/N2data
Im共 Z →⬁兲 ⬇
冑
RH+ 2Cdl ⇒RH+= 2Cdl关Im共 Z →⬁兲兴 2TableIII shows the four capacitance values calculated in this way. Once the average Cdlis known at each humidity condition, we can
estimate the proton resistance using the equation shown above. Figure5shows the average proton resistance of the catalyst layer
-0.3 -0.2 -0.1 0.0 0.0 0.1 0.2 0.3 0.4 0.5 Z' / Ω cm2 Z '' / Ω c m 2 0.02 0.05 0.1 0.15 0.2 0.4 0.6 -0.04 -0.02 0.00 0.04 0.06 0.08 0.10 0.12 0.14 0.16 Z' / Ω cm2 Z '' / Ω c m 2 0.81 1.2 1.4 1.6
Figure 4.Impedance spectra at different current densities 共legend, in A/cm2兲
for the case of H2 共anode兲/O2 共cathode兲, both at 100% RH. 共a兲
0.02–0.6 A/cm2. Although the overall impedance spectrum shape shows
strong dependence on current density, the high frequency linear region re-mains largely unchanged. The arrow shows the transition from the double-layer charging regime to the ORR regime. 共b兲 0.8–1.6 A/cm2.
Table III. Total double-layer capacitance „FÕcm2… as a function of
inlet RH (the same at both electrodes) for H2ÕN2, determined via
RH+using the method shown in Fig.1.
RH 共%兲 30 50 70 100 Cdl 0.0225 0.0223 0.0284 0.0288 0.0 0.1 0.2 0.3 0.4 0.5 0.6 0.7 0.8 0.9 0 0.2 0.4 0.6 0.8 1 1.2 1.4 1.6 j (A/cm2) RC L ( Ω cm 2) H2 O2 RH100 H2 O2 RH70 H2 O2 RH50 H2 O2 RH30 H2 O2 RH50 30 H2 O2 RH70 30 H2 O2 RH100 30
Figure 5.Catalyst layer resistance measured in H2/O2atmosphere as a
func-tion of current density. Legend indicates the RH of the feed gas stream. RH Xmeans X% RH on both sides. RH X Y means X% RHanodeY% RHcathode. Especially at low cathode RH conditions, the measured RH decreases up to 0.4 A/cm2likely because of water production at the cathode and then
in-creases and levels off.
B61
as a function of current density for differently humidified gas streams 共legend兲 estimated using this method. The average CCL proton resistance decreases between 0 and 0.4 A/cm2and then
in-creases again to different degrees depending on the humidification conditions. The decrease is most likely the result of self-humidification due to electrochemical water production. We attribute the subsequent increase to an increase in temperature, as explained in the next paragraph.
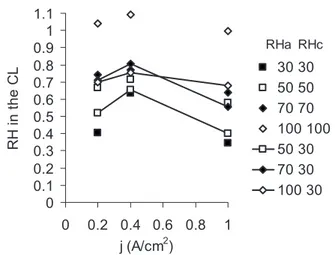
Using the baseline described in the previous section, along with these proton resistance values, we calculated the effective equilib-rium RH in the CCL, now as a function of both gas stream humidity 共legend兲 and current density. Figure6shows how the effective equi-librium RH varies with the current density for all tested gas feed humidity conditions. At current densities in the range of 0–0.4 A/cm2, the calculated effective equilibrium RH increases due
to water production. The effective equilibrium RH decreases beyond 0.4 A/cm2for all the cases considered here. The corresponding
de-crease in the liquid saturation at higher current densities can be attributed to a balance between humidification due to water genera-tion and drying due to temperature increase. At 80°C 共psat
= 47.3 kPa兲, it takes a temperature rise of ⬃10°C to increase psat
by 50%, roughly the increase needed to decrease RH from 60 to 40%. These results are important for the performance of the experi-ments because they indicate that there are several ways in which the catalyst layer humidity may deviate from the set point humidity.
Conclusions
A method is presented to estimate the local effective equilibrium RH and thus the liquid water saturation inside a CCL using imped-ance spectroscopy. It is applicable for the practically important case of different nominal RHs on the anode and cathode sides of the MEA. Results indicate that within the method’s uncertainty, the ef-fective equilibrium RH and thus the saturation level on the cathode side are significantly higher than the values corresponding to the nominal 共externally provided兲 RH at the cathode. Due to the highly efficient liquid water transport in the PEM and CCL, the RH in the CCL is strongly dependent on the anode RH. At zero current density, nominal RHs of 100% at the anode and 30% at the cathode yielded an effective equilibrium RH of 68% in the CCL and at the CCL/ PEM interface. In the presence of a finite current density, the calcu-lated CCL humidity increases over the range of 0 and 0.4 A/cm2
due to water production and then decreases presumably due to the competing effects of water production and temperature rise. It is important to consider these effects when performing experiments controlling humidity by setting the gas feed humidity, because the real liquid water saturation may differ significantly from the value that corresponds to the set RH.
Acknowledgments
J.G. is grateful to Makoto Adachi and Dr. Jennifer Peron for fruitful discussions.
National Research Council of Canada assisted in meeting the publication costs of this article.
References
1. M. Eikerling and A. A. Kornyshev, J. Electroanal. Chem., 475, 107 共1999兲. 2. R. Makharia, M. Mathias, and D. Baker, J. Electrochem. Soc., 152, A970 共2005兲. 3. M. Eikerling, A. A. Kornyshev, and A. A. Kulikovsky, in Encyclopedia of
Elec-trochemistry 5, Chap. 8.2, D. D. Macdonald and P. Schmuki, Editors, pp. 447–543, VCH-Wiley, Weinheim 共2007兲.
4. M. Lefebvre, R. Martin, and P. Pickup, Electrochem. Solid-State Lett., 2, 259 共1999兲.
5. G. Li and P. Pickup, J. Electrochem. Soc., 150, C745 共2003兲. 6. X. Ren and P. Pickup, Electrochim. Acta, 46, 4177 共2001兲.
7. J. R. MacDonald and E. Barsoukov, Impedance Spectroscopy, 2nd ed., p. 58, John Wiley & Sons, New York 共2005兲.
8. Y. Liu, M. Murphy, D. Baker, W. Gu, C. Ji, J. Jorne, and H. Gasteiger, J.
Electro-chem. Soc., 156, B970 共2009兲. 0 0.1 0.2 0.3 0.4 0.5 0.6 0.7 0.8 0.9 1 1.1 0 0.2 0.4 0.6 0.8 1 j (A/cm2) R H in th e C L 30 30 50 50 70 70 100 100 50 30 70 30 100 30 RHa RHc
Figure 6.Calculated RH at the CCL for different gas stream humidifications
共legend兲 at 0.2, 0.4, and 1.0 A/cm2. H
2共anode兲/O2共cathode兲 atmosphere.
Although RH shows an initial increase, it decreases from 0.4 to 1.0 A/cm2