HAL Id: hal-00296939
https://hal.archives-ouvertes.fr/hal-00296939
Submitted on 6 Feb 2006
HAL is a multi-disciplinary open access
archive for the deposit and dissemination of
sci-entific research documents, whether they are
pub-lished or not. The documents may come from
teaching and research institutions in France or
abroad, or from public or private research centers.
L’archive ouverte pluridisciplinaire HAL, est
destinée au dépôt et à la diffusion de documents
scientifiques de niveau recherche, publiés ou non,
émanant des établissements d’enseignement et de
recherche français ou étrangers, des laboratoires
publics ou privés.
The variation of floods in the middle reaches of the
Yangtze River and its teleconnection with El Niño
events
Y.-J. Wu, W. A. Gough, T. Jiang, H.-T. Kung
To cite this version:
Y.-J. Wu, W. A. Gough, T. Jiang, H.-T. Kung. The variation of floods in the middle reaches of
the Yangtze River and its teleconnection with El Niño events. Advances in Geosciences, European
Geosciences Union, 2006, 6, pp.201-205. �hal-00296939�
Advances in Geosciences, 6, 201–205, 2006 SRef-ID: 1680-7359/adgeo/2006-6-201 European Geosciences Union
© 2006 Author(s). This work is licensed under a Creative Commons License.
Advances in
Geosciences
The variation of floods in the middle reaches of the Yangtze River
and its teleconnection with El Ni ˜no events
Y.-J. Wu1, W. A. Gough2, T. Jiang3, and H.-T. Kung4
1School of Urban And Environmental Sciences, Central China Normal University, Wuhan 430079, China
2Environmental Science, University of Toronto at Scarborough, 1265 Militaty Trail, Scarborough, Ontario, M1C 1A4, Canada 3Nanjing Institute of Geography and Limnology, CAS, Nanjing 210008, China
4Department of Earth Sciences, The University of Memphis, Memphis, Tennessee 38152, USA
Received: 7 July 2005 – Revised: 26 January 2006 – Accepted: 26 January 2006 – Published: 6 February 2006
Abstract. Middle reaches of the Yangtze River are the worst flooded segments along the Yangtze River. It is important to understand and study the variations of frequency and mag-nitude of historical floods in this area and how were they re-lated to or affected by EI Ni˜no in a long historical period. We applied the statistics and time series to study and analyze his-torical floods (1470–2000) and EI Ni˜no events (1525–1995). The results show that the more floods occurred in the latest 200 years. The power-spectral analysis suggests the main cy-cle of flood variation is longer than that of EI Ni˜no events. El Nino shows the fluctuations of about 2-year and 3∼4 year pe-riod while the flood variation is not so significant but can also be identified in the period of 2, 8 and 40 years (it exceeds the level of confidence 0.03). Time series analyses of the fluctu-ation of flood and El Nino indicate that there is a significant correlation between the two at both high and moderate fre-quency sections. The result shows that the response of the floods along the middle reaches of the Yangtze River to the effects of El Nino events is not only delayed one or more than one year as suggested by many Chinese scientists, but it also can be somewhat longer delayed up to about 8 years. The result also indicates that the shorter the interval of EI Ni˜no events, the sooner the flood events follows. In other words, flood could be delayed with longer time if the interval time of EI Ni˜no events is longer.
1 Introduction
As the third largest river in the world and the largest one in China, the Yangtze River is very important to human society in China. It reflects the Chinese history and prosperity and development of Southern China. Since ancient times, people in the Yangtze Rive basin have suffered from and fighting
Correspondence to: Y. Wu
(wuyijin@public.wh.hb.cn)
against flood disasters from generation to generation. It has long been known as “China’s sorrow” for the lives that have lost and properties have been damaged by the frequent and violent floods.
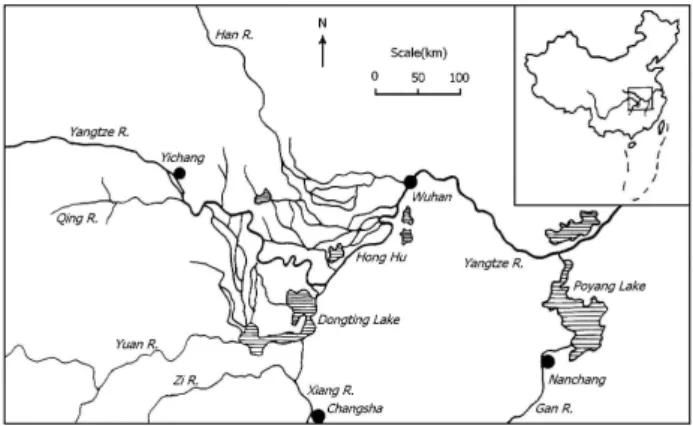
Originating in Tibetan Plateau, the river flows eastward through central China on its way to Donghai (East China Sea) in Shanghai on China’s east coast (Fig. 1). In its middle section, it passes through the immense Jianghan Plains from Yichang to Wuhan, named Jing-Jiang. Because of the limited capacity of flood discharge, this region is the worst flood-ing area of the whole Yangtze River. For instance, the ca-pacity of flood discharge in Jing-Jiang is about 60 000 m3/s. However, there were an estimated 108 disastrous breaks in the river embankments across the Jing-Jiang reaches from 1525 AD to 1995 AD and more than 24 years in which flood discharges have exceeded this capacity after 1892 (Table 1), causing great damage.
The extreme flood discharges were caused by heavy rain-fall in the upper reaches of the Yangtze River valley. It is commonly known that the climate of China is strongly in-fluenced by the East Asian monsoon. The primary physical manifestation of the summer monsoon is persistent, heavy precipitation identified as a coherent and well-defined rain-band. Because of the variations in monsoons, the rainband has inter-annual variability anomalies over the Yangtze River valley that causes yearly rainfall totals to fluctuate greatly, especially rainfall during the flooding season.
El Ni˜no is a recurring pattern of climate variability in the eastern equatorial Pacific that is characterized by anomalies with warming periods of sea-surface temperature. As the re-markable connective signal between the entire near-global-scale climatic change and sea-surface temperature, EI Ni˜no events profoundly affect the regional climate. There have been thus far many studies on EI Ni˜no and its relation to global and regional climates through atmospheric circulation (Chang et al., 2001). And also recent research shows that EI
202 Y. Wu et al.: The variation of floods in the middle reaches of the Yangtze River
2
there were an estimated 108 disastrous breaks in the river embankments across the Jing-Jiang reaches from 1525 AD to 1995 AD and more than 24 years in which flood discharges have exceeded this capacity after 1892(Table 1), causing great damage.
Figure 1 The middle reaches of the Yangtze River basin
Table 1 Extreme Flood Discharges At Yichang Station After 1892 (Discharge: m3/s)
Year Discharge Year Discharge Year Discharge Year Discharge 1892 64,600 1917 61,000 1931 64,600 1954 66,800 1896 71,100 1919 61,700 1936 62,300 1958 60,200 1898 60,600 1920 61,500 1937 61,900 1974 61,600 1905 64,400 1921 64,800 1938 61,200 1981 70,800 1908 61,800 1922 63,000 1945 67,500 1989 61,800 1909 61,100 1926 60,800 1946 62,100 1998 63,600 The extreme flood discharges were caused by heavy rainfall in the upper reaches of the Yangtze River valley. It is commonly known that the climate of China is strongly influenced by the East Asian monsoon. The primary physical manifestation of the summer monsoon is persistent, heavy precipitation identified as a coherent and well-defined rainband. Because of the variations in monsoons, the rainband has inter-annual variability anomalies over the Yangtze River valley that causes yearly rainfall totals to fluctuate greatly, especially rainfall during the flooding season.
El Niño is a recurring pattern of climate variability in the eastern equatorial Pacific that is characterized by anomalies with warming periods of sea-surface temperature. As the remarkable connective signal between the entire near-global-scale climatic change and sea-surface temperature, EI Niño events profoundly affect the regional climate. There have been thus far many studies on EI Niño and its relation to global and regional climates through atmospheric circulation (C.-P. Chang, Patrick Harr, and Jianhua Ju, 2001). And also recent research shows that EI Niño Events has some effect on regional long-term precipitation in China.
Biography: Wu Yijin (1963-), Male, Dr. Prof, Email: wuyijin@public.wh.hb.cn
Fig. 1. The middle reaches of the Yangtze River basin.
Ni˜no Events has some effect on regional long-term precipi-tation in China.
2 Data resource and process
Quinn and Neal (1992) has presented the data about the strength of EI Ni˜no events. They identified, evaluated, and examined many detailed reports from sailing vessel logs, di-aries of conquistadors and their entourages, missiondi-aries, pi-rates, privateers, historians, geographers, engineers, geolo-gists, hydrologeolo-gists, newspapers, and scientists. They pro-vided a rather broad and extensive information on areas di-rectly affected by EI Ni˜no and areas affected by other unusual conditions related to EI Ni˜no (e.g. the droughts that often af-fect southeastern Peru and adjacent parts of Bolivia during an EI Ni˜no) in the period of 1525 to 1987. Historical EI Ni˜no Events Data and the strength of EI Ni˜no events are classified into several categories, that is, very strong (VS), strong (S), and moderate (M). Among them, the S+, M+ and M− are added to supplement those EI Ni˜no events whose intensities are not in the standard categories. For the compound type of activity over the distant past, the signals of M/S or M−/M+ are used to cover two events of different intensities.
For quantitative purposes, those categories are tabulated in as shown in Table 2.
Trenberth (1997) defined the EI Ni˜no Event as 5-month running averages of sea surface temperature (SST) anoma-lies in the El Ni˜no 3.4 region (5◦N–5◦S, 120◦–170◦W) ex-ceeding 0.4◦C for 6 months or more. We find this definition matches very well with W.H.Quinn’s for their common years during modern time. Therefore, the EI Ni˜no events time se-ries defined by W.H.Quinn is extended to 1995 by adding the EI Ni˜no events 1991∼1992, 1993 and 1994∼1995 derived from Kevin E. Trenberth’s results.
As is probably well know, the Chinese have the best and most complete phonological records that exist (Rosenberg, 1982). During the Ming and Ch’ing dynasties from the 15th through the 18th centuries, Chinese regional geographical records (gazette) were carefully reviewed so that archives of historical floods, droughts, and many other climatic events
are now available for this study. In this paper, historical flood data are derived from “flood and drought distribution atlas
of China in the last 500 years” (China Central Meteorology
Bureau, 1989) . Data have been compiled and sorted for the selected stations in the middle reaches of Yangtze Rive such as Yichang, Jingzhou, Yueyang, and Wuhan. These data are relative complete and continuous. The location of these sta-tions are well distributed and they are in the proximity to flood-sever areas. The data are extended to modern time by methods used in above atlas and converted into rainfall by the method proposed by Anyuan et al. (1999). Therefore, both frequency and magnitude of floods and total amount of rainfall are calculated to check the data consistency.
The flood data used in this paper are from 1470 to 2000 and spatially weighted using Thiessen polygons method (Linsley et al., 1975) to create a “middle reaches of Yangtze River basin” flood index for each year.
3 Calculation and analysis
In this paper, we attempt to study the variation and fluctuat-ing of both floods in the middle reaches of the Yangtze River and EI Ni˜no events, and the relationships between the two based on some historical data by using statistic methods and time series analysis.
3.1 The variation/cycle of historical floods
By using the following model, the flooding indexes of the middle reaches of the Yangtse River are calculated to analyze the variation of floods.
If = 4 P i=1 (n1i+n2i) +3 4 P i=1 Ni+10
Where If is the flooding index of each 10-year period. n1i
and n2iare the number of flood (degree 1) and extreme flood
(degree 2) years respectively for the interval of 10 years. For the historical period, the degree of flooding is dependent on the damage described in historical documents (China Cen-tral Meteorology Bureau, 1989). Ni is the total number of
recorded years for the interval of 10 years. Since the his-torical yearly records are not always in succession, the value of Ni is sometimes not exactly equal to 10. i represents the
calculated station. The results are shown in Table 3.
It can be seen from Table 3 that most of more flood periods appears in the last 200 years. In order to understand this more easily, Fig. 2 is presented below based on the values from Table 3.
It is clear in Fig. 2 that with time both lower and higher points of index line show a steady rise. This is also reflected in the floating average line. It shows that there are two waves during the 330 years of 1470∼1800. The amplitude of the two waves is not very large, which indicates less flooding events with milder variation during this period. However, the
Y. Wu et al.: The variation of floods in the middle reaches of the Yangtze River 203
Table 1. Extreme Flood Discharges At Yichang Station After 1892 (discharge: m3/s).
Year Discharge Year Discharge Year Discharge Year Discharge 1892 64 600 1917 61 000 1931 64 600 1954 66 800 1896 71 100 1919 61 700 1936 62 300 1958 60 200 1898 60 600 1920 61 500 1937 61 900 1974 61 600 1905 64 400 1921 64 800 1938 61 200 1981 70 800 1908 61 800 1922 63 000 1945 67 500 1989 61 800 1909 61 100 1926 60 800 1946 62 100 1998 63 600
Table 2. Intensity categories of historical EI Ni˜no events and corresponding numeric value.
categories very strong(VS) S+ strong (S) M+ moderate (M) M− M/S M−/M+
digital 3 2.5 2 1.5 1 0.5 0.5 0.3
4
3.1 The Variation/Cycle of Historical Floods
By using the following model, the flooding indexes of the middle reaches of the Yangtse River are calculated to analyze the variation of floods.
Where If is the flooding index of each 10-year period. n1i and n2i are the number of flood
(degree 1) and extreme flood (degree 2) years respectively for the interval of 10 years. For the historical period, the degree of flooding is dependent on the damage described in historical documents (China Central Meteorology Bureau, 1989). Ni is the total number of recorded years for
the interval of 10 years. Since the historical yearly records are not always in succession, the value of Ni is sometimes not exactly equal to 10. i represents the calculated station. The results are shown in
Table 3.
Table 3 Index of Yangtse River's Flood Since 1470s
Year Index Year Index Year Index Year Index Year Index 1470s 0.263 1580s ●0.067 1690s ●0.156 1800s ●0.111 1910s ▲0.378 1480s 0.053 1590s ▲0.371 1700s ▲0.435 1810s 0.180 1920s 0.258 1490s 0.200 1600s 0.342 1710s 0.261 1820s 0.340 1930s ▲0.583 1500s 0.167 1610s 0.222 1720s 0.333 1830s ▲0.560 1940s 0.308 1510s 0.222 1620s ●0.116 1730s ●0.080 1840s ▲0.380 1950s 0.347 1520s 0.211 1630s 0.227 1740s ▲0.380 1850s 0.220 1960s 0.280 1530s 0.196 1640s ●0.120 1750s ●0.160 1860s ▲0.420 1970s 0.180 1540s ●0.149 1650s 0.298 1760s 0.304 1870s 0.178 1980s ▲0.460 1550s 0.231 1660s 0.357 1770s ●0.140 1880s 0.200 1990s ▲0.500 1560s ▲0.400 1670s 0.240 1780s 0.326 1890s 0.279 1570s ▲0.455 1680s 0.220 1790s 0.184 1900s 0.311
(The symbol "▲" stands for the period of more floods, while "●" stands for the period of less floods)
It can be seen from Table 3 that most of more flood periods appears in the last 200 years. In order to understand this more easily, Figure 2 is presented below based on the values from Table 3.
Figure 2 The Variation Of Flooding Index (If) Since 1470s (* Floating Average Line)
It is clear in Figure 2 that with time both lower and higher points of index line show a steady rise.
( ) ∑ ∑ = = + + + = 4 1 4 1 1 2 10 3 i i i i i f N n n I
Fig. 2. The variation of flooding index (If)since 1470s (* floating average line).
floating average line has risen sharply since 1800. Within the 200 years since, there are more than two waves and the amplitude of them is larger than those before 1800, which shows that not only are floods more concentrated than before but also the interval time between floods is shorter. It also displays we are currently at the beginning of the third wave, which indicates that there will be more flooding disasters in the near future.
To analyze the cycles of historical floods, power-spectral analysis was applied to each of the members of floods series. The maximum lag (k) in the analysis was set at 80 years. The computational procedure is the same as outlined in WMO’s Technical Note on climate change (1966).
The result of smoothed power-spectral for floods (Fig. 3) shows the highest peaks of power-spectral occurs at k=65, 19 and 4, exceeding 0.02, 0.03 and 0.01 degree of confidence respectively. That turns out the time series of the Yangtze floods have the cycles of about 2-year, and 8, and 40 years.
5
This is also reflected in the floating average line. It shows that there are two waves during the 330 years of 1470~1800. The amplitude of the two waves is not very large, which indicates less flooding events with milder variation during this period. However, the floating average line has risen sharply since 1800. Within the 200 years since, there are more than two waves and the amplitude of them is larger than those before 1800, which shows that not only are floods more concentrated than before but also the interval time between floods is shorter. It also displays we are currently at the beginning of the third wave, which indicates that there will be more flooding disasters in the near future.
To analyze the cycles of historical floods, power-spectral analysis was applied to each of the members of floods series. The maximum lag (k) in the analysis was set at 80 years. The computational procedure is the same as outlined in WMO’s Technical Note on climate change (1966).
The result of smoothed power-spectral for floods (Figure 3) shows the highest peaks of power-spectral occurs at k=65, 19 and 4, exceeding 0.02, 0.03 and 0.01 degree of confidence respectively. That turns out the time series of the Yangtze floods have the cycles of about 2-year, and 8, and 40 years.
3.2 Cycles of EI Niño Events And Its Teleconnection With The Yangtze Floods
Same as the analysis of historical floods, The power-spectral for EI Niño events was also calculated and shown in Figure 4, which reveals that the highest peaks of power-spectral occurs at k=78, 48 and 41, all of which exceed 0.01degree of confidence. This simply means that the time series of EI Niño events have the cycles of about 2-year, and 3~4 years. This result is a little more convergent than that of Amy Clement and colleagues of the Lamont-Doherty Earth Observatory in
0 0. 01 0. 02 0. 03 0. 04 1 7 13 19 25 31 37 43 49 55 61 67 73 79
T he num ber of lag
F igure 4 T he res ult of pow er s pec trum for E I N iño E vents
Po we r s pe ct ru m 0 0. 02 0. 04 0. 06 1 7 13 19 25 31 37 43 49 55 61 67 73 79
The number of lag
Figure 3 The result of power spectrum for floods
P ow er s pec tr um
Fig. 3. The result of power spectrum for floods.
5
This is also reflected in the floating average line. It shows that there are two waves during the 330 years of 1470~1800. The amplitude of the two waves is not very large, which indicates less flooding events with milder variation during this period. However, the floating average line has risen sharply since 1800. Within the 200 years since, there are more than two waves and the amplitude of them is larger than those before 1800, which shows that not only are floods more concentrated than before but also the interval time between floods is shorter. It also displays we are currently at the beginning of the third wave, which indicates that there will be more flooding disasters in the near future.
To analyze the cycles of historical floods, power-spectral analysis was applied to each of the members of floods series. The maximum lag (k) in the analysis was set at 80 years. The computational procedure is the same as outlined in WMO’s Technical Note on climate change (1966).
The result of smoothed power-spectral for floods (Figure 3) shows the highest peaks of power-spectral occurs at k=65, 19 and 4, exceeding 0.02, 0.03 and 0.01 degree of confidence respectively. That turns out the time series of the Yangtze floods have the cycles of about 2-year, and 8, and 40 years.
3.2 Cycles of EI Niño Events And Its Teleconnection With The Yangtze Floods
Same as the analysis of historical floods, The power-spectral for EI Niño events was also calculated and shown in Figure 4, which reveals that the highest peaks of power-spectral occurs at k=78, 48 and 41, all of which exceed 0.01degree of confidence. This simply means that the time series of EI Niño events have the cycles of about 2-year, and 3~4 years. This result is a little more convergent than that of Amy Clement and colleagues of the Lamont-Doherty Earth Observatory in
0 0. 01 0. 02 0. 03 0. 04 1 7 13 19 25 31 37 43 49 55 61 67 73 79
T he num ber of lag
F igure 4 T he res ult of pow er s pec trum for E I N iño E vents
Po we r s pe ct ru m 0 0. 02 0. 04 0. 06 1 7 13 19 25 31 37 43 49 55 61 67 73 79
The number of lag
Figure 3 The result of power spectrum for floods
P ow er s pec tr um
Fig. 4. The result of power spectrum for EI Ni˜no events.
3.2 Cycles of EI Ni˜no events and its teleconnection with the Yangtze floods
Same as the analysis of historical floods, The power-spectral for EI Ni˜no events was also calculated and shown in Fig. 4, which reveals that the highest peaks of power-spectral occurs at k=78, 48 and 41, all of which exceed 0.01 degree of con-fidence. This simply means that the time series of EI Ni˜no events have the cycles of about 2-year, and 3∼4 years. This result is a little more convergent than that of Amy Clement and colleagues of the Lamont-Doherty Earth Observatory in Palisades, New York (2001). They say that ENSO occurs roughly every two to seven years as a result of heat and en-ergy exchanging between the atmosphere and the oceans.
The cross-spectral was calculated to analyze the relation-ship between the power-spectrums of EI Ni˜no events and the
204 Y. Wu et al.: The variation of floods in the middle reaches of the Yangtze River
Table 3. Index of Yangtse River’s flood since 1470s.
Year Index Year Index Year Index Year Index Year Index 1470s 0.263 1580s •0.067 1690s •0.156 1800s •0.111 1910s N0.378 1480s 0.053 1590s N0.371 1700s N0.435 1810s 0.180 1920s 0.258 1490s 0.200 1600s 0.342 1710s 0.261 1820s 0.340 1930s N0.583 1500s 0.167 1610s 0.222 1720s 0.333 1830s N0.560 1940s 0.308 1510s 0.222 1620s •0.116 1730s •0.080 1840s N0.380 1950s 0.347 1520s 0.211 1630s 0.227 1740s N0.380 1850s 0.220 1960s 0.280 1530s 0.196 1640s •0.120 1750s •0.160 1860s N0.420 1970s 0.180 1540s •0.149 1650s 0.298 1760s 0.304 1870s 0.178 1980s N0.460 1550s 0.231 1660s 0.357 1770s •0.140 1880s 0.200 1990s N0.500 1560s N0.400 1670s 0.240 1780s 0.326 1890s 0.279 1570s N0.455 1680s 0.220 1790s 0.184 1900s 0.311
The symbol ”N” stands for the period of more floods, while ”•” stands for the period of less floods.
6
Palisades, New York (2001). They say that ENSO occurs roughly every two to seven years as a result of heat and energy exchanging between the atmosphere and the oceans.
The cross-spectral was calculated to analyze the relationship between the power-spectrums of EI Niño events and the Yangtze floods. The results (see Figure 5) shows that there are three frequencies at which the significant correlation of those two time series excess 0.01 level at the peaks of k=20, 26 and 80 respectively. From that, it can be concluded that the responding of the floods in the middle reaches of the Yangtze River to EI Niño events happens not only at high frequency, but also at moderate frequencies (See Table 4). In other words, the floods in the middle reaches of the Yangtze River might occur not only in the following year of EI Niño events, but also as long as 8 years delay. The result also indicates that the shorter the interval between EI Niño events occurred, the sooner the following flood would happen. On the other side, delay time of flood will be longer when the interval of EI Niño events is extended.
Table 4 Coincidence Coagulation Function Peaks With Different Periods
Harmonic Value k) 20 26 80 Period (year) 8 6 2
4. Conclusions and discussion
At the moment, flood risk appears to be on the rise again, witnessing the series of floods of the last 20 years and the serious flood in 1998. Since it is now recognized that flood control does not meet its requirements, strengthening of flood control is underway. The most highlight event is the project of three gorges that will be taken its role in 2009. However, climate change will be still regarded in flood control. The variation and cycles of historical floods analyzed since 1470 in this paper show the floods may be frequent events, especially in the near future.
The cross-spectral analysis for the cycle of the Yangtze floods and El Nino events indicate that there is a significant correlation between the two at both high and moderate frequency sections. The result shows that the response of the floods along the middle reaches of the Yangtze River to the effects of El Nino events is not only delayed one or more than one year as suggested by many Chinese scientists, but it also can be somewhat longer delayed up to about 8 years. The result also indicates that the shorter the interval of EI Niño events, the sooner the flood events follows. In other words, flood could be delayed with longer time if the interval time of EI Niño events is longer.
Just as Jacobs Ga, et.al (1994) demonstrated that significant local effects of El Nino events in the
0 0. 2 0. 4 0. 6 0. 8 1 7 13 19 25 31 37 43 49 55 61 67 73 79
The number of lag
Figure 5 The calculated result of coagulation function
C
ross sp
ectrum
Fig. 5. The calculated result of coagulation function.
Table 4. Coincidence coagulation function peaks with different
pe-riods.
Harmonic Value (k) 20 26 80 Period (year) 8 6 2
Yangtze floods. The results (see Fig. 5) shows that there are three frequencies at which the significant correlation of those two time series excess 0.01 level at the peaks of k=20, 26 and 80 respectively. From that, it can be concluded that the responding of the floods in the middle reaches of the Yangtze River to EI Ni˜no events happens not only at high frequency, but also at moderate frequencies (see Table 4). In other words, the floods in the middle reaches of the Yangtze River might occur not only in the following year of EI Ni˜no events, but also as long as 8 years delay. The result also in-dicates that the shorter the interval between EI Ni˜no events occurred, the sooner the following flood would happen. On the other side, delay time of flood will be longer when the interval of EI Ni˜no events is extended.
4 Conclusions and discussion
At the moment, flood risk appears to be on the rise again, witnessing the series of floods of the last 20 years and the serious flood in 1998. Since it is now recognized that flood
control does not meet its requirements, strengthening of flood control is underway. The most highlight event is the project of three gorges that will be taken its role in 2009. However, climate change will be still regarded in flood control. The variation and cycles of historical floods analyzed since 1470 in this paper show the floods may be frequent events, espe-cially in the near future.
The cross-spectral analysis for the cycle of the Yangtze floods and El Nino events indicate that there is a significant correlation between the two at both high and moderate fre-quency sections. The result shows that the response of the floods along the middle reaches of the Yangtze River to the effects of El Nino events is not only delayed one or more than one year as suggested by many Chinese scientists, but it also can be somewhat longer delayed up to about 8 years. The result also indicates that the shorter the interval of EI Ni˜no events, the sooner the flood events follows. In other words, flood could be delayed with longer time if the interval time of EI Ni˜no events is longer.
Just as Ga et al. (1994) demonstrated that significant lo-cal effects of El Nino events in the Pacific Ocean can be ex-tremely long-lived, not only lasting up to two years as other scientists think. The above result turns out that the oceanic effects of El Nino events on the floods along the middle reaches of the Yangtze River is not only immediately delay for one year or more as suggested by many Chinese scien-tists1, but also it can be somewhat further delayed up to 8 years or even longer.
Acknowledgements. The authors wish to thank L. King for his
financial support working on this project. It would be impossible to finish this paper without his encouragement. We also want to extend our thanks to our colleagues in the Department of Geography, Justus-Liebig-University, Giessen, Germany for their kind help.
Edited by: P. Fabian and J. L. Santos
Reviewed by: J. Bendix and another anonymous referee
Y. Wu et al.: The variation of floods in the middle reaches of the Yangtze River 205 References
Chang, C.-P. and Chen, T.-J. G.: Tropical circulations associated with southwest monsoon onset and westerly surges over the South China Sea, Mon. Wea. Rev., 123, 3254–3267, 1995. China Central Meteorology Bureau: The flood and drought
distri-bution atlas of China in the latest 500 years, Meteorology Press, Beijing, in Chinese, 1989.
Clement, A. C., Cane, M. A., and Seager, R.: An orbitally driven tropical source for abrupt climate change, J. Climate, 14, 2369– 2375, 2001.
Chang, C.-P., Harr, P., and Ju, J.: Possible Roles of Atlantic Cir-culations on the Weakening Indian Monsoon Rainfall – ENSO Relationship, J. Climate, 14, 2376–2380, 2001.
Ga, J. and He, H.: Decade-Scale Trans-Pacific Propagation And Warming Effects Of An El-Nino Anomaly, Nature, 370(6488), 360–363, 1994.
Linsley, R. K., Kohler, M. A., and Paulhus, J. L. H.: Hydrology for Engineers, 2nd edn, McGraw-Hill, Inc., New York, 1975. Rosenberg, N. J.: Agricultural Meteorology in China, Bull. Amer.
Mete. Soc., 63(3), 250–257, 1982.
Trenberth, K. E.: The definition of El Ni˜no, Bull. Amer. Mete. Soc., 78(12), 2771–2777, 1997.
Quinn, W. H. and Neal, V. T.: The historical record of EI Ni˜no events, in: Climate Since A.D. 1500, edited by: Bradley, R. S. and Jones, P. D., Routledge, 623–648, 1992
WMO: Climatic Change, Tech. Note, No. 79, 79 pp, 1966. Anyuan, X., Yijin, W., and Shuming, C.: Reconstruction of rainfall
in rainy season based on historical drought/floods grades, Adv. Atmos. Sci., 16(1), 147–153, 1999.