CERN-EP-2018-103 10 May 2018
c
2018 CERN for the benefit of the ALICE Collaboration.
Reproduction of this article or parts of it is allowed as specified in the CC-BY-4.0 license.
Anisotropic flow of identified particles in Pb–Pb collisions at
√
s
NN= 5.02 TeV
ALICE Collaboration∗
Abstract
The elliptic (v2), triangular (v3), and quadrangular (v4) flow coefficients of π±, K±, p + p, Λ + Λ, K0S,
and the φ -meson are measured in Pb–Pb collisions at√sNN= 5.02 TeV. Results obtained with the
scalar product method are reported for the rapidity range |y| < 0.5 as a function of transverse
mo-mentum, pT, at different collision centrality intervals between 0–70%, including ultra-central (0–1%)
collisions for π±, K±, and p + p. For pT < 3 GeV/c, the flow coefficients exhibit a particle mass
dependence. At intermediate transverse momenta (3 < pT< 8-10 GeV/c), particles show an
approx-imate grouping according to their type (i.e., mesons and baryons). The φ -meson v2, which tests both
particle mass dependence and type scaling, follows p + p v2at low pTand π±v2at intermediate pT.
The evolution of the shape of vn(pT) as a function of centrality and harmonic number n is studied for
the various particle species. Flow coefficients of π±, K±, and p + p for pT< 3 GeV/c are compared
to iEBE-VISHNU and MUSIC hydrodynamical calculations coupled to a hadronic cascade model
(UrQMD). The iEBE-VISHNU calculations describe the results fairly well for pT < 2.5 GeV/c,
while MUSIC calculations reproduce the measurements for pT < 1 GeV/c. A comparison to vn
coefficients measured in Pb–Pb collisions at√sNN= 2.76 TeV is also provided.
∗See Appendix A for the list of collaboration members
1 Introduction
Ultra-relativistic heavy-ion collisions are used to study the properties of the quark-gluon plasma (QGP), a state of deconfined quarks and gluons expected at high temperatures or baryon densities [1]. Mea-surements of anisotropies in particle azimuthal distributions relative to the collision symmetry planes at the Relativistic Heavy Ion Collider (RHIC) [2–5] and the Large Hadron Collider (LHC) [6–8] have shown that the produced hot and dense matter behaves as a strongly-interacting QGP. Comparisons to predictions from hydrodynamic models indicate that the QGP has a shear viscosity to entropy density ratio (η/s) close to the theoretical lower limit from the anti-de Sitter/conformal field theory (AdS/CFT) correspondence of 1/4π for ¯h = kB= 1 [9].
Azimuthal anisotropies in particle production relative to the collision symmetry planes, often referred to as anisotropic flow, arise from the asymmetry in the initial geometry of the collision combined with the initial inhomogeneities of the system’s energy density [10]. Anisotropic flow depends on the equation of state and transport coefficients of the system, such as η/s and bulk viscosity to entropy density ratio (ζ /s). Its magnitude is quantified via the coefficients vn in a Fourier decomposition of the particle
azimuthal distribution [11] Ed 3N dp3 = 1 2π d2N pTdpTdy (1 + 2 ∞
∑
n=1 vncos[n(ϕ − Ψn)]), (1)where E is the energy, p the momentum, pT the transverse momentum, ϕ the azimuthal angle, η the
pseudorapidity of the particle, and Ψnthe n-th harmonic symmetry plane angle. The second order flow
coefficient v2, called elliptic flow, is the largest contribution to the asymmetry of non-central collisions
because of the almond-like geometry of the overlap region between the colliding nuclei in the plane perpendicular to the beam direction. The third-order flow coefficient v3, named triangular flow, is
gener-ated by fluctuations in the initial distribution of nucleons and gluons in the overlap region [12–15]. The fourth-order flow coefficient v4, called quandrangular flow, is generated both by initial geometry,
fluc-tuations, and is in addition sensitive to the non-linear hydrodynamic response of the medium [16, 17]. It has been shown that higher-order flow coefficients are more sensitive to η/s than v2[18, 19].
In addition to probing η/s and ζ /s, anisotropic flow constrains the initial spatial density (e.g. energy and entropy density), freeze-out conditions of the system, and particle production mechanisms in different pT
regions. Stronger constraints are achieved by studying anisotropic flow of identified particles. To guide interpretation of the results in the context of these processes, three kinematic ‘regions of interest’ are defined in the pT-differential vnmeasurements, vn(pT). For pT. 3 GeV/c, anisotropic flow is a remnant
of the collective dynamics during the hydrodynamic expansion of the system. The interplay between the isotropic expansion (radial flow) and anisotropic flow leads to a characteristic mass ordering of vn(pT)
[20–28], meaning that heavier particles have smaller vn(pT). At intermediate pT (3. pT. 8 GeV/c),
the values of vnfor different particles tend to separate mesons and baryons [27–33]. The flow of baryons
is larger than that of mesons in this pTrange, supporting the hypothesis of hadronization through quark
coalescence [34], where it is assumed that the invariant spectrum of produced particles is proportional to the product of the spectra of their constituents [35, 36]. However, the scaling only holds approximately at RHIC [32] and at the level of ±20% in Pb–Pb collisions at√sNN= 2.76 TeV [27, 28]. This behaviour
is also qualitatively consistent with a scenario in which particle production includes interactions of jet fragments with bulk matter [37, 38]. For pT& 8 GeV/c, anisotropic flow is generated when hard partons
that propagate through the system lose energy via (multiple) scattering and gluon radiation [39, 40], resulting in vnthat remain non-zero up to very high pT [41–44].
Anisotropic flow of identified particles is an important observable when studying the characteristics of the QGP. However, since particles can scatter and be regenerated in between the chemical and kinetic freeze-out of a collision (the hadronic phase), information about the QGP phase imprinted in vn(pT)
leading to a deviation in mass ordering in vn(pT) at low pT [46]. The φ -meson has been suggested as
a particularly sensitive probe of the early collision phase as its production rate via regeneration in the hadronic phase is negligible [47] and it is theorized to have a low hadronic cross section [48–50], making it insensitive to the dissipative effects of the hadronic phase of the collision (although it should be noted that there is no consensus on the exact value of the cross section between the φ -meson and nucleons in heavy-ion collisions [51–54]). Recent experimental studies [27, 55, 56] suggest that the φ -meson may be more sensitive to the hadronic phase than anticipated.
In this article, we present measurements of pT-differential elliptic, triangular, and quadrangular flow
co-efficients of π±, K±, p+p, Λ+Λ, K0S, and the φ -meson in Pb–Pb collisions at√sNN= 5.02 TeV, extending
greatly, and improving in precision upon, the previous measurements of identified particle vnin Pb–Pb
collisions at√sNN= 2.76 TeV as carried out by ALICE [27, 28, 33]. The results are reported for a wide
range of particle transverse momenta within the rapidity range |y| < 0.5 at different collision centrali-ties between 0–70% range. To isolate the fraction of anisotropic flow that is generated by initial-state fluctuations rather than geometry, the flow coefficients are also studied in ultra-central collisions (0–1% collision centrality). Centrality estimates the degree of overlap between the two colliding nuclei and is expressed as percentiles of the inelastic hadronic cross section, with low percentage values correspond-ing to head-on collisions. The measurements are performed uscorrespond-ing the scalar product method [57–59] with a (pseudo-)rapidity gap of |∆η| > 2.0 between the identified particles under study and the charged reference particles. The flow coefficients are measured separately for particles and anti-particles and are found to be compatible within the statistical uncertainties for most pTand centrality intervals. Any
resid-ual differences are included in the systematic uncertainties, and vn denotes the average between results
for particles and anti-particles.
This paper is organized as follows. Analysis details, particle identification, reconstruction methods, and flow measurement techniques are outlined in Sec. 2. The evaluation of systematic uncertainties is discussed in Sec. 3. The flow coefficients of π±, K±, p+p (v2, v3, and v4), Λ+Λ, K0S (v2 and v3), and
the φ -meson (v2) are reported and compared to model calculations in Sec. 4. Finally, the results are
summarized in Sec. 5.
2 Experimental setup and data analysis
ALICE [60–62] is a dedicated heavy-ion experiment at the LHC optimized to study the properties of strongly interacting matter produced in heavy-ion collisions. A full overview of the detector layout and its performance can be found in [62, 63]. The main subsystems used in this analysis are the Inner Tracking System (ITS) [64], Time Projection Chamber (TPC) [65], Time Of Flight detector (TOF) [66], and V0 [67]. The ITS, TPC, and TOF detectors cover full azimuth within pseudorapidity range |η| < 0.9 and lie within a homogeneous magnetic field of up to 0.5 T. The ITS consists of six layers of silicon detectors used for tracking and vertex reconstruction. The TPC is the main tracking detector and is also used to identify particles via specific ionization energy loss, dE/dx. The TOF in conjunction with the timing information from the T0 detector [68] provide particle identification based on flight time. The T0 is made up of two arrays of Cherenkov counters T0C and T0A, located at -3.3 < η < -3.0 and 4.5 < η < 4.9, respectively. Two scintillator arrays (V0), which cover the pseudorapidity ranges −3.7 < η < −1.7 (V0C) and 2.8 < η < 5.1 (V0A), are used for triggering, event selection, and the determination of centrality [69] and Qn-vectors (see Sec. 2.5). Both V0 detectors are segmented in
four rings in the radial direction with each ring divided into eight sectors in the azimuthal direction. In addition, two tungsten-quartz neutron Zero Degree Calorimeters (ZDCs), installed 112.5 meters from the interaction point on each side, are used for event selection.
2.1 Event and track selection
The data sample recorded by ALICE during the 2015 LHC Pb–Pb run at√sNN = 5.02 TeV is used for
this analysis. The minimum-bias trigger requires signals in both V0A and V0C detectors. An offline event selection is applied to remove beam-induced background (i.e. beam-gas events) and pileup events. The former is rejected utilizing the V0 and ZDC timing information. The remaining contribution of such interactions is found to be smaller than 0.02% [63]. Pileup events, which constitute about 0.25% of the recorded sample, are removed by comparing multiplicity estimates from the V0 detector to those of tracking detectors at mid-rapidity, exploiting the difference in readout times between the systems. The fraction of pileup events left after applying the dedicated pileup removal criteria is found to be negligible. The primary vertex position is determined from tracks reconstructed in the ITS and TPC as described in Ref. [63]. Only events with a primary vertex position within ±10 cm from the nominal interaction point along the beam direction are used in the analysis. Approximately 67 × 106 Pb–Pb events in the 0–70% centrality interval pass these selection criteria. Centrality is estimated from the energy deposition measured in the V0 detector [69].
Charged-particle tracks, used to measure the vnof π±, K±, p+p and the φ -meson, are reconstructed using
the ITS and TPC within |η| < 0.8 and 0.5 < pT< 16.0 GeV/c with a track-momentum resolution better
than 4% for the considered range [63]. Additional quality criteria are used to reduce the contamina-tion from secondary charged particles (i.e., particles originating from weak decays, γ-conversions, and secondary hadronic interactions in the detector material) and fake tracks (random associations of space points). Only tracks with at least 70 space points, out of a maximum of 159, with a χ2 per degree-of-freedom for the track fit lower than 2, are accepted. Moreover, each track is required to cross at least 70 TPC pad rows and to be reconstructed from at least 80% of the number of expected TPC space points, in addition to having at least one hit in the two innermost layers of the ITS. Furthermore, tracks with a dis-tance of closest approach (DCA) to the reconstructed event vertex smaller than 2 cm in the longitudinal direction (z) and (0.0105 + 0.0350 (pTc/GeV)−1.1) cm in the transverse plane (xy) are selected. Relevant
selection criteria for tracks used for the reconstruction of K0Sand Λ+Λ are given in Sec. 2.3. 2.2 Identification of π±, K±and p+p
Particle identification is performed using the specific ionization energy loss, dE/dx, measured in the TPC and the time of flight obtained from the TOF. A truncated-mean procedure is used to estimate the dE/dx (where the 40% highest-charge clusters are discarded), which yields a dE/dx resolution around 6.5% in the 0–5% centrality class [63]. At least 70 clusters are used for the dE/dx estimation. The TOF measures the time that a particle needs to travel from the primary vertex to the detector itself with a time resolution of ≈ 80 ps [63]. The start time for the TOF measurement is provided by the T0 detector or from a combinatorial algorithm which uses the particle arrival times at the TOF detector itself [63, 66]. Expressing the difference between the expected dE/dx and the time of flight for π±, K±and p+p, and the measured signals in both TPC and TOF, in units of the standard deviations from the most probable value for both detectors (nσTPC, nσTOF), and applying a selection on the number of accepted nσ , allows
for particle identification on a track-by-track basis. The TPC dE/dx of different particle species are separated by at least 4σ for pT < 0.7 GeV/c, while in the relativistic rise region of the dE/dx (pT >
2 GeV/c) particle identification is still possible but only on a statistical basis [63]. The TOF detector provides 3σ separation between π± and K±for pT < 2.5 GeV/c, and between K± and p+p for pT < 4
GeV/c [63].
The information from the TPC and TOF is combined using a quadratic sum nσPID=
q nσ2
TPC+ nσTOF2
for 0.5 < pT ≤ 4 GeV/c. Particles are selected by requiring nσPID< 3 for each species. The smallest
nσPID is used to assign the identity when the selection criterion is fulfilled by more than one species.
from detector material. At high transverse momenta (pT > 4 GeV/c), K± cannot reliably be identified.
Identification of π± and p+p for pT > 4 GeV/c is done utilizing the TPC dE/dx signal only. Pions
(protons) are selected from the upper (lower) part of the expected pion (proton) dE/dx distribution. For example, proton selection typically varies in the range from 0 to −3σTPCor from −1.5σTPCto −4.5σTPC
depending on the momentum.
Secondary contamination from weak decays, studied using the procedure outlined in [70], decreases from about 30% to 5% for p+p in the pT range 0.7-4.0 GeV/c and from about 5% to 0.5% for π±
in the pT range 0.5-4.0 GeV/c, while it is negligible for K±. The vn coefficients are not corrected
for these contaminations; their effect on vn is at maximum ≈ 8%, for p + p v2 at pT < 1 GeV/c for
central collisions, and negligible for K±, π±vn. The contamination from other particle species is below 3% and 20% at pT > 4.0 GeV/c for π± and p+p, respectively, and contamination from fake tracks
is negligible. The vn results are reported for 0.5 < pT < 16.0(12.0, 6.0) GeV/c for π± v2 (v3, v4),
0.7 < pT< 16.0(12.0, 6.0) GeV/c for p+p v2 (v3, v4), and 0.5 < pT< 4.0 GeV/c for K± vn, all within
|y| < 0.5.
2.3 Reconstruction of K0Sand Λ + Λ
The K0S and Λ+Λ are reconstructed in the K0S → π+ + π− and Λ → p + π− (Λ → p + π+) channels
with branching ratios of 69.2% [71] and 63.9% [71] respectively. Reconstruction of K0S and Λ+Λ is based on identifying secondary vertices from which two oppositely-charged particles originate, called V0s. Topological selection criteria pertaining to the shape of the V0decay can be imposed, as well as requirements on the species identity of the decay products (called daughter particles).
The V0candidates are selected to have an invariant mass between 0.4 and 0.6 GeV/c2and 1.07 and 1.17 GeV/c2for K0Sand Λ+Λ, respectively. The invariant mass of the V0is calculated based on the assumption that the daughter particles are either a π+π− pair, or a pπ− (pπ+) pair. The daughter particles have been identified over the entire pT range using the TPC following the nσ approach detailed in Sec. 2.2
(|nσTPC| < 3). The daughter tracks were reconstructed within |η| < 0.8, while the criteria on the number
of TPC space points, the χ2 per TPC space point per degree-of-freedom, the number of crossed TPC pad rows, and the percentage of the expected TPC space points used to reconstruct a track are identical to those applied for primary particles. In addition, the minimum DCA of daughter tracks to the primary vertex is 0.1 cm. Furthermore, the maximum DCA of daughter tracks to the secondary vertex is 0.5 cm to ensure that they are products of the same decay.
To reject secondary vertices arising from decays into more than two particles, the cosine of the pointing angle θpis required to be larger than 0.998. This angle is defined as the angle between the
momentum-vector of the V0assessed at its decay position and the line connecting the V0decay vertex to the primary vertex and has to be close to 0 as a result of momentum conservation. In addition, the V0candidates are only accepted when they are produced at a distance between 5 and 100 cm from the nominal primary vertex in the radial direction. The lower value is chosen to avoid any bias from the efficiency loss when secondary tracks are being wrongly matched to clusters in the first layer of the ITS. To assess the systematic uncertainty related to contaminations from Λ+Λ and electron–positron pairs coming from γ -conversions to the K0S sample, a selection in the Armenteros-Podolanski variables [72] is applied for the K0S candidates, rejecting ones with q ≤ |α|/5. Here q is the momentum projection of the positively charged daughter track in the plane perpendicular to the V0momentum and α = (p+L− p−L)/(p+L+ p−L), with p±L the projection of the positive or negative daughter tracks’ momentum onto the momentum of the V0.
To obtain the pT-differential yield of K0S and Λ+Λ (which, together with background yields, are used
for the vnextraction cf. Eq. 4), invariant mass distributions at various pT intervals are parametrized as
a sum of a Gaussian distribution and a second-order polynomial function. The latter is introduced to account for residual contaminations (background yield) that are present in the K0Sand Λ+Λ signals after
the topological and daughter track selections. The K0Sand Λ+Λ yields are extracted by integration of the Gaussian distribution. Obtained yields have not been corrected for feed-down from higher mass baryons (Ξ±, Ω±) as earlier studies have shown that these have a negligible effect on the measured vn [27]. The
vn(pT) results are reported within |y| < 0.5 and 0.5 < pT< 10 GeV/c for K0Sand 0.8 < pT< 10 GeV/c
for Λ+Λ.
2.4 Reconstruction of φ -mesons
The φ -meson is reconstructed in the φ → K++K− channel with a branching ratio of 48.9% [71]. Its reconstruction proceeds by first identifying all primary K± tracks in an event, following the procedure for primary charged K± outlined in Sec. 2.2. The K± identification criterion nσPID < 3 is chosen as
it improves the significance of the φ -meson yield, while retaining a sufficient reconstruction efficiency. The vector sums of all possible K±pairs are called φ -meson candidates, the yield of which is obtained as function of invariant mass MK+K−in various pTintervals. The pT-differential φ -meson yield is obtained
by first subtracting a background yield from the candidate yield. This background yield is estimated using an event-mixing technique [73], in which K±from different collisions are paired into background tracks, and is normalized to the candidate yield for 1.04 < MK+K− < 1.09 GeV/c2. Collisions with similar
characteristics (vertex position, centrality) are used for this mixing. To obtain the pT-differential yield of
φ -mesons, the invariant mass distributions of the candidate yield is, after the aforementioned subtraction, parametrized as a sum of a Breit-Wigner distribution and a second-order polynomial function, the latter introduced to account for residual contaminations. The φ -meson yields are extracted by integration of the Breit-Wigner distribution and, together with background yields, used for the vnextraction (see Eq. 4).
The v2(pT) results are reported for 0.9 < pT< 6.5 GeV/c within |y| < 0.5.
2.5 Flow analysis techniques
The flow coefficients vnare measured using the scalar product method [57–59], written as
vn{SP} = hhun,kQ∗nii ,s hQnQA∗n ihQnQB∗n i hQA nQB∗n i , (2)
where un,k= exp(inϕk) is the unit flow vector of the particle of interest k with azimuthal angle ϕk, Qn
is the event flow vector, and n is the harmonic number. Brackets h· · · i denote an average over all events, the double brackets hh· · · ii an average over all particles in all events, and∗the complex conjugate. The vector Qn is calculated from the azimuthal distribution of the energy deposition measured in the
V0A. Its x and y components are given by Qn,x=
∑
j
wjcos(nϕj), Qn,y=
∑
jwjsin(nϕj), (3)
where the sum runs over the 32 channels j of the V0A detector, ϕj is the azimuthal angle of channel j
defined by the geometric center, and wj is the amplitude measured in channel j. The vectors QAn and
QBn are determined from the azimuthal distribution of the energy deposition measured in the V0C and the azimuthal distribution of the tracks reconstructed in the ITS and TPC, respectively. The amplitude measured in each channel of the V0C (32 channels as for the V0A) is used as weight in the case of QAn, while unity weights are applied for QBn. Tracks used for QBn are selected following the procedure for primary charged tracks outlined in Sec. 2.1 for 0.2 < pT < 5.0 GeV/c. In order to account for
a non-uniform detector response, the components of the Qn and QAn vectors are recalibrated using a
recentering procedure (i.e. subtraction of the Qn-vector averaged over many events from the Qn-vector
of each event) [74]. The large gap in pseudorapidity between un,kand Qn(|∆η| > 2.0) greatly suppresses
short-range correlations unrelated to the azimuthal asymmetry in the initial geometry, commonly referred to as ‘non-flow’. These correlations largely come from the inter-jet correlations and resonance decays.
1.02 1.04 ) 2 c Counts / (1.7 MeV/ 0 10000 20000 30000 40000 , |y| < 0.5 c < 3.0 GeV/ -K + K T p 2.7 < ) bg N + sig N yield ( + K + K ) sig N ( + K + K → φ Breit-Wigner fit 20-30% ALICE = 5.02 TeV NN s Pb − Pb ) 2 c (GeV/ -K + K M 1.02 1.04 2 tot v 0.34 0.36 0.38 fit tot 2 v
Fig. 1: (Colour online) Illustration of reconstruction and v2measurement for the φ -meson. The reconstruction of
the φ -meson and extraction of Nsigand Nbgare shown in the upper panel. A fit of Eq. 4 to data is presented in the
lower panel.
The vn of the K0S, Λ+Λ, and φ -meson cannot directly be measured using Eq. 2 as K0S, Λ+Λ and the
φ -meson cannot be identified on a particle-by-particle basis. Therefore, the vtotn of V0s and φ -meson
candidates is measured as function of both invariant mass, Md+d−, and candidate pT. This vtotn can be
written [75] as the weighted sum of vn(pT) of the particle of interest, vsign , and that of background tracks,
vbgn (Md+d−), as vtotn (Md+d−) = vsign Nsig Nsig+ Nbg(Md+d−) + v bg n (Md+d−) Nbg Nsig+ Nbg(Md+d−), (4)
where signal and background yields Nsig and Nbgare obtained for each pT interval from the K0S, Λ+Λ
and φ -meson reconstruction procedures outlined in Secs 2.3 and 2.4. The formalism of Eq. 2 is used to measure vtotn (Md+d−), vnsigis obtained by parametrizing vbgn (Md+d−) as a second-order polynomial function
and fitting Eq. 4 to the data. Figure 1 illustrates this procedure for the φ -meson, showing the invariant mass spectrum of the φ -meson in the upper panel, and a fit of Eq. 4 to vtot2 (Md+d−) data in the lower
panel.
3 Systematic uncertainties
The systematic uncertainties on vn fall into the following categories: those arising from event selection,
those arising from charged particle tracking, uncertainties in particle identification, uncertainties in V0
finding, and those coming from the extraction of vn(pT).
For pT≤ 4 GeV/c, a pT-dependent systematic uncertainty is assigned to v2, v3, and v4of π±, K±, p+p,
Λ+Λ, K0Sand the φ -meson. Per measured point, the difference between the nominal measurement and a variation on the nominal measurement is calculated. If this difference between the nominal data point and the systematic variation is significant (where significance is evaluated based on the recommendations in [76]), it is considered to be a systematic uncertainty. When various checks are performed to quantify the effect of one systematic uncertainty (e.g. using three different centrality estimators to estimate the uncertainty in centrality determination), the maximum significant deviation that is found between the
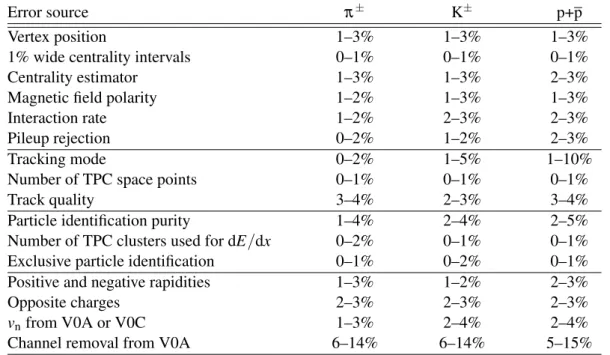
Error source π± K± p+p K0S Λ+Λ φ
Vertex position 0–1% 0–1% 0–2% 0–2% 0–4% 1–6%
1% wide centrality intervals 0–3% 0–4% 0–4%
Centrality estimator 0–3% 0–2% 0–3% 0–4% 0–5% 1–5%
Magnetic field polarity 0–2% 0–1% 0–2% 0–3% 0–3% 1–3%
Interaction rate 0–2% 0–1% 1–2% negl negl negl
Pileup rejection 0–1% 0–1% 0–2% 0–1% 0–2% 0–1%
Tracking mode 0–4% 0–8% 0–10% 0–5%
Number of TPC space points 0–2% 0–2% 0–2% 0–4% 0–2% negl
Track quality 0–3% 0–2% 0–3% 0–4% 0–3% negl
Particle identification purity 0–5% 0–7% 0–5% 0–3% 0–8% 0–6%
Number of TPC clusters used for dE/dx 0–6% 0–5% 0–5% 0–5% 0% negl
Exclusive particle identification 0–2% 0–3% 0–3%
Decay vertex (radial position) 0–10% 0–11%
Armenteros-Podolanski variables 0–2%
DCA decay products to primary vertex 0–3% 0–5%
DCA between decay products 0–2% 0–7%
Pointing angle cos θp 0–4% 0–9%
Minimum pTof daughter tracks 0–4% 0–5%
Peak shape negl negl negl
Residual background in yield negl negl negl
Event mixing 1–3%
Positive and negative rapidities 0–3% 0–2% 0–2% 0–4% 0–7% negl
Opposite charges 0–2% 0–2% 0–2%
Channel removal from V0A 0–5% 0–5% 0–8% 0–3% 0–5% 0–4%
vnfrom V0A or V0C 0–2% 0–2% 0–2% negl negl negl
vbgn parametrization negl negl negl
vtotn fit ranges 0-1% 0-2% 0-1%
Table 1: Summary of systematic uncertainties for the v2of π±, K±, p+p, Λ+Λ, K0S, and the φ -meson. The
uncertainties depend on pT and centrality range; minimum and maximum values are listed here. Empty fields
indicate that a given check does not apply to the particle of interest. If an uncertainty has been tested but cannot be resolved within statistical precision, the field is marked negl for negligible. Horizontal lines are used to separate the different categories of systematic uncertainties as explained in Sec. 3.
nominal measurement and the systematic variations is assigned as a systematic uncertainty. For each particle species, a pT-independent average uncertainty is reported for pT> 4 GeV/c in order to suppress
sensitivity to statistical fluctuations. The uncertainty is obtained by fitting a zeroth-order polynomial to the significant pT-dependent relative uncertainties.
The systematic uncertainties are evaluated (if applicable) for each particle species, vn(pT) and centrality
intervals. A quadratic sum of the systematic uncertainties from the independent sources is reported as final systematic uncertainty on the measurements. An overview of the magnitude of the relative systematic uncertainties per particle species is given in Tabs. 1, 2, and 3 for v2, v3, and v4, respectively.
Event selection
The nominal event selection criteria and centrality determination are discussed in Sec. 2.1. Event se-lection criteria are varied by (i) changing the default centrality estimator from energy deposition in the V0 scintillator to either an estimate based on the number of hits in the first or second layer of the ITS;
Error source π± K± p+p K0S Λ+Λ
Vertex position 0–2% 0–1% 0–2% 0–3% 0–9%
1% wide centrality intervals 0–2% 0–2% 0–2%
Centrality estimator 0–2% 0–2% 0–2% 0–4% 0–9%
Magnetic field polarity 0–2% 0–1% 0–3% 0–3% 0–3%
Interaction rate 1–2% 1–2% 1–3% negl negl
Pileup rejection 0–2% 0–1% 0–3% 0–1% 0–2%
Tracking mode 0–3% 1–5% 0–10%
Number of TPC space points 0–1% 0–2% 0–5% 0–3% 0–6%
Track quality 1–3% 1–2% 1–3% 0–3% 0–6%
Particle identification purity 0–4% 1–3% 0–10% 0–4% 0–4%
Number of TPC clusters used for dE/dx 0–5% 0–5% 0–5%
Exclusive particle identification 0–1% 0–2% 0–1%
Decay vertex (radial position) 0–9% 0–11%
Armenteros-Podolanski variables 0–4%
DCA decay products to primary vertex 0–3% 0–5%
DCA between decay products 0–5% 0–8%
Pointing angle cos θp 0–5% 0–1%
Minimum pT of daughter tracks 0–4% negl
Peak shape negl negl
Residual background in yield negl negl
Positive and negative rapidities 0–2% 0–1% 0–3% 0–5% 0–4%
Opposite charges 0–2% 0–2% 0–2%
vnfrom V0A or V0C 0–2% 0–1% 0–2% 0–4% 0–3%
Channel removal from V0A 0–8% 1–8% 1–8% 0–4% 0–5%
vbgn parametrization negl negl
vtotn fit ranges 0-2% 0-2%
Table 2: Summary of systematic uncertainties for the v3of π±, K±, p+p, Λ+Λ, and K0S. The uncertainties depend
on pTand centrality range; minimum and maximum values are listed here. Empty fields indicate that a given check
does not apply to the particle of interest. If an uncertainty has been tested but cannot be resolved within statistical precision, the field is marked negl for negligible. Horizontal lines are used to separate the different categories of systematic uncertainties as explained in Sec. 3.
(ii) performing the vn analysis of π±, K±, and p+p in 1% wide centrality intervals to test the effect of
multiplicity fluctuations (a test not possible for K0S, Λ+Λ v3); (iii) not rejecting events with tracks caused
by pileup or imposing a stricter than default pileup rejection by requiring a tighter correlation between the V0 and central barrel multiplicities; (iv) requiring the reconstructed primary vertex of a collision to lie alternatively within ±12 cm and ±5 cm from the nominal interaction point along the beam axis; (v) analyzing events recorded under different magnetic field polarities independently; (v) analyzing events recorded at different collision rates independently.
Charged particle tracking
The nominal charged particle track selection criteria are outlined in Sec. 2.1. Charged particle track selection criteria are varied by (i) requiring the third layer of the ITS to be part of the track reconstruction rather than the first two layers only; (ii) using only tracks that have at least three hits per track in the ITS, complemented by tracks without hits in the first two layers of the ITS (in which case the primary interaction vertex is used as an additional constraint for the momentum determination); (iii) changing the requirement on the minimum number of TPC space points that are used in the reconstruction from 70
Error source π± K± p+p
Vertex position 1–3% 1–3% 1–3%
1% wide centrality intervals 0–1% 0–1% 0–1%
Centrality estimator 1–3% 1–3% 2–3%
Magnetic field polarity 1–2% 1–3% 1–3%
Interaction rate 1–2% 2–3% 2–3%
Pileup rejection 0–2% 1–2% 2–3%
Tracking mode 0–2% 1–5% 1–10%
Number of TPC space points 0–1% 0–1% 0–1%
Track quality 3–4% 2–3% 3–4%
Particle identification purity 1–4% 2–4% 2–5%
Number of TPC clusters used for dE/dx 0–2% 0–1% 0–1%
Exclusive particle identification 0–1% 0–2% 0–1%
Positive and negative rapidities 1–3% 1–2% 2–3%
Opposite charges 2–3% 2–3% 2–3%
vnfrom V0A or V0C 1–3% 2–4% 2–4%
Channel removal from V0A 6–14% 6–14% 5–15%
Table 3: Summary of systematic uncertainties for the v4of π±, K±, and p+p. The uncertainties depend on pTand
centrality range; minimum and maximum values are listed here. Horizontal lines are used to separate the different categories of systematic uncertainties as explained in Sec. 3.
to 60, 80, and 90; (iv) an additional systematic uncertainty is evaluated combining the following checks of the track quality: rejecting tracks that are reconstructed close to the sector boundaries of the TPC to which the sensitive pad rows do not extend, varying the minimum number of crossed TPC pad rows from 70 to 120, and requesting at least 90% instead of 80% of the expected TPC space points to reconstruct a track. Variations (i) and (ii) are referred to as tracking mode in Tabs. 1, 2, and 3.
Particle identification
The nominal particle identification approach for π±, K±, and p+p is outlined in Sec. 2.2. Particle iden-tification criteria are varied by (i) changing the minimum number of clusters in the TPC that are used to estimate the dE/dx from 70 to 60, 80, and 90; (ii) rejecting tracks that satisfy the particle identification criterion for more than one particle species simultaneously for pT< 4 GeV/c; (iii) varying the particle
identification criterion from nσPID< 3 to nσPID< 1, nσPID< 2, and nσPID< 4; (iv) varying the nσTPC
ranges that are used for particle identification for pT> 4 GeV/c.
The V0finding and φ -meson reconstruction
The nominal V0finding strategy is described in Sec. 2.3. The V0finding criteria fall into two categories: topological requirements on the V0s themselves, and selection imposed on their daughter tracks. These criteria are varied by (i) requiring a minimum pTof the V0daughter tracks of 0.2 GeV/c; (ii) changing
the requirement on the minimum number of TPC space points that are used in the reconstruction of the V0 daughter tracks form 70 to 60 and 80; (iii) varying the minimum number of TPC padrows crossed by the V0 daughter tracks from 70 to 60 and 80; (iv) requesting at least 90% or 70% instead of 80% of the expected TPC space points to reconstruct the V0 daughter tracks; (v) changing the maximum DCA of the V0daughter tracks to the secondary vertex from 0.5 cm to 0.3 cm and 0.7 cm; (vi) changing the minimum DCA of the V0daughter tracks to the primary vertex from 0.1 cm to 0.05 cm and 0.3 cm; (vii) varying the number of clusters in the TPC that are used to estimate the dE/dx of the V0daughter tracks from 70 to 60 and 90; (viii) varying the particle identification criterion of the V0daughter tracks from |nσTPC| < 3 to |nσTPC| < 1 and |nσTPC| < 4; (ix) changing the minimum value of the cos θpfrom 0.998
to 0.98; (x) varying the minimum radial distance to the primary vertex at which the V0can be produced from 5 cm to 1 cm and 15 cm; (xi) varying the maximum radial distance to the beam pipe at which the V0can be produced from 100 cm to 50 cm and 150 cm; (xii) the contamination from Λ+Λ decays and γ -conversions to the K0Ssample is checked by only selecting V0 daughter tracks with a dE/dx value 2σ away from the expected electron dE/dx, effectively excluding electrons, and limiting the value of the Armenteros-Podolanski variables α and q.
The yield extraction, as explained in Sec 2.3 for the K0Sand Λ+Λ, and Sec 2.4 for the φ -meson, is varied by: (i) using a third-order polynomial as parametrization of residual background in the invariant mass spectra; (ii) using for the φ -meson a Voigtian distribution (a convolution of a Gaussian distribution and Breit-Wigner distribution, where the width of the Breit-Wigner distribution is set to the natural width of the φ -meson, allowing for the Gaussian distribution to describe the smearing of the φ -meson width due to the detector resolution) for the parametrization of the φ -meson invariant mass yield; using for the K0S and Λ+Λ a sum of two Gaussian distributions with the same mean for the parametrization of the K0S, Λ+Λ invariant mass yield; (iii, for the φ -meson only) using the yield of like-sign kaon pairs, in which two kaons with equal charge from the same event are used as candidate, for background yield description instead of event mixing.
Extraction of the vn(pT)
The nominal approach of measuring vn(pT) is outlined in Sec. 2.5, and is varied by: (i) performing
flow analysis for π±, K±, and p+p for positive and negative charges independently; (ii) performing flow analysis for positive and negative rapidities independently; (iii) performing flow analysis for π±, K±, and p+p in 1% centrality intervals and merging the result rather than measuring in wider centrality intervals directly; (iv) suppressing the signal from a specific V0A channel in the evaluation of the Qn-vector (see
Eq. 3), which, on average, measures a lower energy deposition with respect to the ones reported by the other channels from the same ring; (v) performing flow analysis with the Qn-vector calculated from
the V0A or V0C separately; (vi) testing various Md+d− intervals over which vbgn (Md+d−) is fitted; (vii)
testing the assumption made on vbgn by changing the parametrization from a second-order polynomial to
a first-order polynomial function.
4 Results and discussion
The flow coefficients v2, v3, and v4 of identified particles are presented for various centrality classes in
Sec. 4.1; scaling properties are discussed in Sec. 4.2. Comparisons to various model calculations, studies on the shape evolution of vn(pT) with centrality, and comparisons to vn measured at
√
sNN = 2.76 TeV are shown in Secs. 4.3, 4.4, and 4.5, respectively.
4.1 Centrality and pTdependence of flow coefficients
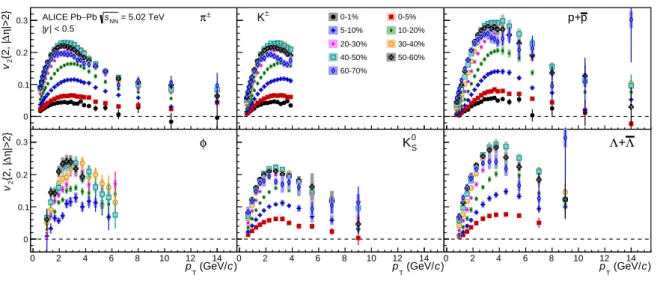
Figure 2 shows the v2(pT) of π±, K±, p+p, Λ+Λ, K0S, and the φ -meson for various centrality classes in
the range 0–70%. For the π±, K±and p+p, measurements performed in ultra-central collisions (0–1%) are also presented. For the φ -meson, the results are reported in the 5–60% centrality range, where v2
can be measured accurately. The magnitude of v2increases strongly with decreasing centrality up to the
40–50% centrality interval for all particle species. This evolution is expected, since the eccentricity of the overlap zone of the colliding nuclei increases for peripheral collisions and v2 scales approximately
linearly with eccentricity [77]. For more peripheral collisions (i.e. 50–60% and 60–70%), the value of v2 is smaller than in the previous centrality intervals for all particle species except the φ -meson. This
suggests that the system has a shorter lifetime in more peripheral collisions, which does not allow for the generation of large v2 [78]. Furthermore, the reduced contribution of eccentricity fluctuations and
hadronic interactions might play an important role in these centrality ranges [79]. A non-zero, positive v2is found in the 0–1% centrality interval for pT< 6 GeV/c for π±, K±, and p+p, which mostly reflects
) c (GeV/ T p 0 2 4 6 8 10 12 14 |>2} η∆ {2, |2 v 0 0.1 0.2 0.3 ALICE Pb−Pb sNN = 5.02 TeV | < 0.5 y | ± π ) c (GeV/ T p 0 2 4 6 8 10 12 14 |>2} η∆ {2, |2 v 0 0.1 0.2 0.3 φ (GeV/c) T p 0 2 4 6 8 10 12 14 |>2} η∆ {2, |2 v 0 0.1 0.2 0.3 0-1% 0-5% 5-10% 10-20% 20-30% 30-40% 40-50% 50-60% 60-70% ± K ) c (GeV/ T p 0 2 4 6 8 10 12 14 |>2} η∆ {2, |2 v 0 0.1 0.2 0.3 0 S K (GeV/c) T p 0 2 4 6 8 10 12 14 |>2} η∆ {2, |2 v 0 0.1 0.2 0.3 p+p ) c (GeV/ T p 0 2 4 6 8 10 12 14 |>2} η∆ {2, |2 v 0 0.1 0.2 0.3 Λ+Λ
Fig. 2: (Colour online) Centrality dependence of v2(pT) for π±, K±, p+p, Λ+Λ, K0S, and the φ -meson. Statistical
and systematic uncertainties are shown as bars and boxes, respectively.
) c (GeV/ T p 0 2 4 6 8 10 |>2} η∆ {2, |3 v 0 0.05 0.1 ± π ) c (GeV/ T p 0 2 4 6 8 10 |>2} η∆ {2, |3 v 0 0.05 0.1 0.15 p+p pT (GeV/c) 0 2 4 6 8 10 |>2} η∆ {2, |3 v 0 0.05 0.1 ± K ) c (GeV/ T p 0 2 4 6 8 10 |>2} η∆ {2, |3 v 0 0.05 0.1 0.15 0 S K (GeV/c) T p |>2} η∆ {2, |3 v 0-1% 0-5% 5-10% 10-20% 20-30% 30-40% 40-50% = 5.02 TeV NN s Pb − ALICE Pb | < 0.5 y | ) c (GeV/ T p 0 2 4 6 8 10 |>2} η∆ {2, |3 v 0 0.05 0.1 0.15 Λ+Λ
Fig. 3: (Colour online) Centrality dependence of v3(pT) for π±, K±, p+p, Λ+Λ, and K0S. Statistical and systematic
uncertainties are shown as bars and boxes, respectively.
the contribution from event-by-event fluctuations in the initial nucleon and gluon density as the system shape is almost spherical at vanishing impact parameter.
The third-order flow coefficent v3is generated by inhomogeneities in the initial nucleon and gluon density
and not by the collision geometry [12–15], while v4 arises from initial collision geometry, fluctuations,
and the non-linear hydrodynamic response of the medium [16, 17]. Higher-order flow harmonics are more sensitive to transport coefficients than v2 [15], as the dampening effect of η/s leads to a stronger
decrease of these coefficients [18, 19]. Figures 3 and 4 present the v3(pT) of π±, K±, p+p, Λ+Λ, and K0S
and v4(pT) of π±, K±, and p+p for various centrality classes in the 0–50% range. Statistical precision
limits extending the v4measurement to more peripheral collisions or carrying it out for Λ+Λ, K0S, and the
φ -meson. Non-zero, positive v3and v4are observed for particle species throughout the entire pT ranges
up to ≈ 8 GeV/c. Unlike v2, the coefficients v3 and v4 increase weakly from ultra-central to peripheral
event-) c (GeV/ T p 0 1 2 3 4 5 |>2} η∆ {2, |4 v 0 0.05 0.1 0.15 = 5.02 TeV NN s Pb − ALICE Pb | < 0.5 y | ± π ) c (GeV/ T p 0 0.5 1 1.5 2 2.5 3 3.5 4 |>2} η∆ {2, |4 v 0 0.05 0.1 0.15 0-1% 0-5% 5-10% 10-20% 20-30% 30-40% 40-50% ± K ) c (GeV/ T p 0 1 2 3 4 5 |>2} η∆ {2, |4 v 0 0.05 0.1 0.15 p p+
Fig. 4: (Colour online) Centrality dependence of v4(pT) for π±, K±, and p+p. Statistical and systematic
uncer-tainties are shown as bars and boxes, respectively.
by-event fluctuations in the initial nucleon and gluon density.
All flow coefficients increase monotonically with increasing pT up to 3-4 GeV/c where a maximum is
reached. The position of this maximum depends on centrality and particle species as it takes place at higher pT for heavier particles for various centrality classes. This behaviour can be explained by the
centrality dependence of radial flow combined with the parton density, which will be detailed in Sec. 4.4. Figure 5 presents the evolution of vn(pT) of different particle species for various centrality classes. In the
most central collisions, initial nucleon-density fluctuations are expected to be the main contributor to the generation of vn. For the 0–1% centrality interval, v3is the dominant flow coefficient for 1.5 < pT< 6.0
GeV/c, 2.0 < pT< 4 GeV/c, and 2.5 < pT< 6 GeV/c for π±, K±, and p+p, respectively. Furthermore,
v4becomes equal to v2at pT≈ 2.0 GeV/c (2.2, 2.5) for π±(K±, p+p), after which it increases gradually
and reaches a magnitude similar to v3 at around 3.5 GeV/c. A similar trend is observed in the 0–5%
centrality class for all particle species. However, the crossing between flow coefficients (the pTvalue at
which they reach a similar magnitude), which also depends on the particle mass, takes place at different pT values than for the 0–1% centrality interval. This dependence of the crossing between different flow
coefficients can be attributed to the interplay of elliptic, triangular, and quadrangular flow with radial flow. Upwards of 5% collision centrality, v2 is larger than v3 and v4, confirming the hypothesis that
collision geometry dominates the generation of flow coefficients.
Figure 6 shows the v2(pT) of π±, K±, p+p, Λ+Λ, K0S, and the φ -meson in a given centrality interval
arranged into panels of various centrality classes, which allows for further illustration of the interplay between elliptic and radial flow. For pT< 2-3 GeV/c, v2of the different particle species is mass-ordered,
meaning that lighter particles have a larger v2 than heavier particles at the same pT. This behaviour is
indicative of strong radial flow which imposes an equal, isotropic velocity boost to all particles in addition to the anisotropic expansion of the medium [20–22]. For 3 < pT < 8-10 GeV/c, particles are grouped
according to their number of constituent quarks, which supports the hypothesis of particle production via quark coalescence [34]. Particle type scaling and mass ordering are most directly tested by the φ -meson v2, as its mass is close to the proton mass. Figure 6 demonstrates that the φ -meson v2 follows proton
v2 at low pT, but pion v2at intermediate pT in all centrality classes. The crossing between meson and
baryon v2, which depends on the particle species, happens at higher pTvalues for central than peripheral
collisions as a result of the larger radial flow in the former. Lastly, it is seen that the v2of baryons is higher
than that of mesons up to pT ≈ 10 GeV/c, indicating that particle type dependence of v2 persists up to
high pT. For pT> 10 GeV/c, where v2 depends only weakly on transverse momentum, the magnitude
of p+p v2is compatible with that for π±within statistical and systematic uncertainties. Furthermore, the
nuclear modification factor in this high pT region is found to be the same for the two particle species
) c (GeV/T p 0 2 4 6 8 10 0 0.05 0.1 0-1% ±π ) c (GeV/T p 0 2 4 6 8 10 0 0.05 0.1 0-5% ±π ) c (GeV/T p 0 2 4 6 8 10 0 0.05 0.1 0.15 5-10% ±π ) c (GeV/T p 0 2 4 6 8 10 |>2} η ∆ {2, | n v 0 0.1 0.2 10-20% ±π ) c (GeV/T p 0 2 4 6 8 10 0 0.1 0.2 20-30% ±π ) c (GeV/T p 0 2 4 6 8 10 0 0.1 0.2 0.3 30-40% ±π ) c (GeV/ T p 0 2 4 6 8 10 0 0.1 0.2 0.3 40-50% ±π ) c (GeV/T p 0 0.5 1 1.5 2 2.5 3 3.5 4 0 0.05 0.1 ± K ) c (GeV/T p 0 0.5 1 1.5 2 2.5 3 3.5 4 0 0.05 0.1 ± K ) c (GeV/T p 0 0.5 1 1.5 2 2.5 3 3.5 4 0 0.05 0.1 0.15 ± K ) c (GeV/T p 0 0.5 1 1.5 2 2.5 3 3.5 4 0 0.1 0.2 ± K ) c (GeV/T p 0 0.5 1 1.5 2 2.5 3 3.5 4 0 0.1 0.2 ± K ) c (GeV/T p 0 0.5 1 1.5 2 2.5 3 3.5 4 0 0.1 0.2 0.3 ± K ) c (GeV/ T p 0 0.5 1 1.5 2 2.5 3 3.5 4 0 0.1 0.2 0.3 ± K ) c (GeV/ T p 0 2 4 6 8 10 0 0.05 0.1 p p+ ) c (GeV/ T p 0 2 4 6 8 10 0 0.05 0.1 p p+ ) c (GeV/ T p 0 2 4 6 8 10 0 0.05 0.1 0.15 p p+ ) c (GeV/ T p 0 2 4 6 8 10 0 0.1 0.2 p p+ ) c (GeV/ T p 0 2 4 6 8 10 0 0.1 0.2 p p+ ) c (GeV/ T p 0 2 4 6 8 10 0 0.1 0.2 0.3 p p+ ) c (GeV/ T p 0 2 4 6 8 10 0 0.1 0.2 0.3 p p+ ) c (GeV/ T p 2 v v3 v4 ) c (GeV/ T p 0 2 4 6 8 0 0.05 0.1 0 S K ) c (GeV/ T p 0 2 4 6 8 0 0.05 0.1 0.15 0 S K ) c (GeV/ T p 0 2 4 6 8 0 0.1 0.2 0 S K ) c (GeV/ T p 0 2 4 6 8 0 0.1 0.2 0 S K ) c (GeV/ T p 0 2 4 6 8 0 0.1 0.2 0.3 0 S K ) c (GeV/ T p 0 2 4 6 8 0 0.1 0.2 0.3 0 S K ) c (GeV/T p = 5.02 TeV NN s Pb − ALICE Pb | < 0.5y| ) c (GeV/T p 0 2 4 6 8 0 0.05 0.1 Λ + Λ ) c (GeV/T p 0 2 4 6 8 0 0.05 0.1 0.15 Λ + Λ ) c (GeV/T p 0 2 4 6 8 0 0.1 0.2 Λ + Λ ) c (GeV/T p 0 2 4 6 8 0 0.1 0.2 Λ + Λ ) c (GeV/T p 0 2 4 6 8 0 0.1 0.2 0.3 Λ + Λ ) c (GeV/ T p 0 2 4 6 8 0 0.1 0.2 0.3 Λ + Λ Fig . 5: (Colour online) The ev olution of vn ( pT ) of π ± , K ± , p+ p, Λ + Λ , and K 0 forS v arious centr ality classes. Statistical and systematic uncertainties are sho wn as bars and box es, respecti v ely .
) c (GeV/ T p 0 2 4 6 8 10 12 14 |>2} η∆ {2, |2 v 0 0.05 0.1 0.15 0-1% π±± K p p+ φ 0 S K Λ + Λ ) c (GeV/ T p 0 2 4 6 8 10 12 14 |>2} η∆ {2, |2 v 0 0.1 0.2 0.3 10-20% ) c (GeV/ T p 0 2 4 6 8 10 12 14 |>2} η∆ {2, |2 v 0 0.1 0.2 0.3 40-50% ) c (GeV/ T p 0 2 4 6 8 10 12 14 |>2} η∆ {2, |2 v 0 0.05 0.1 0.15 = 5.02 TeV 0-5% NN s Pb − ALICE Pb | < 0.5 y | ) c (GeV/ T p 0 2 4 6 8 10 12 14 |>2} η∆ {2, |2 v 0 0.1 0.2 0.3 20-30% ) c (GeV/ T p 0 2 4 6 8 10 12 14 |>2} η∆ {2, |2 v 0 0.1 0.2 0.3 50-60% ) c (GeV/ T p 0 2 4 6 8 10 12 14 |>2} η∆ {2, |2 v 0 0.05 0.1 0.15 5-10% ) c (GeV/ T p 0 2 4 6 8 10 12 14 |>2} η∆ {2, |2 v 0 0.1 0.2 0.3 30-40% ) c (GeV/ T p 0 2 4 6 8 10 12 14 |>2} η∆ {2, |2 v 0 0.1 0.2 0.3 60-70%
Fig. 6: (Colour online) The pT-differential v2of π±, K±, p+p, Λ+Λ, K0S, and the φ -meson for various centrality
classes. Statistical and systematic uncertainties are shown as bars and boxes, respectively.
) c (GeV/ T p 0 2 4 6 8 10 |>2} η∆ {2, |3 v 0 0.05 0.1 0.15 0-1% ) c (GeV/ T p 0 2 4 6 8 10 |>2} η∆ {2, |3 v 0 0.05 0.1 0.15 10-20% (GeV/c) T p 0 2 4 6 8 10 |>2} η∆ {2, |3 v 0 0.05 0.1 0.15 0-5% ) c (GeV/ T p 0 2 4 6 8 10 |>2} η∆ {2, |3 v 0 0.05 0.1 0.15 20-30% (GeV/c) T p 0 2 4 6 8 10 |>2} η∆ {2, |3 v 0 0.05 0.1 0.15 5-10% ) c (GeV/ T p 0 2 4 6 8 10 |>2} η∆ {2, |3 v 0 0.05 0.1 0.15 30-40% ± π ± K p p+ 0 S K Λ + Λ = 5.02 TeV NN s Pb − ALICE Pb | < 0.5 y | ) c (GeV/ T p 0 2 4 6 8 10 |>2} η∆ {2, |3 v 0 0.05 0.1 0.15 40-50%
Fig. 7: (Colour online) The pT-differential v3of π±, K±, p+p, Λ+Λ, and K0Sfor various centrality classes.
Statis-tical and systematic uncertainties are shown as bars and boxes, respectively.
Figures 7 and 8 present the v3(pT) and v4(pT) for different particle species in a given centrality interval.
Both v3and v4show a clear mass ordering at pT< 2-3 GeV/c, confirming the interplay between
trian-gular and quadrantrian-gular flow and radial flow. For 3 < pT< 8 GeV/c, particles are grouped into mesons
and baryons and, analogous to the trend of v2in this pT region, the flow of baryons is larger than that of
mesons. The crossing between meson and baryon v3and v4 also exhibits a centrality and particle mass
dependence.
) c (GeV/ T p 0 1 2 3 4 5 |>2} η∆ {2, |4 v 0 0.05 0.1 0-1% ) c (GeV/ T p 0 1 2 3 4 5 |>2} η∆ {2, |4 v 0 0.05 0.1 0.15 10-20% pT (GeV/c) 0 1 2 3 4 5 |>2} η∆ {2, |4 v 0 0.05 0.1 0-5% ) c (GeV/ T p 0 1 2 3 4 5 |>2} η∆ {2, |4 v 0 0.05 0.1 0.15 20-30% pT (GeV/c) 0 1 2 3 4 5 |>2} η∆ {2, |4 v 0 0.05 0.1 5-10% ) c (GeV/ T p 0 1 2 3 4 5 |>2} η∆ {2, |4 v 0 0.05 0.1 0.15 30-40% ± π ± K p p+ = 5.02 TeV NN s Pb − ALICE Pb | < 0.5 y | ) c (GeV/ T p 0 1 2 3 4 5 |>2} η∆ {2, |4 v 0 0.05 0.1 0.15 40-50%
Fig. 8: (Colour online) The pT-differential v4of π±, K±, and p+p for various centrality classes. Statistical and
systematic uncertainties are shown as bars and boxes, respectively.
centrality classes. A difference in vn(pT) is found between the K±and K0Smeasurements: the magnitude
of K0S vn is systematically smaller than the magnitude of K± vn. This difference in vn exhibits no pT
dependence, but changes with centrality for v2. For 0.8 < pT< 4.0 GeV/c, the difference in v2 ranges
from 7% ± 3.5%(syst) ± 0.7%(stat) in the most central collisions to 1.5% ± 1.5%(syst) ± 0.4%(stat) in peripheral collisions. In the same kinematic range, a deviation in v3 of 6.5% ± 5%(syst) ± 1.7%(stat)
is found in the most central collisions and of 6% ± 4.5%(syst) ± 1%(stat) in peripheral collisions. This difference is similar in magnitude and centrality dependence as the one reported by ALICE in Pb–Pb collisions at√sNN= 2.76 TeV in [27].
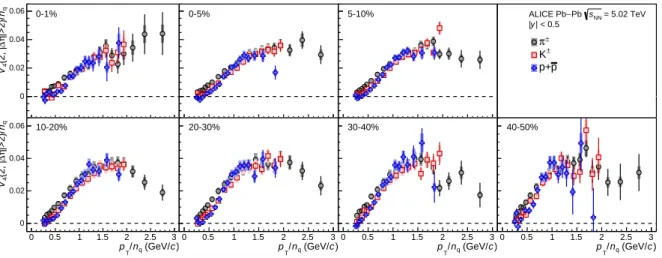
4.2 Scaling properties
To test the hypothesis of particle production via quark coalescence [34], which would lead to a grouping of vnof mesons and baryons at intermediate pT, both vnand pTare divided by the number of constituent
quarks (nq) independently for each particle species. The v2/nq, v3/nq, and v4/nqof π±, K±, p+p, Λ+Λ,
K0S, and the φ -meson, plotted as a function of pT/nq, are reported in Figs. 9, 10, and 11 for various
centrality classes.
For pT/nq> 1 GeV/c, the scaling is only approximate. To quantify the degree to which the
measure-ments deviate from the nq scaling, the pT/nq dependence of vn/nq has been divided by a cubic spline
fit to the p+p vn/nq. In the region where quark coalescence is hypothesized to be the dominant process
(≈ 1 < pT/nq < 3 GeV/c) [34, 81], a deviation from the exact scaling of ± 20% is found for v2 for
central collisions, which decreases to ±15% for the most peripheral collisions. For higher harmonics, a ±20% deviation is found for all centrality classes. This deviation is in agreement with earlier observa-tions [27, 28, 32].
4.3 Comparison with model calculations
To test the validity of the hydrodynamic description of the QGP evolution, the vn measurements in
the 0–5%, 10–20% and 40–50% centrality intervals are compared to hydrodynamical calculations in Figs. 12, 13, and 14 for π±, K±, and p+p, respectively. Predictions from MUSIC [82] and iEBE-VISHNU [83] simulations are depicted by the different coloured curves. The first calculation is based on MUSIC [84], an event-by-event 3+1 dimensional viscous hydrodynamic model, coupled to a hadronic cascade model (UrQMD) [85, 86], which allows the influence of the hadronic phase on the anisotropic flow to be studied for different particle species. The IP-Glasma model [87, 88] is used to simulate
) c (GeV/ q n / T p 0 1 2 3 4 5 6 7 q n/ |>2} η∆ {2, |2 v 0 0.02 0.04 0.06 0-1% π±± K p p+ φ 0 S K Λ + Λ ) c (GeV/ q n / T p 0 1 2 3 4 5 6 7 q n/ |>2} η∆ {2, |2 v 0 0.05 0.1 10-20% ) c (GeV/ q n / T p 0 1 2 3 4 5 6 7 q n/ |>2} η∆ {2, |2 v 0 0.05 0.1 40-50% ) c (GeV/ q n / T p 0 1 2 3 4 5 6 7 q n/ |>2} η∆ {2, |2 v 0 0.02 0.04 0.06 0-5% = 5.02 TeV NN s Pb − ALICE Pb | < 0.5 y | ) c (GeV/ q n / T p 0 1 2 3 4 5 6 7 q n/ |>2} η∆ {2, |2 v 0 0.05 0.1 20-30% ) c (GeV/ q n / T p 0 1 2 3 4 5 6 7 q n/ |>2} η∆ {2, |2 v 0 0.05 0.1 50-60% ) c (GeV/ q n / T p 0 1 2 3 4 5 6 7 q n/ |>2} η∆ {2, |2 v 0 0.02 0.04 0.06 5-10% ) c (GeV/ q n / T p 0 1 2 3 4 5 6 7 q n/ |>2} η∆ {2, |2 v 0 0.05 0.1 30-40% ) c (GeV/ q n / T p 0 1 2 3 4 5 6 7 q n/ |>2} η∆ {2, |2 v 0 0.05 0.1 60-70%
Fig. 9: (Colour online) The pT/nqdependence of v2/nqof π±, K±, p+p, Λ+Λ, K0S, and the φ -meson for various
centrality classes. Statistical and systematic uncertainties are shown as bars and boxes, respectively.
) c (GeV/ q n / T p 0 1 2 3 4 5 q n/ |>2} η∆ {2, |3 v 0 0.02 0.04 0.06 0-1% ) c (GeV/ q n / T p 0 1 2 3 4 5 q n/ |>2} η∆ {2, |3 v 0 0.02 0.04 0.06 10-20% (GeV/c) q n / T p 0 1 2 3 4 5 q n/ |>2} η∆ {2, |3 v 0 0.02 0.04 0.06 0-5% ) c (GeV/ q n / T p 0 1 2 3 4 5 q n/ |>2} η∆ {2, |3 v 0 0.02 0.04 0.06 20-30% (GeV/c) q n / T p 0 1 2 3 4 5 q n/ |>2} η∆ {2, |3 v 0 0.02 0.04 0.06 5-10% ) c (GeV/ q n / T p 0 1 2 3 4 5 q n/ |>2} η∆ {2, |3 v 0 0.02 0.04 0.06 30-40% ± π ± K p p+ 0 S K Λ + Λ = 5.02 TeV NN s Pb − ALICE Pb | < 0.5 y | ) c (GeV/ q n / T p 0 1 2 3 4 5 q n/ |>2} η∆ {2, |3 v 0 0.02 0.04 0.06 40-50%
Fig. 10: (Colour online) The pT/nqdependence of v3/nqof π±, K±, p+p, Λ+Λ, and K0S for various centrality
classes. Statistical and systematic uncertainties are shown as bars and boxes, respectively.
the initial conditions of the collision. MUSIC uses a starting time for the hydrodynamic evolution of τ0= 0.4 fm/c, a switching temperature between the macroscopic hydrodynamic description and the
mi-croscopic transport evolution of Tsw= 145 MeV, a value of η/s = 0.095, and a temperature dependent
ζ /s. The second calculation employs the iEBE-VISHNU hybrid model [89], which is an event-by-event version of the VISHNU hybrid model [90], and couples 2+1 dimensional viscous hydrodynamics VISH2+1 [78] to UrQMD. The TRENTo [91] and AMPT [92] models are used to describe the initial con-ditions. For both configurations, τ0= 0.6 fm/c and Tsw= 148 MeV are set from [93], where these values
) c (GeV/ q n / T p 0 0.5 1 1.5 2 2.5 3 q n/ |>2} η∆ {2, |4 v 0 0.02 0.04 0.06 0-1% ) c (GeV/ q n / T p 0 0.5 1 1.5 2 2.5 3 q n/ |>2} η∆ {2, |4 v 0 0.02 0.04 0.06 10-20% (GeV/c) q n / T p 0 0.5 1 1.5 2 2.5 3 q n/ |>2} η∆ {2, |4 v 0 0.02 0.04 0.06 0-5% ) c (GeV/ q n / T p 0 0.5 1 1.5 2 2.5 3 q n/ |>2} η∆ {2, |4 v 0 0.02 0.04 0.06 20-30% (GeV/c) q n / T p 0 0.5 1 1.5 2 2.5 3 q n/ |>2} η∆ {2, |4 v 0 0.02 0.04 0.06 5-10% ) c (GeV/ q n / T p 0 0.5 1 1.5 2 2.5 3 q n/ |>2} η∆ {2, |4 v 0 0.02 0.04 0.06 30-40% ± π ± K p p+ = 5.02 TeV NN s Pb − ALICE Pb | < 0.5 y | ) c (GeV/ q n / T p 0 0.5 1 1.5 2 2.5 3 q n/ |>2} η∆ {2, |4 v 0 0.02 0.04 0.06 40-50%
Fig. 11: (Colour online) The pT/nq dependence of v4/nq of π±, K±, and p+p for various centrality classes.
Statistical and systematic uncertainties are shown as bars and boxes, respectively.
)
c
(GeV/
Tp
0.5
1
1.5
2
2.5
|>2} η∆ {2, |2 v 0.05 0.1 0.15 0.2 ALICEMUSIC + IP-Glasma IC + UrQMD iEBE-VISHNU + AMPT IC + UrQMD iEBE-VISHNU + TRENTo IC + UrQMD
0-5%
)
c
(GeV/
Tp
0.5
1
1.5
2
2.5
|>2} η∆ {2, |2 v 0.05 0.1 0.15 0.2 = 5.02 TeV NN s Pb − ALICE Pb | < 0.5 y | π± 10-20%)
c
(GeV/
Tp
0.5
1
1.5
2
2.5
|>2} η∆ {2, |2 v 0.05 0.1 0.15 0.2 40-50% ) c (GeV/ T p 0.5 1 1.5 2 2.5 model data 0.5 1 ) c (GeV/ T p 0.5 1 1.5 2 2.5 model data 0.5 1 ) c (GeV/ T p 0.5 1 1.5 2 2.5 model data 0.5 1)
c
(GeV/
Tp
0.5
1
1.5
2
2.5
|>2} η∆ {2, |3 v 0.05 0.1 0-5%)
c
(GeV/
Tp
0.5
1
1.5
2
2.5
|>2} η∆ {2, |3 v 0.05 0.1 10-20%)
c
(GeV/
Tp
0.5
1
1.5
2
2.5
|>2} η∆ {2, |3 v 0.05 0.1 40-50% ) c (GeV/ T p 0.5 1 1.5 2 2.5 model data 0.5 1 ) c (GeV/ T p 0.5 1 1.5 2 2.5 model data 0.5 1 ) c (GeV/ T p 0.5 1 1.5 2 2.5 model data 0.5 1 ) c (GeV/ T p 0.5 1 1.5 2 2.5 |>2} η∆ {2, |4 v 0.02 0.04 0.06 0.08 0-5% ) c (GeV/ T p 0.5 1 1.5 2 2.5 |>2} η∆ {2, |4 v 0.02 0.04 0.06 0.08 10-20% ) c (GeV/ T p 0.5 1 1.5 2 2.5 |>2} η∆ {2, |4 v 0.02 0.04 0.06 0.08 40-50% ) c (GeV/ T p 0.5 1 1.5 2 2.5 model data 0.51 1.5 ) c (GeV/ T p 0.5 1 1.5 2 2.5 model data 0.5 1 1.5 ) c (GeV/ T p 0.5 1 1.5 2 2.5 model data 0.5 1 1.5Fig. 12: (Colour online) The pT-differential v2(top), v3(middle), and v4(bottom) of π±for the 0–5%, 10–20%,
and 40–50% centrality classes compared to hydrodynamical calculations from MUSIC model using IP-Glasma initial conditions (magenta) [82] and the iEBE-VISHNU hybrid model using AMPT (orange) or TRENTo (cyan) initial conditions [83]. Statistical and systematic uncertainties of the data points are shown as bars and boxes, respectively. The uncertainties of the hydrodynamical calculations are depicted by the thickness of the curves. The
)
c
(GeV/
Tp
0.5
1
1.5
2
2.5
|>2} η∆ {2, |2 v 0.05 0.1 0.15 0.2 ALICEMUSIC + IP-Glasma IC + UrQMD iEBE-VISHNU + AMPT IC + UrQMD iEBE-VISHNU + TRENTo IC + UrQMD
0-5%
)
c
(GeV/
Tp
0.5
1
1.5
2
2.5
|>2} η∆ {2, |2 v 0.05 0.1 0.15 0.2 = 5.02 TeV NN s Pb − ALICE Pb | < 0.5 y | K± 10-20%)
c
(GeV/
Tp
0.5
1
1.5
2
2.5
|>2} η∆ {2, |2 v 0.05 0.1 0.15 0.2 40-50% ) c (GeV/ T p 0.5 1 1.5 2 2.5 model data 0.5 1 ) c (GeV/ T p 0.5 1 1.5 2 2.5 model data 0.5 1 ) c (GeV/ T p 0.5 1 1.5 2 2.5 model data 0.5 1)
c
(GeV/
Tp
0.5
1
1.5
2
2.5
|>2} η∆ {2, |3 v 0.05 0.1 0-5%)
c
(GeV/
Tp
0.5
1
1.5
2
2.5
|>2} η∆ {2, |3 v 0.05 0.1 10-20%)
c
(GeV/
Tp
0.5
1
1.5
2
2.5
|>2} η∆ {2, |3 v 0.05 0.1 40-50% ) c (GeV/ T p 0.5 1 1.5 2 2.5 model data 0.5 1 ) c (GeV/ T p 0.5 1 1.5 2 2.5 model data 0.5 1 ) c (GeV/ T p 0.5 1 1.5 2 2.5 model data 0.5 1 ) c (GeV/ T p 0.5 1 1.5 2 2.5 |>2} η∆ {2, |4 v 0 0.02 0.04 0.06 0.08 0-5% ) c (GeV/ T p 0.5 1 1.5 2 2.5 |>2} η∆ {2, |4 v 0 0.02 0.04 0.06 0.08 10-20% ) c (GeV/ T p 0.5 1 1.5 2 2.5 |>2} η∆ {2, |4 v 0 0.02 0.04 0.06 0.08 40-50% ) c (GeV/ T p 0.5 1 1.5 2 2.5 model data 0.5 1 1.5 ) c (GeV/ T p 0.5 1 1.5 2 2.5 model data 0.5 1 1.5 ) c (GeV/ T p 0.5 1 1.5 2 2.5 model data 0.5 1 1.5Fig. 13: (Colour online) The pT-differential v2(top), v3(middle), and v4(bottom) of K±for the 0–5%, 10–20%,
and 40–50% centrality classes compared to hydrodynamical calculations from MUSIC model using IP-Glasma initial conditions (magenta) [82] and the iEBE-VISHNU hybrid model using AMPT (orange) or TRENTo (cyan) initial conditions [83]. Statistical and systematic uncertainties of the data points are shown as bars and boxes, respectively. The uncertainties of the hydrodynamical calculations are depicted by the thickness of the curves. The
ratios of the measured vnto a fit to the hydrodynamical calculations are also presented for clarity.
mean transverse momentum, and integrated flow coefficients vnin Pb–Pb collisions at
√
sNN= 2.76 TeV.
The temperature-dependent η/s and ζ /s extracted in [93] are used for TRENTo initial conditions, while η /s = 0.08 and ζ /s = 0 are taken for AMPT.
Figures 12, 13, and 14 show that the hydrodynamical calculations qualitatively reproduce the vn
mea-surements. The differences between the data points and models are visualized in Figs. 12, 13, and 14 as the ratios of the measured vn to a fit to the theoretical calculations. The iEBE-VISHNU calculations
using AMPT initial conditions describe the pT-differential vn of π±, K±, and p+p more accurately than
TRENTo based and MUSIC calculations for pT> 1 GeV/c. Using AMPT initial conditions, there is
good agreement between π± and K± vnand iEBE-VISHNU calculations for pT< 2 GeV/c, while p+p
vn is described fairly well up to pT= 3 GeV/c. The TRENTo based predictions follow π± and K± vn
up to slightly lower transverse momenta (pT <1-2 GeV/c) and to pT < 3 GeV/c for p+p, depending
on the considered centrality interval. The MUSIC calculations are in agreement with the measured vn
for pT < 1 GeV/c in central collisions, however they overestimate v2 at lower pT in more peripheral
)
c
(GeV/
Tp
0.811.2
1.4
1.61.822.2
2.42.6
2.8
|>2} η∆ {2, |2 v 0 0.1 0.2 0.3 ALICEMUSIC + IP-Glasma IC + UrQMD iEBE-VISHNU + AMPT IC + UrQMD iEBE-VISHNU + TRENTo IC + UrQMD
0-5%
)
c
(GeV/
Tp
0.811.2
1.4
1.6
1.822.2
2.4
2.6
2.8
|>2} η∆ {2, |2 v 0 0.1 0.2 0.3 = 5.02 TeV NN s Pb − ALICE Pb | < 0.5 y | p+p 10-20%)
c
(GeV/
Tp
0.811.2
1.4
1.6
1.822.2
2.4
2.6
2.8
|>2} η∆ {2, |2 v 0 0.1 0.2 0.3 40-50% ) c (GeV/ T p 0.8 1 1.2 1.4 1.6 1.8 2 2.2 2.4 2.6 2.8 model data 1 1.5 ) c (GeV/ T p 0.8 1 1.2 1.4 1.6 1.8 2 2.2 2.4 2.6 2.8 model data 1 1.5 ) c (GeV/ T p 0.8 1 1.2 1.4 1.6 1.8 2 2.2 2.4 2.6 2.8 model data 1 1.5)
c
(GeV/
Tp
0.8 11.21.41.61.822.22.42.62.8
|>2} η∆ {2, |3 v 0 0.05 0.1 0-5%)
c
(GeV/
Tp
0.811.21.41.61.822.22.42.62.8
|>2} η∆ {2, |3 v 0 0.05 0.1 10-20%)
c
(GeV/
Tp
0.811.21.41.61.822.22.42.62.8
|>2} η∆ {2, |3 v 0 0.05 0.1 40-50% ) c (GeV/ T p 0.8 1 1.2 1.4 1.6 1.8 2 2.2 2.4 2.6 2.8 model data 1 1.5 ) c (GeV/ T p 0.8 1 1.2 1.4 1.6 1.8 2 2.2 2.4 2.6 2.8 model data 1 1.5 ) c (GeV/ T p 0.8 1 1.2 1.4 1.6 1.8 2 2.2 2.4 2.6 2.8 model data 1 1.5 ) c (GeV/ T p 0.8 11.21.41.61.8 2 2.22.42.62.8 |>2} η∆ {2, |4 v 0 0.05 0.1 0-5% ) c (GeV/ T p 0.8 11.21.41.61.8 2 2.22.42.62.8 |>2} η∆ {2, |4 v 0 0.05 0.1 10-20% ) c (GeV/ T p 0.8 11.21.41.61.8 2 2.22.42.62.8 |>2} η∆ {2, |4 v 0 0.05 0.1 40-50% ) c (GeV/ T p 0.8 1 1.2 1.4 1.6 1.8 2 2.2 2.4 2.6 2.8 model data 0.51 1.5 ) c (GeV/ T p 0.8 1 1.2 1.4 1.6 1.8 2 2.2 2.4 2.6 2.8 model data 0.5 1 1.5 ) c (GeV/ T p 0.8 1 1.2 1.4 1.6 1.8 2 2.2 2.4 2.6 2.8 model data 0.5 1 1.5Fig. 14: (Colour online) The pT-differential v2(top), v3(middle), and v4(bottom) of p+p for the 0–5%, 10–20%,
and 40–50% centrality classes compared to hydrodynamical calculations from MUSIC model using IP-Glasma initial conditions (magenta) [82] and the iEBE-VISHNU hybrid model using AMPT (orange) or TRENTo (cyan) initial conditions [83]. Statistical and systematic uncertainties of the data points are shown as bars and boxes, respectively. The uncertainties of the hydrodynamical calculations are depicted by the thickness of the curves. The
ratios of the measured vnto a fit to the hydrodynamical calculations are also presented for clarity.
4.4 Shape evolution of vn(pT) as function of centrality
The evolution of the shape of vn(pT) as function of centrality is quantified by taking the ratio of vn(pT)
in a given centrality interval to the vn(pT) measured in the 20–30% centrality interval
vn(pT)ratio to 20−30%= vn(pT) vn(pT)|20−30% vn|20−30% vn , (5)
where the second fraction on the right-hand side of the equation serves as a normalization factor which is constructed from the pT-integrated vnvalues obtained in the 20–30% centrality interval (vn|20−30%) and
the centrality interval of interest (vn). Centrality-dependent variations in the shape of vn(pT) will present
themselves as deviations from unity of the observed vn(pT)ratio to 20−30%.
The shape evolution of elliptic and triangular flow is shown in Figs. 15 and 16 for π±, K±, p+p, and inclusive charged particles (the latter taken from [44]). For inclusive charged particles, variations in shape of about 10% are observed for pT< 3 GeV/c, which increase to about 30% for pT< 6 GeV/c. The
shape evolution of v2(pT) shows different trends for π±, K±, and p+p. While π± v2(pT)ratio to 20−30%
follows inclusive charged particle over the considered pT range, the elliptic flow of p+p (K±) varies
between 20% (10%) to 250% (55%) at low pTfrom most central to peripheral collisions. The variations
are more pronounced for v3(pT), in particular for central collisions. The mass dependence found in the