Accepted Manuscript
Comparison of Microwave, Ultrasound and Accelerated-Assisted Solvent Ex-traction for Recovery of Polyphenols from Citrus Sinensis Peels
Balunkeswar Nayak, Farid Dahmoune, Kamal Moussi, Hocine Remini, Sofiane Dairi, Omar Aoun, Madani Khodir
PII: S0308-8146(15)00627-5
DOI: http://dx.doi.org/10.1016/j.foodchem.2015.04.081
Reference: FOCH 17482
To appear in: Food Chemistry
Received Date: 11 November 2014 Revised Date: 16 April 2015 Accepted Date: 18 April 2015
Please cite this article as: Nayak, B., Dahmoune, F., Moussi, K., Remini, H., Dairi, S., Aoun, O., Khodir, M., Comparison of Microwave, Ultrasound and Accelerated-Assisted Solvent Extraction for Recovery of Polyphenols from Citrus Sinensis Peels, Food Chemistry (2015), doi: http://dx.doi.org/10.1016/j.foodchem.2015.04.081
This is a PDF file of an unedited manuscript that has been accepted for publication. As a service to our customers we are providing this early version of the manuscript. The manuscript will undergo copyediting, typesetting, and review of the resulting proof before it is published in its final form. Please note that during the production process errors may be discovered which could affect the content, and all legal disclaimers that apply to the journal pertain.
Full title:
1
Comparison of Microwave, Ultrasound and Accelerated-Assisted Solvent Extraction for 2
Recovery of Polyphenols from Citrus Sinensis Peels 3
Running title: 4
Comparison of extraction methods for Polyphenols from Citrus Peels 5
Balunkeswar Nayak a,*, Farid Dahmoune b,c; Kamal Moussi c, Hocine Remini c, Sofiane Dairi c, 6
Omar Aoun c,d, Madani Khodir c 7
a
School of Food and Agriculture, University of Maine, Orono, ME 04469, United States. 8
balunkeswar.nayak@maine.edu 9
b
Laboratoire Biomathématiques Biophysique Biochimie et de Scientométrie (L3BS). Faculté des Sciences de la
10
Nature et de la Vie et des Sciences de la Terre. Université de Bouira. 10000 Bouira. Algérie. 11
farid.dahmoune@univ-bejaia.dz 12
c
Laboratoire Biomathématiques Biophysique Biochimie et de Scientométrie (L3BS). Faculté des Sciences de la 13
Nature et de la Vie Université de Bejaia. 06000 Bejaia Algérie. ;moussi_kamal2012@yahoo.fr ; 14
hocine.remini@univ-bejaia.dz ;sofiane.dairi@univ-bejaia.dz ;khodir.madani@univ-bejaia.dz 15
d
Laboratoire Biomathématiques Biophysique Biochimie et de Scientométrie (L3BS). Faculté des Sciences de la
16
Nature et de la Vie et des Sciences de la Terre. Université de Khemis Miliana. 44225 Khemis Miliana. Algérie. 17
omar.aoun@univ-bejaia.fr 18
*
Author to whom correspondence should be addressed; 5737 Hitchner Hall, Orono, ME 04469. Phone: +1-2075811687; E-Mail: balunkeswar.nayak@maine.edu (B. Nayak)
Abstract
19
Peel of Citrus sinensis contains significant amounts of bioactive polyphenols that 20
could be used as ingredients for a number of value-added products with health benefits. 21
Extraction of polyphenols from the peels was performed using a microwave-assisted 22
extraction (MAE) technique. The effects of aqueous acetone concentration, microwave 23
power, extraction time and solvent-to-solid ratio on the total phenolic content (TPC), total 24
antioxidant activity (TAA) (using DPPH and ORAC-values) and individual phenolic acids 25
(IPA) were investigated using a response surface method. The TPC, TAA and IPA of peel 26
extracts using MAE was compared with conventional, ultrasound-assisted and accelerated 27
solvent extraction. The maximum predicted TPC under the optimal MAE conditions (51% 28
acetone concentration in water (v/v), 500 W microwave power, 122 s extraction time and 25 29
mL g−1 solvent to solid ratio), was 12.20 mg GAE g−1 DW. The TPC and TAA in MAE
30
extracts were higher than the other three extracts. 31
Keywords: Citrus sinensis; microwave extraction; ultrasound extraction; accelerated solvent 32
extraction, phenolic compounds; antioxidant activity; response surface method 33
1. Introduction
34
Citrus is one of the most important fruit crops in the world. Production of citrus fruits 35
has increased enormously in the last few decades, going from an average of 62 million tons a 36
year in the period 1987–1989 to about 100 million tons in the year 2010 (Food and 37
Agriculture Organization, 2014). Citrus is grown in more than 100 countries all over the 38
world, mainly in tropical and subtropical areas, where favorable soil and climatic conditions 39
prevail for citrus cultivation. Citrus fruits are marketed mainly as fresh fruit or as processed 40
juice. During processing of citrus fruits, huge amount of peels are generated as by-product, 41
which do not add value to the product as these are discarded or dumped. Potential use of 42
citrus peels as value-added products has been widely studied because it contains numerous 43
biologically active compounds including natural antioxidants such as phenolic compounds 44
(Hayat, Hussain, Abbas, Farooq, Ding, Xia, et al., 2009). Citrus phenolics have been the 45
subject of increased interest in the last few years because of their contributions to the quality 46
attributes with color, bitterness, astringency, antioxidant activity and flavor (Legua, Forner, 47
Hernández, & Forner-Giner, 2014). In recent years, the physiological function of foods 48
including fruits, vegetables, legumes and grains, and food components such as 49
phytochemicals has received much attention. Possible correlations between the biologically 50
active compounds and human health have generated interest in in-vitro and in-vivo studies. 51
Phenolic compounds are a major class of phytochemicals found in plants and consist of a 52
large variety of derivatives including simple phenols, phenylpropanoids, benzoic acid 53
derivatives, flavonoids, tannins, lignans and lignins. These compounds have diverse 54
properties as antioxidants, anti-inflammatory, anti-allergic, and ant-carcinogenic activity, and 55
these properties improve the quality and value of the food (Liu, 2004). The antioxidant 56
property is associated with the ability of the phenolic compounds to scavenge free radicals, 57
break radical chain reactions and chelate metals. It was also found that the phenolic 58
compounds inhibit human immunodeficiency viral replication (HIV), human simplex virus 59
(HSV), glucosyl transferases of Streptococcus mutans (dental carries), ascorbate auto-60
oxidation (green tea), cytotoxic effects, tumor promotion and xanthine and monoamine 61
oxidases (Proestos, Boziaris, Nychas, & Komaitis, 2006). 62
Phytochemicals from the citrus peels could add value to the citrus processing industry 63
when the compounds are extracted effectively by applying efficient extraction technologies. 64
Optimization and standardization of extraction parameters for these health benefitting 65
bioactive phytochemicals from citrus peels are important to retain their antioxidative 66
properties. Application of various techniques for sample preparation and processing of 67
bioactive compounds from plant materials have been reviewed by many researchers 68
(Chumnanpaisont, Niamnuy, & Devahastin, 2014; Fernández-Agulló, Freire, Antorrena, 69
Pereira, & González-Álvarez, 2013). The first step of processing is “extraction”, which 70
involves separation of phytochemicals from the cellular matrix of citrus peel. There are 71
various methods for extracting phenolic compounds such as leaching-out extraction (Zhang, 72
Bi, & Liu, 2007). Generally, extraction is being carried out using conventional technologies 73
such as solvent extraction (liquid–liquid and solid–liquid extraction) by assistance of external 74
factors (e.g. mechanical agitation, pressing, or heating systems). 75
The “ideal” extraction method must provide high extraction rates and should be non-76
destructive and time saving (Rombaut et al., 2014). In addition, as per the environmental 77
requirements and economic impact, the food and nutraceutical industry prefer green 78
extraction and processing to ensure a safe and high quality extract/product (Chemat, Vian, & 79
Cravotto, 2012). Recently, more rapid and automated methods including supercritical fluid 80
extraction (SFE), pressurized liquid extraction (PLE) or microwave-assisted extraction 81
(MAE), ultrasound extraction (UAE) and accelerated solvent extractor (ASE) have been used 82
(Krishnaswamy, Orsat, Gariépy, & Thangavel, 2013; Périno-Issartier, Zill-e, Abert-Vian, & 83
Chemat, 2011). The above extraction methods are advantageous compared to conventional 84
methods because they can be carried out in the absence of light and oxygen, cope with the 85
demand for a reduction in organic solvent consumption and improve the extraction time due 86
to the possibility of working at elevated temperatures or pressures in inert atmospheres. A 87
thorough literature search did not yield any reference or reports on the optimization of 88
microwave procedure for extraction of phenolic compounds from C. Sinensis peels. Response 89
surface methodology (RSM) is a useful tool to evaluate the effects of multiple factors and 90
their interactions on one or more response variables such as phenolic compounds. The central 91
composite design (CCD) is a popular form of RSM and has been applied by a number of 92
researchers for optimization of various food processing methods such as extrusion cooking 93
(Nayak, Berrios, Powers, & Tang, 2011) and extraction (Huang, Ou, Hampsch-Woodill, 94
Flanagan, & Prior, 2002). In this project, we investigated (i) the effects of different extraction 95
parameters on the efficiency and recovery of phenolic compounds from C. Sinensis peels; (ii) 96
RSM technique to optimize microwave-assisted extraction parameters such as microwave 97
power, extraction time, solvent-to- solid ratio to maximize the total phenolic content ; (iii) 98
individual phenolic acids of microwave-assisted (MAE), ultrasound-assisted (UAE), 99
accelerated-solvent (ASE) and conventional solvent (CSE) extracted samples. Finally, the 100
total phenolic contents and antioxidant activities (using DPPH radical scavenging assay and 101
ORAC-values) of citrus peels in optimized MAE conditions were compared with UAE, ASE 102
and CSE to understand the most efficient extraction method. 103
2. Materials and methods 104
2.1Plant material
105
The fruit samples of C. Sinensis were collected in the area of Oued Ghir (Bejaia, Algeria). 106
Samples were washed with distilled water and peeled off manually. Peels were dried in a 107
forced-oven at 40 °C to constant weight, and then grounded using an electrical grinder (IKA 108
model- A11, Staufen, Baden-Württemberg, Germany). The ground powder was passed 109
through a standard 125 µm sieve and only the fraction with particle size < 125 µm was 110
collected and stored at 4 °C in airtight bags until further use. The water activity (aw) of the 111
sample was measured with a HygroPalm AW1 portable water activity meter, (Rotronic, 112
Bassersdorf, Switzerland) and found to be 0.18 ± 0.02 at 20.6 °C. 113
2.2Reagents
114
Sodium carbonate (Na2CO3), Folin-Ciocalteu’s phenol reagent and hydrochloric acid 115
(HCl) were purchased from Prolabo (Loire, France). Fluorescein (FL) and Trolox (6-116
hydroxy-2,5,7,8-tetramethylchroman-2-carboxylic acid), DPPH (1, 1-diphenyl-2-117
picrylhydrazyl) were purchased from Sigma–Aldrich Co. (St. Louis, MO). HPLC standards 118
such as gallic acid, ferulic acid, caffeic acid, p-coumaric acid, chlorogenic acid, rutin, 119
quercetin, catechin and epigallocatechin were purchased from Fisher scientific (Fair Lawn, 120
NJ, USA). 2-2′-azobis (2-amino-propane) dihydrochloride (AAPH) was purchased from 121
Wako chemicals (Richmond, VA, USA). All the solvents used for extraction and HPLC 122
analysis were HPLC grade. 123
2.3Extraction and quantification of total phenolic content (TPC)
124
2.3.1 Microwave assisted extraction (MAE).
125
A domestic microwave oven (Samsung model: NN-S674MF, Kuala Lumpur, Malaysia) with 126
cavity dimensions of 22.5 × 37.5 × 38.6 cm and a working frequency of 2.45 GHz was used 127
for extraction of phenolic compounds from C. Sinensis peel powders. The apparatus was 128
equipped with a digital control system for measuring extraction time and microwave power 129
(the latter was linearly adjustable from 200 to 1000 W). The oven was modified in order to 130
condense the vapors generated during extraction of the sample. Aqueous acetone in different 131
concentrations was used as a safe and efficient solvent for the extraction of phenolic 132
compounds (Li, Deng, Wu, Liu, Loewen, & Tsao, 2012). The use of acetone allows an 133
efficient and more reproducible extraction, avoids problems with pectins such as its clotting 134
properties, and permits a much lower temperature for sample concentration Garcia-Viguera, 135
Zafrilla, and Tomas-Barberan (1998). 136
One gram of C. Sinensis peel powder was mixed with aqueous acetone by stirring in 137
preparation for extraction using the MAE system. The MAE extraction parameters were 138
microwave power (300-600 W), extraction time (90–240 s), solvent-to-solid ratio (15-30 mL 139
g−1) and acetone in water concentration (20-80 %, v/v), where the influence of each
140
parameter was investigated in single-factor experiments (Supplement Table S1). Each trial 141
was carried out in triplicate. The temperature of the samples were never exceeded 80 °C 142
during 122 s of extraction at 500 W (optimal conditions). After MAE treatment, the extract 143
was filtered through a Whatman No. 1 filter paper lined in a Büchner funnel and the 144
supernatant was collected in a volumetric flask. The extract was stored at 4 °C until further 145
use. Influence of each factor on the yield of total phenolic content was statistically assessed 146
by ANOVA and Tukey’s post-hoc test. 147
2.3.1.1Experimental Design and Statistical Analyses.
148
The influence of the process parameters i.e. type of solvent, microwave power, 149
extraction time and solvent-to-solid ratio were investigated using a single-factor-test to 150
determinate the preliminary range of extraction variables (Supplement Table S1). Based on 151
the single-factor experimental results, major factors influencing the extraction process were 152
selected for designing experiments using response surface methodology (RSM). Minitab 153
statistical software (Minitab, version 8.0.7.1, State college, PA, USA) package was used to 154
establish a mathematical model and obtain the optimum conditions for maximum recovery of 155
TPC. In the present study, a three-level four-factorial Box–Behnken experimental design 156
(BBD) was applied to investigate and validate extraction process parameters affecting the rate 157
of phenolic compounds from C. sinensis peels. The number of experiments (N) required for 158
the development of BBD is defined in Eq.(1) (Dahmoune, Boulekbache, Moussi, Aoun, 159
Spigno, & Madani, 2013). 160
0
2 ( 1)
N = k k− +C (1)
161
where k is number of factors and C0 is the number of center points. The factor levels were
162
coded as −1 (low), 0 (center point or middle) and 1 (high), respectively. The four factors 163
chosen for this study designated as X1: aqueous acetone (40-60%), X2: extraction time
(90-164
150 s), X3: microwave power (400-600 w) and X4: solvent-to-solid ratio (20-30 mL g−1)
165
(Table 1). The variables were coded according to equation Eq.(2) (Dahmoune, Nayak, 166
Moussi, Remini, & Madani, 2015). 167 0 ( i ) i X X x X − = ∆ (2) 168
Where xi the (dimensionless) coded value of the variable is Xi and X0 is the value of X at the
169
center point and ∆X is the step change. 170
The experiments were performed according to the design of experiments shown in 171
Table 1. The output results (TPC yield) were fitted to a second-order polynomial equation 172
(quadratic model), according to the model in Eq.(3). 173 2 1 1 0 k k k i i ii ij i j i i i j Y B B X B X B X X E = = > = +
∑
+∑
+∑
+ (3) 174where Y represents the response function (in our case the TPC yield); B0 is a constant
175
coefficient; Bi, Bii and Bij are the coefficients of the linear, quadratic and interactive terms,
176
respectively, and Xi and Xj represent the actual independent variables. The regression
177
coefficients of individual linear, quadratic and interaction terms were determined using 178
analysis of variance. In order to visualize the relationship between the response and 179
experimental levels of each factor and to deduce the optimum conditions, the regression 180
coefficients were used to generate 3-D surface plots from the fitted polynomial equation. 181
Analysis of variance (ANOVA) was performed for response variable using the full 182
models where p-values (partitioned into linear and interaction factors) indicated whether the 183
terms were significant or not. To verify the adequacy of the models, additional extraction 184
trials were carried out at the predicted optimal conditions and the experimental data were 185
compared to the values predicted by the regression model. Microwave extraction method was 186
compared with UAE, ASE and CSE based on the TPC, antioxidant activity (DPPH assay and 187
ORAC-values) and HPLC results. 188
2.3.2 Ultrasound assisted extraction (UAE)
189
An ultrasonic system with working frequency fixed at 20 kHz (SONICS Vibra cell, 190
VCX 130 PB, stepped microtips and probes, No. 630-0422, Newtown, Connecticut, USA) 191
was used for extraction of phenolic compounds from the citrus peel under optimal conditions 192
(Dahmoune, Moussi, Remini, Belbahi, Aoun, Spigno, et al., 2014). Briefly, 1 g of peel 193
powder was mixed with 50 mL of 75.79 % acetone concentration in a 250 mL amber glass 194
bottle (Ø × H: 45 × 140 mm and cap size of 28 mm) the obtained suspension was exposed to 195
acoustic waves for 8.33 min extraction time, and 65.94% extraction amplitude. The 196
temperature (27 ± 2 °C) was controlled continuously by circulating cold water using an 197
external cold-water bath and checking the temperature using a T-type thermocouple 198
(Cooking, Thermo-Timer, China). After the UAE treatment, the supernatant was recovered 199
and analyzed as reported in Section 2.3.1 for the optimized MAE extract. 200
2.3.3 Accelerated solvent extraction (ASE)
201
An accelerated solvent extractor (ASE, Dionex Corp., Sunnyvale, CA) system was 202
used for extraction of phenolic compounds from C. Sinensis following our in-house 203
procedure. Briefly, one gram of peel powder was placed in two layers of diatomaceous earth 204
(about 0.5 g in each layer) in 11 mL Dionex (ASE 200) stainless-steel cell, and phenolic 205
compounds were extracted with 50% acetone. The cells were equipped with a stainless steel 206
frit and a cellulose filter (Dionex Corp.) at the bottom to avoid the collection of suspended 207
particles in the collection vial. A dispersing agent (diatomaceous earth), was used to reduce 208
the solvent volume. The extraction was performed at 1500 psi and temperature of 120 °C, and 209
then heated for 6 min, followed by three static periods of 5 min (3 static cycles). The sample 210
was flushed with 70% nitrogen for 90 s. Extracts were collected into 50 mL tubes. 211
2.3.4 Conventional solvent extraction (CSE)
212
Phenolic compounds in citrus peels were extracted using a conventional solvent 213
extraction method following the procedures recommended by (Giorgia Spigno, Tramelli, and 214
De Faveri, 2007). Briefly, one gram of powder was mixed with 50 mL of 50% aqueous 215
acetone (v/v) in a conical flask (Ø × H: 51 × 150 mm and cap size of 38 mm); the mixture 216
was kept in a thermostatic water bath (model: WNB22, Memmert, Frankfurt, Germany) at 60 217
°C for 2 hours shaking at a speed of 110 strokes per minute. After the CSE treatment, the 218
supernatant was recovered and analyzed as reported in Section 2.3.1 for the optimized MAE 219
extract. 220
2.4Determination of total phenolic content (TPC)
221
The total phenolic content in the Citrus sinensis powder extracts was determined by 222
the Folin–Ciocalteau method (Jaramillo-Flores, González-Cruz, Cornejo-Mazón, Dorantes-223
Alvarez, Gutiérrez-López, & Hernández-Sánchez, 2003). Briefly, twenty micro- Liter of 224
supernatant was mixed with 150 µL of a 10-fold diluted Folin–Ciocalteau reagent. The 225
solutions were mixed thoroughly and incubated at room temperature (27 °C) for 5 min. After 226
incubation, 150 µL of 6 % sodium carbonate (Na2CO3) solution was added and again 227
incubated at 25 °C for 90 min. The absorbance of the reaction mixtures were measured at 725 228
nm using a Omega FLUOstar plate reader (Model : SpectroScan 50, Nicosia, Cyprus). The 229
absorbance of the extract was compared with a gallic acid standard curve for estimating 230
concentration of TPC in the sample. The TPC was expressed as mg of gallic acid equivalents 231
(GAE) per gram of powder on dry weight (DW) basis. 232
2.5Determination of antioxidant activity
233
2.5.1 DPPH radical scavenging assay
234
The electron donation ability of the obtained acetone extracts was measured by 235
bleaching of the purple-colored solution of 1,1-diphenyl-2-picrylhydrazyl radical (DPPH) 236
following the procedures of Brand-Williams, Cuvelier, and Berset (1995) with modifications. 237
Briefly, 300 µL of DPPH• solution prepared in methanol (70 µM) was mixed with 10 µL of 238
peel extracts and the mixture was incubated at 37 °C. The tests were performed on a micro-239
plate reader (Omega FLUOstar, BMG Labtech, Cary, NC, USA). Absorbance readings of the 240
mixture were taken at 515 nm over a period of 20 min. 241
The antioxidant activity was expressed as percentage of inhibition of DPPH radical 242
calculated according to Eq.(4). 243 20 min 20 min 0 min % blank t sample t 100 DPPH t A A inhibition A = = = − = × (4) 244
where Ablank is the absorbance value of the blank (300 µL of DPPH solution plus 10 µL of the
245
solvent in which extract has been dissolved); Asample is the absorbance of the sample extract; t
246
is the time (min) at which absorbance was read and ADPPH is the absorbance of the control at
247
time = 0 min. The effective concentration of sample required to scavenge DPPH radical by 248
50% (IC50 value) was obtained by linear regression analysis of dose-response curve plotting
249
between % inhibition and concentrations. 250
2.5.2 Oxygen radical absorbance capacity (ORAC) assay
251
The antioxidant activity of peel extracts were also assessed using an ORAC assay 252
following the procedures of Huang, Ou, Hampsch-Woodill, Flanagan, and Prior (2002) with 253
modifications. Briefly, a stock fluorescein solution (Stock #1) was prepared by dissolving 254
0.0225 g of fluorescein in 50 mL of 0.075 M phosphate buffer (pH 7.0). A second stock 255
solution was prepared by diluting 50 µL of stock solution #1 in 10 mL of phosphate buffer. 256
An aliquot of 800 µL of solution #2 was added to 50 mL of phosphate buffer, mixed on 257
magnetic stir plate and aliquots were dispensed to 10 mL tubes and placed in 37 °C heating 258
block until the start of the assay. AAPH was used as a peroxyl generator and trolox as a 259
standard. Twenty microliters of sample, blank, and trolox calibration solutions were 260
transferred to 96-well microplates in triplicate on the basis of a set layout. The ORAC assays 261
were carried out on Omega FLUOstar plate reader which was equipped with an incubator and 262
two injection pumps. The temperature of the incubator was set to 37 °C. The plate reader was 263
programmed to record the fluorescence of fluorescein during each cycle for 40 min. Four 264
calibration solutions of trolox (6.5, 12, 25, 50 µM final concentration) was also tested to 265
establish a standard curve. All samples were analyzed in triplicate. 266
The area under the curve (AUC) was calculated for each sample by integrating the 267
relative fluorescence curve (Eq.(5)). 268 5 6 4 3 3 3 3 0.5 f f f fi AUC CT f f f f = + + + +⋅⋅⋅+ × (5) 269
where f initial fluorescence reading at cycle 3, 3 f is a fluorescence reading at cycle i, and i
270
CT is cycle time in minutes. The net AUC of the sample was calculated by subtracting the
271
AUC of the blank. The regression equation between net AUC and Trolox concentrations was
272
determined and ORAC values were expressed as µmol trolox equivalents per gram of sample 273
(µmol TE g−1) using the standard curve established in same condition.
274
2.6HPLC-DAD analysis
275
Treated sample and control extracts were fractionated for phenolic acids in four 276
fractions using a SePak C-18 cartridge (Waters, Milford, MA, USA). The columns were 277
activated for neutral phenolics by sequentially passing 50 mL of ethyl acetate, acidified 278
methanol (0.01% v/v HCl) and acidified water (0.01% v/v HCl). Fraction 1 was obtained by 279
eluting 20 ml of crude extract in the column prior to washing the column with 60 ml of 280
acidified distilled water to remove any organic sugars and acids (fraction 2). The retained 281
fraction of phenolic acids was eluted with 60 ml of ethyl acetate (fraction 3). Anthocyanins 282
plus proanthocyanidins (fraction 4) were eluted with 60 ml of acidified methanol. Finally, 283
after evaporation, all fractions (1, 2, 3 and 4) were re-suspended in methanol (HPLC grade) 284
and stored at 4 °C for further analysis. 285
Identification of selected individual phenolic acids was performed using a High-286
Performance Liquid Chromatography (Agilent Technologies, Santa Clara, USA) equipped 287
with a Diode array detector and a column C-18 (5 µm, 4.60 × 250 mm, USA). All samples 288
were centrifuged at 5000 rpm for 10 min before injection into the column with an injection 289
volume of 20 µL and at a flow rate of 0.5 mL min−1. Chromatographic analysis was carried
290
out at 30 °C using simultaneous monitoring of extracts performed at 254, 280, 520, 300 and 291
700 nm. The mobile phase A was a mixture of 6:94 (v/v) acetic acid in distilled water, 292
whereas mobile phase B consisted of 100% HPLC grade acetonitrile. The solvent gradient in 293
volume ratios was as follows: 0–40 min, 0–25% B; 40–80 min, 25–85% B; 80–90 min, 85– 294
100% B; 90-95 min, 100% B. 295
Individual phenolic compounds were identified based on their elution time and 296
quantified from peak area at 280 nm. Identified phenolic compounds (phenolic acid and 297
flavonoids) were quantified using external standards. The standard response curve was a 298
linear regression fitted to values obtained at each concentration within the range of 12.5–200 299
µg mL−1 for phenolic acid (Gallic acid, Ferulic acid, Caffeic acid, p-Coumaric acid and
300
Chlorogenic acid) and 41.5-333 µg mL−1 for flavonoids (Rutin, Quercetin, Catechin and
301
Epigallocatechin). 302
3 Results and discussion
303
3.1Effects of extraction on the visual color of extracts
304
Extraction is an important step for the recovery and isolation of bioactive 305
phytochemicals from plant materials before analysis. Liquid-liquid and solid-liquid extraction 306
are the most commonly used procedures prior to analysis of phenolic compounds in natural 307
matrix. They are still the most widely used techniques, mainly because of their efficiency, 308
wide-ranging applicability and ease of use to extract of natural antioxidants. In our study, 309
from the color and turbidity of the acetone-water extracts in relation to the extraction methods 310
i.e. CSE, UAE, MAE and ASE, it was observed that the visual color was influenced by the 311
extraction methods. Most importantly, color of the MAE and ASE extracts turned pale 312
brown, differing from the usual pale green after extraction. In MAE, heat is generated by the 313
volumetric heating of samples with the help of electromagnetic waves; in ASE, high 314
temperature extraction of the samples potentially attributed to the degradation of color 315
compounds. A similar trend in the degradation of color compounds was observed in our 316
previous studies on the extraction of phenolic compounds from C. limon, P. lentiscus and M. 317
communis using MAE, ASE, UAE and CSE (Dahmoune, Boulekbache, Moussi, Aoun,
318
Spigno, & Madani, 2013; Dahmoune, et al., 2014). 319
3.2Modeling of MAE
320
3.2.1 Single factor experiments
321
Selection of extraction solvents is critical for the complex plant materials as it will 322
determine the amount and type of phenolic compounds being extracted. Aqueous solvents 323
particularly acetone, ethanol and methanol are more commonly used in phenolic extraction 324
from botanical materials than the corresponding mono-component solvent system (Spigno, 325
Tramelli, & De Faveri, 2007). In the present study with preliminary single factor 326
experiments, we observed that the type of solvent significantly influenced the TPC yield 327
during MAE, with 50% aqueous acetone (11.49 ± 0.44 mg GAE g−1) providing higher
328
recovery than water (7.63 ± 1.22 mg GAE g−1), 50% aqueous ethanol (6.29 ± 0.77 mg GAE
329
g−1) and 50% aqueous methanol (9.68 ± 0.99 mg GAE g−1) (supplement Table S2). Higher
330
recovery of TPC by aqueous acetone could be attributed to better absorption of microwave 331
energy by the extract during MAE due to volumetric heating. This process increases 332
temperature inside the plant cells, resulting in breaking the cell walls and releasing 333
compounds in to the surrounding solvent. Aqueous acetone was then selected for the RSM 334
trials and for subsequent single-factor trials. 335
The effect of various percentages of acetone in water (20–80%) as an extraction 336
solvent to recover phenolic compounds was investigated. TPC yield increased with increasing 337
aqueous acetone concentration up to 50% and then decreased slightly at higher concentrations 338
(supplement Table S2). Thus, the acquired ratio of TPC increased with decreasing water 339
content following the principles of “like dissolves like” (Zhang, Bi, & Liu, 2007). In the 340
second step, the proportion of acetone in the extraction solvent was varied between 40 and 341
60% for the optimization design. The solvent with 50% acetone content was then chosen for 342
the determination of optimal microwave power, extraction time and solvent-solid ratio. 343
Selection of an appropriate microwave power for extraction was the third step in a 344
series of preliminary experiments. Phenolic compounds were extracted from C. sinensis peel 345
samples by varying the microwave power using 50% aqueous acetone for 120 s while 346
keeping the solvent-to-solid ratio constant at 20 mL g−1. The results showed that the TPC
347
increased when microwave power increased from 400 to 500 W. Beyond 500 W, TPC 348
decreased sharply and reached a minimum at 800 W (Supplement Table S2), possibly due to 349
the degradation of compounds with the higher microwave power during extraction (Proestos 350
& Komaitis, 2008). Based on the preliminary tests, the best microwave power for the 351
extraction was selected as 500 W. The lower, middle and upper levels of extraction power 352
chosen for RSM were 400, 500 and 600 W, respectively. 353
Extraction time is another parameter that influences the yield of TPC and should be 354
considered for the optimization procedure. Generally, by increasing the extraction time, the 355
quantity of analytes extracted is increased, although there is a risk that degradation of 356
phenolic compounds may occur (Proestos, Boziaris, Nychas, & Komaitis, 2006). The 357
acquired ratio of TPC extraction gradually increased with increasing extraction time and the 358
maximum TPC was obtained between 30-120 s (Supplement Table S2). A significant increase 359
in extraction efficiency was observed as the extraction time increased from 90 to 120 s 360
followed by a significant decrease after 125 s (Supplement Table S2). Longer irradiation 361
exposition without temperature control could have induced thermal degradation of phenolic 362
compounds (Yang, Jiang, Li, Chen, Wang, & Zhu, 2009). Since shorter extraction time is 363
also favorable to reduce energy costs, the 90 - 150 s range was selected for the optimization. 364
The to-solid ratio can influence the TPC yield. In the present study, solvent-365
to-solid ratio was set at 15:1, 20:1, 25:1 and 30:1 (mL g−1) respectively. It was observed that
366
the extraction yield increased quickly with the increase of solvent-solid ratio from 15:1 – 25:1 367
mL g−1 (Supplement Table S2). Then, extraction yield rapidly decreased with increase in
368
solvent /material ratio from 25:1 – 30:1 mL g−1.The solvent-to-solid ratio significantly
369
influenced the TPC yield, showing similar trend on the extraction of tea polyphenols using 370
microwave as reported by Spigno and De Faveri (2009). However, the decrease in the 371
extraction yield beyond a solvent-to-solid ratio could be due to the non-uniform distribution 372
and exposure to microwave heating (Eskilsson & Björklund, 2000). Furthermore, the 373
optimized solvent volume should be sufficient to ensure that the entire sample is immersed, 374
especially when a sample will swell during the extraction process (Dahmoune, Boulekbache, 375
Moussi, Aoun, Spigno, & Madani, 2013; Eskilsson & Björklund, 2000). Based on statistical 376
analysis, the range 20–30 mL g−1 was selected for the RSM optimization.
377
3.2.2 Optimization of MAE technique
378
In this study, we evaluated the effects of microwave power, extraction time and 379
solvent-to-solid ratio with the Box-Behnken experimental design. Aqueous acetone was used 380
for all the extraction methods. The data on the yield of TPC obtained from 27-runs of 381
experiments using MAE was analyzed using ANOVA and are shown in Table 1. A quadratic 382
model was fitted to the generated data to test the significance and adequacy of the model. 383
From the significant levels obtained at p < 0.001, it was observed that the data adequately fit 384
the developed model (Table 2). In addition, the coefficient of determination (R2=0.92) and 385
adjusted determination coefficient (Adj. R2 = 0.89) were reasonably close to 1, indicating a 386
high degree of correlation between the observed and predicted values. Additionally, a low 387
value of coefficient of the variation (CV = 3.96%) indicated a high degree of precision and a 388
good deal of reliability of the experimental values. 389
From the regression equation, it can be observed that the independent variables have a 390
linear effect on the yield of TPC (Y) within the experiment range in MAE. The TPC 391
extraction yield was affected more significantly by acetone concentration at p < 0.001 (p = 392
0.0001), followed by extraction time at p < 0.05 (p =0.0492), while TPC recovery was not 393
affected (p > 0.05) by other factors, i.e. extraction power (p = 0.4163) and solvent-solid ratio 394
(p = 0.1257). The quadratic terms X12 , X22, X32 and X42 were highly significant at the level 395
p < 0.001 (Table 2).
396
The interaction (cross product) of extraction time and solvent-solid ratio (X2X4) was
397
statistically significant at p < 0.001 followed by (X1X4) at p < 0.05 (Table 2). Neglecting the
398
non-significant terms (p < 0.05), the final predicted second-order polynomial equation 399
obtained is given in Eq.(6) 400
2 2 2 1 1 4 2 4 1 3 4 12.1567 0.4967 0.4225 0.8675 1.7291 1.2404 0.9091 Y= + X − X X − X X − X − X − X (6) 401
The effects of the independent variables and the mutual interaction on the extraction yield of 402
TPC can also be seen on three dimensional response surface curves shown in Figure 1A–F. 403
Each 3D plot represents the number of combinations of the two-test variable. Figure 1A 404
shows a higher interaction between the solvent-solid ratio and extraction time (p < 0.001); the 405
TPC increased roughly from 8.72 to 10.82 mg GAE g−1 DW when the ratio was fixed at 20
406
mL g−1 and time varies for 90 to 133 s. The decline in TPC was observed after 122 s at a
407
solvent-solid ratio of 25 mL g−1. The TPC yield reach a minimum of 9.25 mg GAE g−1 DW
408
at 150 s and at extraction ratio 30 mL g−1.
409
Response surface for TPC yield with varying ratio of solvent to solid samples and 410
aqueous acetone concentration are shown in Figure 1B. Simultaneous increase in the ratio of 411
solvent to solid from 20 to 25 mL g−1 and aqueous acetone concentration from 40 to 50%,
412
increased the TPC yields from about 9 to 12.19 mg GAE g−1 DW. It was also observed that
413
the extraction yields decreased along with the increase in the ratio of solvent to solid from 25 414
to 30 mL g−1 and aqueous acetone concentration of 50 to 60%. The results suggested that the
415
interaction between the ratio of solvent-to-solid and aqueous acetone concentration on the 416
extraction efficiency of TPC was highly significant (p < 0.01). Figure 1C shows the effects of 417
aqueous acetone concentration and microwave power on the TPC of the C. sinensis peels. By 418
increasing the microwave power from 436 to 496 W with aqueous acetone concentration 419
fixed at 41% (acetone/water, v/v), the TPC increases from 9.45 to 10.04 mg GAE g−1 DW.
420
However, the TPC increases from 9.45 to 12.19 mg GAE g−1 DW if the aqueous acetone
421
concentration and microwave power were increased simultaneously until 50% and 500 W 422
respectively. The reduction in the TPC up to a value of 9.72 mg GAE g−1 DW was noticed
423
when one exceeds the optimal conditions (beyond 500 W and 50% acetone in water). This 424
was due to the increase in the direct effect of microwave energy on the medium of extraction 425
by the dipolar rotation that resulted in a rise in temperature of the medium and caused the 426
degradation of the bioactives substances (Hayat, et al., 2010). 427
The recovery of TPC was affected with response to the interaction between 428
microwave power and solvent-to-solid ratio, when other factors (extraction time and aqueous 429
acetone proportion) were fixed at 120 s and 50% respectively (Figure 1D). The results 430
indicated that TPC yield increased with the increase in microwave power and solvent-solid 431
ratio at the beginning of extraction. The recovery reached its maximum of 12.10±0.15 mg 432
GAE g−1 DW at 500 W and a solvent-solid ratio of 25 mL g−1 during the MAE process.
433
Increasing the microwave power further to more than 500 W, the extraction recovery of TPC 434
decreased with a solvent-solid ratio of 25 mL g−1. These results are in agreement with those
435
found by Shao, He, Sun, and Zhao (2012), who observed that a strong microwave power 436
leads to an increase in the temperature, which negatively affects the thermo-labile 437
compounds. Figure 1E shows the profiles obtained on the effects of the aqueous acetone 438
concentration and extraction time on the yield of TPC. An increase in the TPC yield was 439
observed with the increase in aqueous acetone concentration and extraction time, but the 440
tendency was reversed when the interaction between solvent-solid ratio and extraction time 441
reached a certain value. A few seconds of peel exposure to microwave showed an excellent 442
yield in TPC, but longer duration enhanced the degradation of the thermo-labile compounds. 443
Figure 1F shows that increase in extraction time and microwave power increased the TPC up 444
to a maximum of 12 mg GAE g−1 DW. However, a prolonged extraction time with the
445
microwave power gave reduced TPC yield, which was also noticed during our preliminary 446
study. 447
Under the optimal conditions of microwave power, extraction time, aqueous acetone 448
concentration and solvent-solid ratio, the model predicted a maximum response of 12.20 mg 449
GAE g−1 DW. To compare the predicted results with the experimental values, rechecking
was performed using this deduced optimal condition. It led to an experimental yield of TPC 451
equal to 12.09 ± 0.06 mg GAE g−1 DW, which is close to the predicted value (12.20 mg GAE
452
g−1 DW). The best correlation between these results confirmed that the response model was
453
adequate, and valid enough to reflect the expected optimization results (Supplement Table 454
S3).
455
3.3Comparison of extraction methods on recovery of TPC
456
To evaluate the efficiency of extraction and validate the MAE procedure for 457
polyphenol-rich extract, C. sinensis peels were extracted and compared with CSE, UAE and 458
ASE. Recovery of the TPC in extracts were compared using the above selected extraction 459
methods (Table 3). The results of the MAE experiments indicated that microwave assistance 460
enhanced the efficiency of yield of TPC significantly (p < 0.01) compared to UAE, CSE and 461
ASE. Higher yield of TPC in MAE could be attributed to the microwaves ability to penetrate 462
cell matrix and interact with polar molecules resulting in volumetric heating of biomaterial, 463
consequently leading to a pressure increase inside the plant cell. This pressure increase leads 464
to breaking of cell walls and release of phenolic analytes. Besides, breakdown of bigger 465
phenolic compounds into smaller ones with their intact properties of the original molecules, 466
as measured by Folin-Ciocalteau assay, could have provided the higher yield TPC (Nayak, 467
Liu & Tang, 2015). However, this observation was in contrary to Pingret (2012, 2013), who 468
reported degradation of bioactive compounds by microwave and ultrasound waves. The lower 469
TPC in the ASE treatments using aqueous acetone at 120 °C may be due to the breakdown of 470
phenolic compounds that were not detected using Folin-Ciocalteau assay. In addition, 471
combined effects of oxidation during the extraction process and of non-phenolic compounds 472
such as sugar, fatty acids interaction with the phenolic compounds might have lowered the 473
TPC in ASE extracts and the recovery might have underestimated since the extract showed 474
the dark color. 475
3.4Effects of extraction methods on the antioxidant activity
476
The antioxidant activities of C. Sinensis extracts were evaluated by DPPH radical 477
scavenging assay and ORAC test. The reduction of the DPPH absorbance at 517 nm after 20 478
min incubation was measured with different concentrations of the extract (Figure 2). Extracts 479
from MAE showed lower IC50 (337.16 ± 8.45 ml extract L−1) compared to other extraction
480
methods (p < 0.05), indicating that significantly higher antioxidant activities of MAE with 481
higher scavenging of DPPH radicals compared to UAE (IC50: 437.45 ± 1.30 ml extract L−1),
482
CSE (IC50: 357.36 ± 6.02 ml extract L−1) and ASE (IC50: 450.44 ± 4.48 ml extract L−1)
483
methods (Table 3). The higher activity of MAE extract could be explained by microwave 484
treatment that affects the structure of the cell due to the sudden increase in temperature and 485
internal pressure; which can be observed clearly under scanning electron microscope 486
(Dahmoune, Boulekbache, Moussi, Aoun, Spigno, & Madani, 2013; Dahmoune, Nayak, 487
Moussi, Remini, & Madani, 2015). The principle of volumetric heating using microwave 488
energy is based on the direct effect of microwaves on molecules by ionic conduction and 489
dipole rotation. This results in rapid rise of the temperature and fast completion of a reaction. 490
Although ultrasound can break the cell wall with its cavitation power, releasing phenolic 491
compounds into the extraction solvent, the quantity of release depends on the intensity and 492
duration of application. In our study, the ultrasound parameters selected for treatment and 493
extraction duration produced lower recovery of total phenolics and hence less antioxidant 494
activity. 495
Using the ORAC assay, it was observed that antioxidant activities of extracts were 496
statistically similar for MAE, UAE and CSE, but higher (p < 0.05) compared to the ASE 497
(Table 3). The antioxidant activity of peel extracts using ASE was 337.97 ± 23.15 µmol TE 498
g−1. It was observed that ASE-extracts had the lowest fluorescence intensity during the test
499
compared to other extraction methods. As noticed, the fluorescence signal declined 500
dramatically in the presence of a peroxyl generator (AAPH) beyond 15 min whereas in MAE, 501
UAE and CSE-extracts the tendency was prolonged until 30 min. This mechanism in ASE 502
extracts could explain the lowest antioxidant activity in the sample extracts (Figure S1). 503
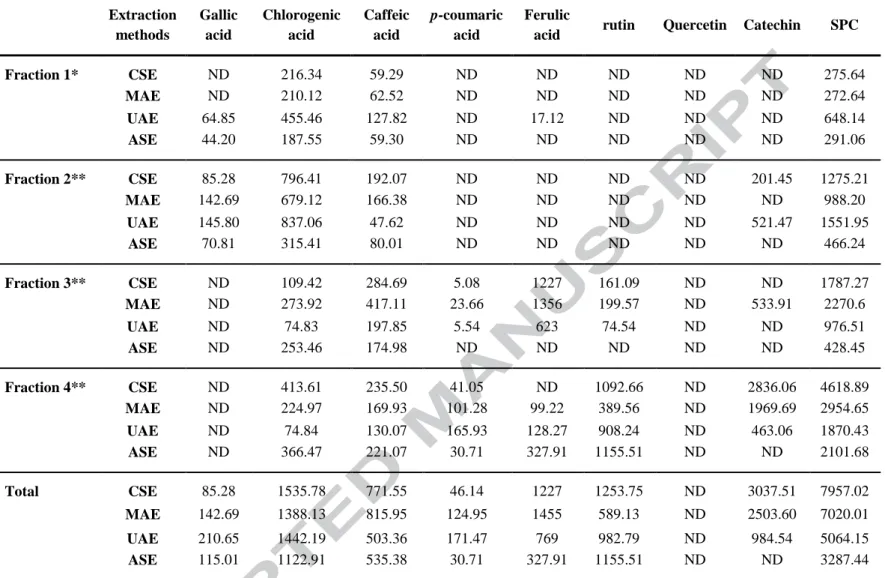
3.5HPLC-DAD analysis
504
The identification and quantification of individual phenolic compounds of C. sinensis extracts 505
was based on a combination of retention times and calibration curve of external standards 506
using a reverse phase C18 column in HPLC. The peaks of the phenolic compounds were
507
detected at a wavelength of 280 nm. The elution times of gallic acid, chlrogenic acid, caffeic 508
acid, ferulic acid, p-coumaric acid were 8.7, 23.5, 27.1, 39.5 and 58.6 min, respectively. 509
Similarly, elution times of catechin, rutin and quercitin were 20.5, 38 and 54.5 min, 510
respectively (Dahmoune, Nayak, Moussi, Remini, & Madani, 2015). None of the extraction 511
methods provide a particular trend of quantity of phenolic compounds in the extract. While 512
the quantity of chlorogenic acid (1535 µg g−1 DW), catechin (3037 µg g−1 DW) and rutin
513
(1253 µg g−1 DW) were highest, gallic acid (85 µg g−1 DW) was lowest in CSE extracts
514
compared to other extraction methods (Table 4) (Hayat, et al., 2010). Quercitin was not 515
detected in any of the extracts. UAE provided higher recovery of gallic acid (210 µg g−1 DW)
516
and p-coumaric acid (171 µg g−1 DW) than other methods (Table 4). Recovery of caffeic acid
517
(815 µg g−1 DW) and ferulic acid (1455 µg g −1DW) was highest in MAE extracts (Figure 3)
518
compared to UAE, CSE and ASE (figures S2, S3 and S4 in supplemental). From the recovery 519
of individual phenolic compounds using HPLC, it can be reported that CSE, MAE, UAE and 520
ASE favor particular types of phenolic compounds. For example, MAE and ASE may have 521
produced a harsh extraction condition for gallic acid; ultrasound could have a conducive 522
environment whereas type or longer duration of extraction in CSE could have reduced the 523
recovery of gallic acid. Overall, CSE followed by MAE provided the highest quantity of the 524
total of the selected individual phenolic compounds. In addition, a number of other phenolic 525
acids were also detected in the extracts that were not identified. 526
The results of this study contributed to lighten ways of valorization of the Citrus 527
sinensis peels based on the “six principles of Green Extraction of Natural Products” as
528
outlined by Chemat, Vian, and Cravotto (2012). Some of the major findings from this 529
investigation support the idea of green extraction. For example, (i) reduction in the 530
processing time (122, 500, 900 and 7200s for MAE, UAE, ASE and CSE, respectively), (ii) 531
reduction in the extraction solvent consumption, (iii) higher extraction recovery of TPC (at 532
the lab-scale batch process, the yield of TPC was 356.75, 305.41, 184.72 and 301.27 Kg 533
ton−1 h−1 for MAE, UAE, ASE and CSE, respectively), (iv) in the case of MAE, microwaves 534
are selectively absorbed by the residual water present in Citrus Sinensis peels (about 68 % of 535
moisture), and (v) possible customer acceptance of the by-products (peels) made through this 536
MAE “cleaner, greener” extraction technology. 537
Industrialization of the proposed techniques can be possible by experimental 538
validation and scaling up of the lab parameters in terms of extraction time, yield, chemical 539
composition and quality of environmentally friendly bioactive compounds to a pilot scale. 540
Small scale-up of extraction techniques have been reported for MAE (Petigny et al., 2014), 541
UAE (Achat et al., 2012) and ASE techniques in the literature. There are few reports 542
available on the use of MAE (Zhang, Yang, & Wang, 2011, Filly et al., 2014), UAE (Virot et 543
al., 2010) and ASE (Rabhi et. al., 2015) in the large-scale industrial processing of plant 544
secondary metabolites. 545
4 Conclusion
546
While almost all of the agricultural and food industries are looking for products processed 547
from pulp or flesh of fruits and vegetables, few have put forth the effort to understand and 548
produce value-added products from downstream by-products. Extraction and standardization 549
of valuable bioactive phytochemicals are important to obtain most of their value by-products. 550
Innovative technology assisted extractions tremendously reduce the extraction time. They 551
have also been shown to use less extraction solvent for a particular bioactive phytochemical 552
when conditions are optimized. The use of mathematical models can be an option to replace 553
conventional extraction methods, providing optimal and predictable results when coupled 554
with MAE. In our study, it was observed that Citrus sinensis peels are rich in phytochemicals 555
with antioxidant activity. We established an improved and optimized procedure for extracting 556
polyphenols from C. sinensis peels using MAE method. It was found that MAE not only 557
provided higher recovery of TPC, but also quality phenolic compounds with rich antioxidant 558
activity. In comparison of MAE with CSE, UAE and ASE extracts, it was observed that the 559
mechanism of each extraction i.e. application of microwave or ultrasound or accelerated 560
solvent has its own effects on selected individual phenolic compounds. Further studies 561
concerning benefits of polyphenols from the C. sinensis peels are required before large scale 562
utilization is recommended. For the industrial application, this research could be a basis for 563
further pilot-scale trials of MAE as a green extraction technology for the recovery of high-564
added value compounds from biomass residues. 565
Acknowledgement 566
We acknowledge Dr. L. Brian Perkins for his support and contribution in conducting 567
our experiments in his laboratory using the accelerated solvent extractor and HPLC. The 568
authors also thank Katherine Davis-Dentici and Mike Dougherty for their technical support in 569
analyzing some of the phenolic compounds. 570
References
571
Achat, S., Tomao, V., Madani, K., Chibane, M., Elmaataoui, M., Dangles, O., & Chemat, F. 572
(2012). Direct enrichment of olive oil in oleuropein by ultrasound-assisted maceration 573
at laboratory and pilot plant scale. Ultrasonics sonochemistry, 19(4), 777-786. 574
Brand-Williams, W., Cuvelier, M. E., & Berset, C. (1995). Use of a free radical method to 575
evaluate antioxidant activity. LWT - Food Science and Technology, 28(1), 25-30. 576
Chemat, F., Vian, M. A., & Cravotto, G. (2012). Green extraction of natural products: 577
Concept and principles. International journal of molecular sciences, 13(7), 8615-578
8627. 579
Chumnanpaisont, N., Niamnuy, C., & Devahastin, S. (2014). Mathematical model for 580
continuous and intermittent microwave-assisted extraction of bioactive compound 581
from plant material: Extraction of β-carotene from carrot peels. Chemical Engineering 582
Science, 116(0), 442-451.
583
Dahmoune, F., Boulekbache, L., Moussi, K., Aoun, O., Spigno, G., & Madani, K. (2013). 584
Valorization of Citrus limon residues for the recovery of antioxidants: Evaluation and 585
optimization of microwave and ultrasound application to solvent extraction. Industrial 586
Crops and Products, 50(0), 77-87.
587
Dahmoune, F., Moussi, K., Remini, H., Belbahi, A., Aoun, O., Spigno, G., & Madani, K. 588
(2014). Optimization of ultrasound-assisted extraction of phenolic compounds from 589
citrus sinensis L. peels using response surface methodology. In Chemical 590
Engineering Transactions, vol. 37 (pp. 889-894).
591
Dahmoune, F., Nayak, B., Moussi, K., Remini, H., & Madani, K. (2015). Optimization of 592
microwave-assisted extraction of polyphenols from Myrtus communis L. leaves. Food 593
Chemistry, 166(0), 585-595.
Eskilsson, C. S., & Björklund, E. (2000). Analytical-scale microwave-assisted extraction. 595
Journal of Chromatography A, 902(1), 227-250.
596
Fernández-Agulló, A., Freire, M. S., Antorrena, G., Pereira, J. A., & González-Álvarez, J. 597
(2013). Effect of the Extraction Technique and Operational Conditions on the 598
Recovery of Bioactive Compounds from Chestnut (Castanea sativa) Bur and Shell. 599
Separation Science and Technology, 49(2), 267-277.
600
Filly, A., Fernandez, X., Minuti, M., Visinoni, F., Cravotto, G., & Chemat, F. (2014). 601
Solvent-free microwave extraction of essential oil from aromatic herbs: from 602
laboratory to pilot and industrial scale. Food Chemistry, 150, 193-198. 603
Food and Agriculture Organization Commodities and Trade Technical Paper 1 Medium-term 604
prospects for agricultural Commodities, Projections to the year 2010. , July 2, 2014. 605
Garcia-Viguera, C., Zafrilla, P., & Tomas-Barberan, F. A. (1998). The use of acetone as an 606
extraction solvent for anthocyanins from strawberry fruit. Phytochemical Analysis(9), 607
274-277. 608
Hayat, K., Hussain, S., Abbas, S., Farooq, U., Ding, B., Xia, S., Jia, C., Zhang, X., & Xia, W. 609
(2009). Optimized microwave-assisted extraction of phenolic acids from citrus 610
mandarin peels and evaluation of antioxidant activity in vitro. Separation and 611
Purification Technology, 70(1), 63-70.
612
Hayat, K., Zhang, X., Farooq, U., Abbas, S., Xia, S., Jia, C., Zhong, F., & Zhang, J. (2010). 613
Effect of microwave treatment on phenolic content and antioxidant activity of citrus 614
mandarin pomace. Food Chemistry, 123(2), 423-429. 615
Huang, D., Ou, B., Hampsch-Woodill, M., Flanagan, J. A., & Prior, R. L. (2002). High-616
Throughput Assay of Oxygen Radical Absorbance Capacity (ORAC) Using a 617
Multichannel Liquid Handling System Coupled with a Microplate Fluorescence 618
Reader in 96-Well Format. Journal of Agricultural and Food Chemistry, 50(16), 619
4437-4444. 620
Jaramillo-Flores, M. E., González-Cruz, L., Cornejo-Mazón, M., Dorantes-Alvarez, L., 621
Gutiérrez-López, G. F., & Hernández-Sánchez, H. (2003). Effect of Thermal 622
Treatment on the Antioxidant Activity and Content of Carotenoids and Phenolic 623
Compounds of Cactus Pear Cladodes (Opuntia ficus-indica). Food Science and 624
Technology International, 9(4), 271-278.
625
Krishnaswamy, K., Orsat, V., Gariépy, Y., & Thangavel, K. (2013). Optimization of 626
Microwave-Assisted Extraction of Phenolic Antioxidants from Grape Seeds (Vitis 627
vinifera). Food and Bioprocess Technology, 6(2), 441-455. 628
Legua, P., Forner, J. B., Hernández, F., & Forner-Giner, M. A. (2014). Total phenolics, 629
organic acids, sugars and antioxidant activity of mandarin (Citrus clementina Hort. ex 630
Tan.): Variation from rootstock. Scientia Horticulturae, 174(0), 60-64. 631
Li, H., Deng, Z., Wu, T., Liu, R., Loewen, S., & Tsao, R. (2012). Microwave-assisted 632
extraction of phenolics with maximal antioxidant activities in tomatoes. Food 633
Chemistry, 130(4), 928-936.
634
Liu, R. H. (2004). Potential synergy of phytochemicals in cancer prevention: mechanism of 635
action. The Journal of nutrition, 134(12), 3479S-3485S. 636
Mason, T. J., Chemat, F., & Vinatoru, M. (2011). The extraction of natural products using 637
ultrasound or microwaves. Current Organic Chemistry, 15(2), 237-247. 638
Nayak, B., Liu, R. H., & Tang, J. (2015). Effect of Processing on Phenolic Antioxidants of 639
Fruits, Vegetables, and Grains—A Review. Critical reviews in food science and 640
nutrition, 55(7), 887-918.
641
Nayak, B., Berrios, J. D. J., Powers, J. R., & Tang, J. (2011). Effect of Extrusion on the 642
Antioxidant Capacity and Color Attributes of Expanded Extrudates Prepared from 643
Purple Potato and Yellow Pea Flour Mixes. Journal of Food Science, 76(6), C874-644
C883. 645
Périno-Issartier, S., Zill-e, H., Abert-Vian, M., & Chemat, F. (2011). Solvent Free 646
Microwave-Assisted Extraction of Antioxidants from Sea Buckthorn (Hippophae 647
rhamnoides) Food By-Products. Food and Bioprocess Technology, 4(6), 1020-1028. 648
Petigny, L., Périno, S., Minuti, M., Visinoni, F., Wajsman, J., & Chemat, F. (2014). 649
Simultaneous Microwave Extraction and Separation of Volatile and Non-Volatile 650
Organic Compounds of Boldo Leaves. From Lab to Industrial Scale. International 651
journal of molecular sciences, 15(5), 7183-7198.
652
Pingret, D., Fabiano-Tixier, A., & Chemat, F. (2013). Degradation during application of 653
ultrasound in food processing: a review. Food Control, 31(2), 593-606. 654
Pingret, D., Durand, G., Fabiano-Tixier, A., Rockenbauer, A., Ginies, C., & Chemat, F. 655
(2012). Degradation of edible oil during food processing by ultrasound: electron 656
paramagnetic resonance, physicochemical, and sensory appreciation. Journal of 657
Agricultural and Food Chemistry, 60(31), 7761-7768.
658
Proestos, C., Boziaris, I. S., Nychas, G. J. E., & Komaitis, M. (2006). Analysis of flavonoids 659
and phenolic acids in Greek aromatic plants: Investigation of their antioxidant 660
capacity and antimicrobial activity. Food Chemistry, 95(4), 664-671. 661
Proestos, C., & Komaitis, M. (2008). Application of microwave-assisted extraction to the fast 662
extraction of plant phenolic compounds. LWT - Food Science and Technology, 41(4), 663
652-659. 664
Rabhi, C., Arcile, G., Cariel, L., Lenoir, C., Bignon, J., Wdzieczak-Bakala, J., & Ouazzani, J. 665
(2015). Antiangiogenic-Like Properties of Fermented Extracts of Ayurvedic 666
Medicinal Plants. Journal of Medicinal Food. doi:10.1089/jmf.2014.0128. 667
Rombaut, N., Tixier, A., Bily, A., & Chemat, F. (2014). Green extraction processes of natural 668
products as tools for biorefinery. Biofuels, Bioproducts and Biorefining, 8(4), 530-669
544. 670
Shao, P., He, J., Sun, P., & Zhao, P. (2012). Analysis of conditions for microwave-assisted 671
extraction of total water-soluble flavonoids from Perilla Frutescens leaves. Journal of 672
Food Science and Technology, 49(1), 66-73.
673
Spigno, G., & De Faveri, D. M. (2009). Microwave-assisted extraction of tea phenols: A 674
phenomenological study. Journal of Food Engineering, 93(2), 210-217. 675
Spigno, G., Tramelli, L., & De Faveri, D. M. (2007). Effects of extraction time, temperature 676
and solvent on concentration and antioxidant activity of grape marc phenolics. 677
Journal of Food Engineering, 81(1), 200-208.
678
Virot, M., Tomao, V., Le Bourvellec, C., Renard, C. M., & Chemat, F. (2010). Towards the 679
industrial production of antioxidants from food processing by-products with 680
ultrasound-assisted extraction. Ultrasonics sonochemistry, 17(6), 1066-1074. 681
Yang, L., Jiang, J.-G., Li, W.-F., Chen, J., Wang, D.-Y., & Zhu, L. (2009). Optimum 682
extraction Process of polyphenols from the bark of Phyllanthus emblica L. based on 683
the response surface methodology. Journal of Separation Science, 32(9), 1437-1444. 684
Zhang, H.-F., Yang, X.-H., & Wang, Y. (2011). Microwave assisted extraction of secondary 685
metabolites from plants: current status and future directions. Trends in Food Science 686
& Technology, 22(12), 672-688.
687
Zhang, S., Bi, H., & Liu, C. (2007). Extraction of bio-active components from Rhodiola 688
sachalinensis under ultrahigh hydrostatic pressure. Separation and Purification 689
Technology, 57(2), 277-282.
Figure captions
691
Figure 1. Response surface analysis for the total phenolic yield from Citrus sinensis peels 692
with microwave assisted extraction with respect to solvent-solid ratio and extraction time (A); 693
solvent-solid ratio and acetone concentration (B); microwave power and acetone 694
concentration (C); solvent-solid ratio and microwave power (D); extraction time and acetone 695
concentration (E); microwave power and extraction time (F). 696
Figure 2. Antioxidant activity of Citrus sinensis peel extracts by microwave-assisted 697
extraction (MAE), conventional solvent extraction (CSE), ultrasound-assisted extraction 698
(UAE) and accelerated solvent extraction (ASE) as assessed using % inhibition of DPPH 699
radicals. The effective concentration of extracts required to scavenge DPPH radical by 50% 700
(IC50 value) was obtained by linear regression analysis. 701
Figure 3. Chromatograms of phenolic acids in different fractions (A: fraction 1; B: fraction 702
2; C: fraction 3; D: fraction 4) of microwave-assisted extracted (MAE) of Citrus sinensis peel 703
extracts. Phenolic compound 1: gallic acid; 2: chlorogenic acid; 3: caffeic acid; 4: ferulic 704
acid; 5: p-coumaric acid and 6: rutin. Elution times and maximum absorbance of individual 705
phenolic acids were determined using a reverse phase C18 column in HPLC. The mobile 706
phase A was a mixture of 6:94 (v/v) acetic acid in distilled water and mobile phase B 707
consisted of 100% HPLC grade acetonitrile. The solvent gradient in volume ratios was as 708
follows: 0–40 min, 0–25% B; 40–80 min, 25–85% B; 80–90 min, 85–100% B; 90-95 min, 709
100% B. 710