HAL Id: hal-02877774
https://hal.archives-ouvertes.fr/hal-02877774
Submitted on 20 Nov 2020HAL is a multi-disciplinary open access
archive for the deposit and dissemination of sci-entific research documents, whether they are pub-lished or not. The documents may come from teaching and research institutions in France or abroad, or from public or private research centers.
L’archive ouverte pluridisciplinaire HAL, est destinée au dépôt et à la diffusion de documents scientifiques de niveau recherche, publiés ou non, émanant des établissements d’enseignement et de recherche français ou étrangers, des laboratoires publics ou privés.
in a Semi-Continuous Reactor
Carlos Murillo, Ghislain Irakoze, Karine de Oliveira Vigier, Michel Delmas,
François Jérôme, Yolande Peres-Lucchese, Martine Urrutigoity, Patrick Cognet
To cite this version:
Carlos Murillo, Ghislain Irakoze, Karine de Oliveira Vigier, Michel Delmas, François Jérôme, et al.. Modeling of Ethylene Glycol Production from Glucose in a Semi-Continuous Reactor. Chemical Engineering and Technology, Wiley-VCH Verlag, 2020, 43 (5), pp.950-963. �10.1002/ceat.201900346�. �hal-02877774�
1 Carlos MURILLO1,*
Ghislain IRAKOZE1
Karine DE OLIVEIRA VIGIER2
Michel DELMAS1
François JÉRÔME2
Yolande PÉRÈS1
Martine URRUTIGOITY3
Patrick COGNET1,*
Title of the manuscript MODELING OF THE ETHYLENE GLYCOL PRODUCTION FROM
GLUCOSE IN A SEMI-CONTINUOUS REACTOR
Abstract Text: A numerical study describes the catalytic conversion of glucose into ethylene glycol (EG) in a semibatch reactor. This analysis couples a set of power law models (homogeneous reactions) and LHHW equations (hydrogenations). For this purpose, the kinetic parameters of the LHHW expressions are estimated for the reaction conditions. Then, the kinetic model evaluates the influence of the H2 pressure and the catalyst concentrations on the selectivity. The results
indicate that the EG yield is increased by setting the temperature (220-240°C) and the H2 pressure
(41-48 bar). In this manner, the process reduces the hexitols and methane production and increases the EG yield. The originality of the work is based on the influence of the H2 pressure
and the catalyst concentrations in the model.
Keywords: Ethylene glycol, glucose, reaction kinetics, modelling, semi-continuous reaction
Author affiliations
1Université de Toulouse, CNRS, INP, UPS, Laboratoire de Génie Chimique, 31030, France. 2Ecole Nationale Supérieure d'Ingénieurs de Poitiers, CNRS, Institut de Chimie des Milieux et
Matériaux de Poitiers (IC2MP, UMR7285), 86073, France.
3Université de Toulouse, CNRS, INP, UPS, Laboratoire de Chimie de Coordination, 31030,
France.
Email corresponding author: patrick.cognet@ensiacet.fr
1 Introduction
Ethylene glycol is a commodity whose consumption is associated with various industries such as energy, chemicals, automotive, textiles, transportation, and manufacturing technologies [1]. For instance, it can be used as an antifreeze in automobile radiators due to its ability to lower the
2
freezing point when mixed with water. Additionally, it is widely utilized as a raw material for the manufacture of polyester fibers [2]. For this reason, the global production and consumption of this diol were about 20 million metric tons in 2010 and reached 25 million tons in 2015 [1], [3]. Several synthesis routes were developed to produce EG [1], [2], but the major part of the market share relies on the production from ethylene oxide hydration. This fact associates the production of this diol to the petroleum industry, which represents an economic manufacture technology. the diminution of the fossil-fuel resources and the increasing environmental concerns make it necessary to consider other economical and energy-efficient processes [1]. At this moment, the manufacture of ethylene glycol from other sources such as syngas [4] or biomass [5] become more interesting alternatives.
Biomass is a convenient substitute for fossil resources because it can be transformed into useful organic compounds [6]. Indeed, glucose can be considered as a potentially promising feedstock for the production of EG because it is available for continuous processing on a large scale [7], [8]. For this purpose, agricultural wastes can be treated to obtain cellulose, which can subsequently be hydrolyzed to glucose. Then, glucose is transformed into glycolaldehyde with a homogeneous catalyst. Finally, the aldehyde is hydrogenated to ethylene glycol with a solid catalyst dispersed in the mixture.
The conversion of glucose into ethylene glycol constitutes an opportunity to benefit from a renewable raw material and generate a massive reduction in CO2 emission [9]. However, the
main drawback of this synthesis route is associated with the presence of several side reactions that decrease considerably the yield of the chemical process. For this reason, this technique requires a thorough analysis for determination of the operating conditions that will enhance the conversion of glucose into ethylene glycol. Previously, Zhao et al. developed a kinetic model for the main reactions of this process with an approach based on power law equations with apparent constants [3]. In this manner, their mathematical analysis evaluated the influence of the reaction temperature and the feed rate on the yields obtained in a semi-batch reactor. These results allowed concluding that the selectivity to ethylene glycol is increased when the reaction temperature is between 200 and 240 °C. Additionally, Zhang et al. characterized the kinetics of the glucose and glycolaldehyde hydrogenations occurred at the surface of the solid catalyst by establishing a set of Langmuir-Hinshelwood-Hougen-Watson (LHHW) equations for temperatures between 100 and 130 °C [8].
The aim of this study is to propose a global kinetic model based on the combination of the approaches based on power law models for the homogeneous reactions and LHHW models for the heterogeneous reactions. For this purpose, the parameters of the LHHW equations are estimated according to literature data for the temperature range suggested by Zhao et al. [3], [5]. The new model is then implemented in a semi-batch reactor mass balance. In this manner, the influence of operating conditions of a semi-batch operation such as temperature, hydrogen partial pressure, catalyst concentrations and glucose feeding rate, on EG yield and selectivity can be described. Subsequently, a sensitivity analysis of the key operating variables is performed. These results complement the previous experimental and computational studies of the glucose conversion into ethylene glycol within a semi-continuous reactor.
2 Chemical reaction network
The high chemical activity of glucose allows performing its catalytic conversion to ethylene glycol at mild conditions with high efficiencies [5]. In addition, this compound can be obtained from high-concentration sugar solutions [10]. Therefore, ethylene glycol is produced from this monosaccharide at high concentrations and low energy consumption in the ethylene glycol purification. However, the synthesis route also has certain drawbacks due to the occurrence of
3
competitive reactions that promote the conversion of glucose to hexitols, polyols with 3 or 4 carbon atoms, humins, and gases. Hence, it is necessary to describe the ethylene glycol production as a part of a reaction network in order to identify the most appropriate operating conditions. The six types of chemical reactions that compose the chemical process of this study are shown in in supporting information and described as follows:
i. Retro-aldol condensation: This chemical reaction corresponds to the decomposition of
a β-hydroxyl carbonyl into an aldehyde or ketone. It is observed in this chemical process following the conversion of glucose into erythrose and glycolaldehyde. Additionally, it is associated with the formation of dihydroxyacetone (DHA) and 2,3 dihydroxypropanal (DHP) from fructose [3], [11]. Retro-aldol condensation is affected by the medium conditions. The reaction can be carried out in an acid or basic medium and in supercritical water [12]. According to literature, several tungstic compounds such as tungsten oxide, tungstophosphoric acid, tungsten acid, tungstosilicic acid and ammonium metatungstate (AMT) can be used for this purpose [5], [13], [14]. AMT is usually selected since it provides the highest ethylene glycol yields due to its solubility in aqueous media [15]. According to this analysis, the kinetic model developed in this study considers the addition of AMT as the homogeneous catalyst.
The use of AMT reduces both glucose and glycolaldehyde hydrogenation reaction rates [8]. Hence, the global ethylene glycol yield is notably enhanced by the addition of this homogeneous catalyst in spite of the depletion of the glycolaldehyde hydrogenation.
ii. Hydrogenation: This reaction is mainly associated with the formation of ethylene glycol
from glycolaldehyde. However, the hydrogen dissolved in the aqueous solution also reacts with saccharides (glucose, fructose, and mannose) to produce hexitols (sorbitol and mannitol). Furthermore, erythrose, DHA and DHP can also produce three-carbon or four-carbon polyols due to competitive hydrogenation. These compounds are highly stable; therefore, they cause the diminution of the global ethylene glycol yield [16].
Hydrogenation reactions are carried out with the dispersion of a heterogeneous catalyst. Nickel compounds are commonly used for industrial-scale processes due to their low costs. However, due to their several drawbacks [17], these catalysts are currently being replaced by others whose structures are composed of a noble metal supported on activated carbon (AC). Zhao et al. developed a comparative analysis of the yields obtained with various catalysts: Ru/AC, Pt/AC, Pd/AC, Ir/AC and Raney Ni [5]. Their experimental tests evidenced a higher yield and selectivity to ethylene glycol with ruthenium (4% Ru/AC). Besides this advantage, this metal-based catalyst is characterized by a comparatively low price with regard to other noble metals [9]. This study is performed with experimental data obtained in the literature for 4% Ru/AC as heterogeneous catalyst [3], [5].
iii. Thermal side reactions: Some insoluble by-products (humins or tars) can be produced
due to high reactant concentrations and reaction temperatures over 260 °C. Thus, it is necessary to control the temperature below this value.
iv. Isomerization: Glucose injected into the aqueous solution can isomerize into fructose.
This reaction is enhanced by the presence of basic active carbon [14]. Fructose will produce different by-products by subsequent hydrogenation reactions. In fact, fructose produces DHA and DHP which can transform respectively into 1,2 propylene glycol and glycerol.
v. Epimerization: Glucose can be converted into mannose due to a rotation of the C2-C3
bond. Subsequently, mannose can be directly hydrogenated to mannitol (hexitol). The epimerization reaction requires a substantial reorganization of the water shell of the molecule in the aqueous solution. For this reason, the mannose production rate is slower than that of fructose [18]. However, this reaction rate can be increased by the presence of basic catalysts and Lewis acids [19].
4
vi. Hydrogenolysis: Ethylene glycol can decompose due to a reaction with dissolved
hydrogen to produce methane [20]. This transformation represents another issue of an overheating process in the chemical reactor.
After describing the different reactions involved in the glucose conversion into ethylene glycol, a kinetic model is developed in the next section, based on the simplification of the reaction network.
3 Kinetic model
The influence of the catalyst concentrations and the hydrogen partial pressure on the reaction yields can be analyzed numerically with the development of a kinetic model that takes into account these operating parameters. For this purpose, some simplifications are proposed for the reaction network presented in the last paragraph according to experimental evidence reported in the literature. Subsequently, the simplified network is represented with the scheme proposed [21]. Finally, the models proposed by Crezee [22] and Zhang et al. [8] for the aldose hydrogenations are included to analyze the influence of the operating conditions on the yields of ethylene glycol, hexitols, and methane.
3.1 Simplified reaction network
The catalytic conversion of glucose to ethylene glycol can be represented according to the simplified scheme proposed [21]. This mathematical approach is based on a reaction network that only considers seven chemical reactions. For this purpose, the following simplifications are proposed by the cited authors for the global network:
A. Chemical reactions with yields below 7% are neglected.
B. The production of mannitol and sorbitol are not distinguished because both reactions have a similar overall effect in the chemical process.
C. Thermal side reactions are considered as two overall reactions for glucose and glycolaldehyde.
D. Erythrose is considerably more reactive for the retro-aldol condensation than glucose. In accordance with these simplifications, the global reaction network can be represented according to the scheme shown in Figure 1 and Table 1:
5
Figure 1. Simplified reaction network [21].
Table 1. T Simplified chemical reaction network of the catalytic conversion of glucose to
ethylene glycol [21].
Chemical reaction Chemical equation
1. Retro-aldol condensation of glucose to erythrose and glycolaldehyde C H O6 12 6 C H O4 8 4C H O2 4 2 2. Glucose hydrogenation to hexitols C H O6 12 6H2 C H O6 14 6
3. Glucose side reactions C H O6 12 6 xByP
4. Erythrose conversion to glycolaldehyde C H O4 8 4 2C H O2 4 2 5. Glycolaldehyde hydrogenation to ethylene glycol C H O2 4 2H2 C H O2 6 2 6. Glycolaldehyde side reactions C H O2 4 2yByP
7. Methane production
C H O
2 6 2
3
H
2
2
CH
4
2
H O
2The glycolaldehyde accumulation is approximately zero due to its high hydrogenation rate. In addition, the erythrose concentration is also considered quite low due to the minimum erythritol production observed experimentally by Zhao et al. [21]. According to the hypothesis D discussed above, each erythrose molecule produced per mole of glucose will transform into two molecules of glycolaldehyde instantaneously. Hence, the reaction 4 can also be omitted by considering that 3 molecules of glycolaldehyde are produced after the retro-aldol condensation of glucose.
3.2 Kinetic model N°1: Power law models
The kinetic model proposed by Zhao et al. [21] defines the rate of the reaction 𝑖 according to a power law model based on an apparent kinetic constant. This numerical approach is defined for the reactions 1, 3, 6 and 7:
6 reactant reactant exp ai i i i E r A c k c RT (1)
Each power law corresponds to a pseudo-first order for the organic compound except for 𝑟6.
Indeed, a different definition is required for the glycolaldehyde side reactions due to the high sensitivity of the ethylene glycol yield to the glycolaldehyde concentration. This condition is implemented in the mathematical model by considering a pseudo-second reaction order for the glycolaldehyde side reactions (𝑟6).
The pre-exponential factor of the retro-aldol condensation (𝐴1) can be modified to take into
account the influence of the ammonium metatungstate concentration (CAMT) on the reaction rate.
The nonlinear increase of this rate with the catalyst amount can be represented with a modification of the value of the apparent kinetic constant [23]. In this manner, the term 𝐴1 is substituted by the
product of a corrected pre-exponential factor (𝐴1∗) and the AMT concentration at the power of
0.257:
* 0.257
1 1 AMT
A
A C
(2)The value of the corrected pre-exponential factor is estimated in this study by considering the experimental tests carried out by Zhao et al. [21]. The results obtained in a batch reactor of 20 mL with 0.06 grams of AMT (CAMT = 1.01 mol·m-3) allowed establishing the value of 𝐴1∗ as
5.02·1017min-1·(mol·m-3) -0.257. Hereafter, the apparent kinetic constants of the reactions 1, 3, 6
and 7 are estimated according to the following parameters:
Table 2. Parameters of the power law models [21], [23].
Reaction rate
(mol·L·min-1) Pre-exponential factor (𝑨𝒊)
Activation energy (𝑬𝒂𝒊) (kJ·mol-1) CONCENTRATION (𝑪𝒓𝒆𝒂𝒄𝒕𝒂𝒏𝒕 𝜸 ) 𝒓𝟏 5.57·1015 ·CAMT0.257 min-1 (CAMT [mol·m-3]) 141.3 𝐶𝐺𝑙𝑢𝑐𝑜𝑠𝑒 𝒓𝟑 1.70·1010 s-1 106.3 𝐶 𝐺𝑙𝑢𝑐𝑜𝑠𝑒 𝒓𝟔 3.44·108 mol-1·m3·min-1 66.5 𝐶𝐺𝑙𝑦𝑐𝑜𝑙𝑎𝑙𝑑𝑒ℎ𝑦𝑑𝑒2 𝒓𝟕 1.87·105 min-1 77.7 𝐶𝐸𝑡ℎ𝑦𝑙𝑒𝑛𝑒 𝑔𝑙𝑦𝑐𝑜𝑙
3.2 Kinetic model N°2: Langmuir Hinshelwood Hougen Watson (LHHW) equations
Three phases are involved in the process: Hydrogen, aqueous phase and solid catalyst. Hence, the hydrogenation reactions may be limited by mass-transfer. Glucose and glycolaldehyde react with adsorbed hydrogen at the surface of the supported metal. The hydrogen transport towards the liquid phase must be considered. The hydrogen solubility in aqueous solutions is quite low since D-glucose solutions are relatively viscous [22]. These issues affect the mass-transfer rate but are overcome by setting an impeller speed that is high enough to disperse a sufficient amount of gas in the liquid phase and increase the interfacial area with a greater bubble breakage. In this manner, the reaction rate becomes independent of the agitation regime and the first resistance is suppressed [8], [24]. Similarly, the liquid-solid mass transport effect shows efficiency above 95%, which indicates the possibility of neglecting the limitations on the transport towards the surface of the solid dispersed in the aqueous phase [22].
7
Secondly, the internal diffusion effects establish an important limitation only when the glucose concentrations are above 50% wt. or when the selected temperature implies a regime transition [22]. On the one hand, high glucose concentrations lead to a partial ionization of the molecule and therefore a low interaction with the solid catalyst. On the other hand, the temperature of the solution determines if the diffusive transport constitutes the controlling regime of the chemical reaction instead of the kinetics [25]. The chemical control condition was evidenced in previous studies that established that the activation energies of the hydrogenation reactions are greater than the activation energies of diffusion in liquids (12-21 kJ·mol-1) [7], [21]. However, the slopes
of the Arrhenius’s plots change due to a shift from a chemical control in the low-temperature region to a diffusion control in the high-temperature region [22]. This transition reduces the activation energies of the heterogeneous reactions. For this reason, it is necessary to consider different kinetic parameters for the hydrogenation reactions.
Hydrogenation can be described with pseudo-first order equations for glucose if the chemical process is carried out in the chemical control regime with an important hydrogen excess. For instance, Verma and Gehlawat [26] and Zhao et al. [21] described the kinetics of the D-glucose hydrogenation with nickel and ruthenium according to first and second order rate-laws based on apparent constants. However, this formulation cannot be envisaged for a wide temperature span due to the regime shift of the heterogeneous reactions.
3.3.1 Kinetic model formulation
A new definition was proposed for the hydrogenation rate-laws according to a Langmuir-Hinshelwood-Hougen-Watson (LHHW) equation [22]. This formulation provides an explicit way to describe the interaction of the reacting components with the catalytic surface [27]. For this purpose, it is compulsory to take into account the predominance of each phenomenon associated with the mass transport and kinetics in the chemical reaction. In accordance with this statement, three kinetic models can be evaluated for the D-glucose hydrogenation [22]:
A. Non-competitive adsorption of hydrogen and D-glucose at different catalyst sites. The gas is adsorbed in a dissociative or molecular condition.
B. Competitive adsorption of hydrogen and D-glucose at different catalyst sites. C. Competitive adsorption of dissociatively chemisorbed hydrogen and D-glucose.
The hydrogenation reactions are considered to be rate determining. Therefore, the corresponding overall rate equation of each kinetic model must also depend on the hydrogen pressure (𝑃𝐻) [27].
In accordance with this statement, the glucose hydrogenation can be described according to the following expression:
2 2 1 H Glu Glu H n Glu Glu K K C P r k K C (1)The models are based on a linear dependency of the kinetic constant (𝑘2) along with the
adsorption constant of the glucose (𝐾𝐺𝑙𝑢) and hydrogen (𝐾𝐻). These alternatives are based on
similar assumptions since they consider a negligible adsorption of solvent and products and do not make a distinction for the hexitols production. However, they differ from each other due to the exponent 𝑛 of their adsorption terms in the LHHW equation. The value of this variable is one, two or three for the alternatives A to C respectively.
The statistical analysis of these kinetic models established that all of them could be considered for the description of the hydrogenation reactions. Nevertheless, the alternative B seems unlikely since it considers a molecular hydrogen adsorption instead of a dissociative chemisorption [22].
8
In accordance with this statement, the exponent of the adsorption term can be one or three for the glucose hydrogenation.
The LHHW kinetic model shown in Equation 3 has been developed with an alternative formulation of the atomic hydrogen noncompetitive adsorption with the aldose adsorption [8]. By following this assumption, the reaction rates can be expressed with the following adaptations of the model A:
'
2 2 2
1
1
Glu Glu rut H H Glu Glu H H
K
C
W
K P
r
k
K
C
V
K P
(2)
' 5 5 21
1
GA GA rut H H GA GA H HK C
W
K P
r
k
K C
V
K P
(5)[8], [11] established that the external diffusion limitations, associated with the gas-liquid and liquid-solid mass transfer, can be safely eliminated when the reaction was operated at a stirring speed above 900 rpm, catalyst loading below 0.6 g and catalyst particle size smaller than 74 mm (>200 mesh). In accordance with this statement, the experimental data are obtained under operating conditions that allow considering a low influence of the external mass transfer limitations. Moreover, the experimental analyses carried out by Zhang et al. [8] established that the hydrogen adsorption term in the denominator is negligible compared to the glucose adsorption term due to its considerably low concentration in the aqueous solution. This fact allows neglecting the factor associated with the hydrogen adsorption (1 + √𝐾𝐻𝑃𝐻) and combining 𝐾𝐻 with 𝑘2′ or 𝑘5′.
3.3.2 Effects of the ammonium metatungstate on the heterogeneous catalyst
Some complementary modifications of the reaction rate-laws are proposed to take into account the suppressing effects exerted by the homogeneous catalyst on the aldose hydrogenations [8]. Firstly, it is necessary to consider the AMT adsorption on the surface of the ruthenium, which constitutes a catalyst poisoning effect. This can be achieved by including a term in the denominators of the rate-laws. For this purpose, Equations 4 and 5 must also have an additional adsorption factor based on the AMT concentration (𝐶𝐴𝑀𝑇) and its adsorption equilibrium constant
(𝐾𝐴𝑀𝑇). Secondly, the binding characteristics of the ammonium metatungstate represent the
formation of different complexes due to the interaction with the dissolved aldoses. For this reason, some additional assumptions can be considered to modify the LHHW rate-laws [8]:
The complex formed by coordination of AMT with glucose or glycolaldehyde in solution can also be adsorbed on the Ru/AC surface.
Free or adsorbed AMT binds glucose molecules gradually until a maximum of four. On the contrary, glycolaldehyde is adsorbed with a stoichiometric ratio of 1/1.
The binding with AMT does not affect the surface reaction rate between the adsorbed aldose and hydrogen.
These assumptions define another term based on the adsorption terms of the rate-laws. These factors are determined by the equilibrium constants of the complexes formed with glucose (𝐾𝐺−𝐴𝑀𝑇) and glycolaldehyde (𝐾𝐺𝐴−𝐴𝑀𝑇). Henceforth, Equations 4 and 5 can be rewritten in the
following manner:
' 3
10
Glu Glu9 ' 3
10
GA GAC
C
(7) ' 310
AMT AMTC
C
(8)
' ' 4 '
2 2 ' ' 4 ' ' ( ) 1 ( )H H Glu AMT AMT Glu Glu Glu rut
Glu AMT AMT Glu Glu Glu AMT AMT
K P K C C K C W r k K C C K C K C V (9)
' ' '
5 5 ' ' ' ' 1H H GA AMT AMT GA GA GA rut
GA AMT AMT GA GA GA AMT AMT
K P K C C K C W r k K C C K C K C V (10)
Each adsorption equilibrium and kinetic constant can be calculated according to a power law whose parameters are listed in Table 3:
Table 3. Parameters for the equilibrium adsorption constants in the presence of AMT [8].
Constant Compound Pre-exponential
factor
Activation or adsorption energy (J·mol-1) G
K
Glucose 1.56·10-3 -16500 GAK
Glycolaldehyde 2.28·10-2 -10300 Glu AMTK
Complexes formed with glucose 1.70·10–11 -67300
GA AMT
K
Complexes formed with glycolaldehyde 1.92·10-4 -35700
AMT
K
Ammonium metatungstate 10.7 -98902 H
k K
Hydrogen (Product with the kinetic constant 𝑘2) 9.55 49900The association of this kinetic model with the power law equations requires the recalculation of the data listed in Table 3 according to the temperature range of the chemical process (180°C-240°C). For this purpose, the operation of a semi-batch reactor is represented with a mathematical model in order to estimate the values of the kinetic parameters of Equations 9 and 10 with the experimental data reported [5], [21].
4 Mathematical model of a semi-continuous reactor
The adaptation of the LHHW rate-laws in the global kinetic model is achieved with a numerical scheme based on an error minimization. This procedure is defined according to the root-mean-square error associated with the ethylene glycol and hexitols yields estimated with the constants of the LHHW model and the experimental data. The sum of the individual errors is minimized through an iterating scheme that adjusted the values of the constants listed in Table 3.
Firstly, this section describes the ordinary differential equations system that is envisaged to represent the experimental tests carried out in a semi-continuous reactor. The initial conditions of
10
this system are established according to the experimental tests performed [21]. Then, the error minimization method is also explained in order to describe the scheme considered in this study for the parameters estimation.
4.1 Semi-continuous reactor
Glucose is mainly converted into hexitols (sorbitol and mannitol) when the chemical reactions are carried out in a batch reactor. Previous studies established that the ethylene glycol and hexitols yields are up to 7.0% and 39.5% respectively [5]. On the contrary, the EG yield reached an overall yield of 50.2% in a semi-continuous operation. This result indicates the necessity of a permanent feed at low flowrates that maintains low glucose concentrations to deplete the side reactions (2, 3 and 6). In addition, glucose readily undergoes a hydrogenation reaction to form stable sorbitol at temperatures as low as 80°C in the presence of Ru/AC catalyst [5].
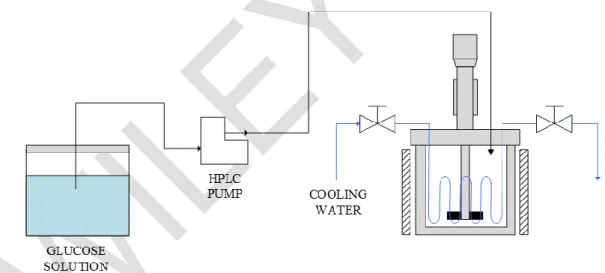
Besides the selectivity increase generated by the glucose feed at high temperatures, a semi-batch reactor also leads to higher yields due to the reactant concentration control. These operating conditions of the semi-batch reactor also lead to a reduction of the mass transfer limitations by reducing the viscosity of the liquid phase and generating glucose concentrations below 50 % wt. In the same manner, mass-transfer efficiency is enhanced with a high agitation speed (1000 rpm) and hydrogen pressures over 40 bar. In accordance with these statements, the numerical scheme of this study considers the reactor that is shown in Figure 2.
The system is modeled according to the perfectly stirred reactor approach proposed by Crezee [22], Zhang et al. [8] and Zhao et al. [21]. Therefore, the main aspects associated with the velocity profiles of the internal flow and the segregation levels of the heterogeneous catalyst are not considered in the computational model.
Figure 2. Scheme of the semi-batch reactor and the solution injection system. 4.2 Ordinary differential equation system
The linear approach proposed in this study was modified in this study in order to describe the operation of a semi-continuous reactor according to an ordinary differential equation system. For this purpose, we defined a carbon mass balance for each compound by considering the rate-laws proposed for the 7 reactions of the simplified scheme. Firstly, the molar balance of glucose in a perfectly stirred semi-continuous reactor is defined in Equations 11and 12. These expressions consider a constant feed rate of this saccharide (𝑁𝐺𝑙𝑢𝐹𝑒𝑒𝑑) and the rates of reactions 1 to 3.
11 3 Feed Glu Glu 1 i i
dN
N
rV
dt
(11) Feed Glu Glu0N
FC
(12)5 Results and discussion
5.1 Kinetic parameters of the hydrogenation rate-laws
The kinetic model based on apparent constants that was proposed by Zhao et al. [21] determined that the regime transition of the controlling phenomenon occurs at different temperatures for both aldose hydrogenations. The glycolaldehyde hydrogenation attains the diffusion controlling regime when the temperature is above 100 °C whereas the glucose reaction requires a temperature over 160 °C to reach this level. This fact demands the adaptation of the rate-laws proposed by Zhang et al. [23] for a higher temperature range (180–240°C).
5.1.1 Parameters calculation
The kinetic parameters listed in Table 3 are recalculated with a numerical model based on the minimization of the least squares error. For this purpose, an objective function defines a global error as the sum of the yield errors of the main products: ethylene glycol, hexitols, and methane. The experimental data determined by Zhang et al. [5], [21] for a set of tests in a semi-batch reactor are compared with the yields predicted with the ordinary differential equations system. In this manner, the algorithm corrected the values of the kinetic parameters of Equations 9 and 10 by minimizing the sum of the squares of the errors. The values reported by Zhang et al. [8] are considered for the first iteration except for the activation energy and the pre-exponential factor of the product 𝑘2′𝐾
𝐻. These parameters are initially estimated according to the apparent constant
proposed by Zhao et al. [21] for the constant 𝑘2 in Equation 1. In this manner, the calculation
considered that the true activation energy of the glucose hydrogenation is equal to twice its apparent activation energy [28]. Thereafter, the objective function is minimized by using the
fminsearchbnd routine of MATLAB for nonlinear functions. This code allows considering bound
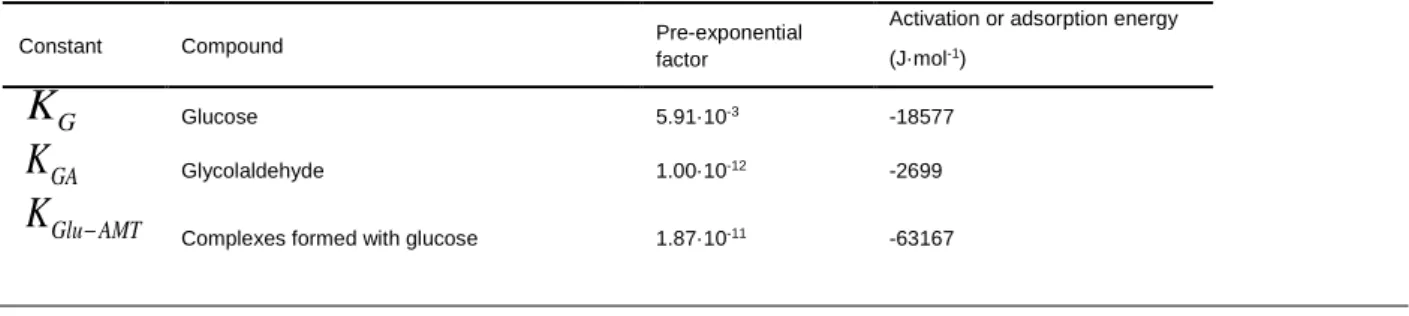
constraints in the optimization engine used by fminsearch. For this purpose, a variable transformation is implemented through a wrapper function around the objective function. In this manner, each kinetic parameter of the LHHW equations is determined according to the thermodynamical aspects discussed by Zhang et al. [8]. The obtained values are reported in Table 4:
Table 4. Estimated parameters for the equilibrium adsorption constants in presence of AMT
(temperatures between 180 °C and 260 °C).
Constant Compound Pre-exponential
factor
Activation or adsorption energy (J·mol-1) G
K
Glucose 5.91·10-3 -18577 GAK
Glycolaldehyde 1.00·10-12 -2699 Glu AMTK
12 GA AMT
K
Complexes formed with glycolaldehyde 6.32·10-5 -29631
AMT
K
Ammonium metatungstate 13.95 -36422 H
k K
Hydrogen (Product with the kinetic constant 𝑘2) 8.03·10-4 29447The comparison of the kinetic data shown in Table 3 and Table 4 indicates a considerable diminution in the estimation of the glucose hydrogenation parameters leading to greater values for the parameter 𝑘2′𝐾𝐻 than those of the glucose adsorption constants. Moreover, the activation
energy value of the kinetic factor of the LHHW equation approaches the activation energy value of diffusion in liquids. Thus, it is possible to establish that this chemical reaction is submitted to a diffusion controlling regime at the operating conditions of the one-pot reactor. On the contrary, the values of the glycolaldehyde hydrogenation do not indicate an important variation since the new estimation does not envisage a regime transition.
The kinetic model obtained by the modification of the LHHW equations is used in this section to analyze the influence of some key operating parameters on the selectivity of the chemical process. For this purpose, a sensitivity analysis is proposed in this study for the yields of ethylene glycol, hexitols, and methane. These results are determined by the following equations:
0
3
EG EG Glu GluVC
Y
FC
VC
(13) 0 Hex Hex Glu GluVC
Y
FC
VC
(14)
0
6
Gas Gas Glu GluVC
Y
FC
VC
(15)The parameter fitting is evaluated through a comparison of the yields predicted with the adjusted kinetic model and experimental data. This analysis is performed with the values listed in Table 5
for a set of semi-batch runs. Each experimental test was carried out for 40 minutes at various temperatures with 0.3 g of 4% Ru/AC. Then, the fitting parameters established a mean error equal to 5.8% on the predicted yields with regard to the experimental results.
Table 5. Comparison of the yields estimated with the adapted kinetic model and the
experimental data [21]. Mass of AMT - Ru/AC (g) Temperature (K) H2 pressure (bar) Glucose concentration in feed (% wt.) Feed rate (mL·min-1) Experimental yields (%) Kinetic model (%) Absolute error (%)
EG Hex. CH4 EG Hex. CH4 EG Hex. CH4
0.060 - 0.3 453 50 10 0.667 30.0 65.1 0.0 30.1 64.7 0.1 -0.1 0.4 -0.1 0.060 - 0.3 473 50 10 0.667 59.5 32.0 0.7 59.8 25.7 0.6 -0.3 6.3 0.1
13 0.060 - 0.3 493 50 10 0.667 73.1 11.6 1.8 69.8 7.7 1.6 3.3 3.9 0.2 0.060 - 0.3 503 50 10 0.667 74.6 6.7 2.7 70.2 4.1 2.3 4.4 2.6 0.4 0.060 - 0.3 513 50 10 0.667 73.6 3.9 3.9 69.1 2.1 3.3 4.5 1.8 0.6 0.060 - 0.3 533 50 10 0.667 67.4 1.3 7.0 64.2 0.6 6.2 3.2 0.7 0.8 0.060 - 0.3 513 50 10 0.667 75.8 4.3 3.8 69.1 2.1 3.3 6.7 2.2 0.5 0.060 - 0.3 513 50 10 1.000 50.3 0.8 3.9 56.9 5.2 2.8 -6.6 -4.4 1.1 0.060 - 0.3 513 50 10 2.000 48.1 2.1 5.9 39.5 5.1 2.0 8.6 -3.0 3.9 0.060 - 0.3 513 50 10 10.000 16.9 0.7 6.0 9.9 3.8 0.6 7.0 -3.1 5.4
5.1.2 Comparison with the power-law model
The behavior of the hydrogenation reactions that is predicted with the adjusted LHHW equations is compared with the experimental data obtained by Zhang et al. [5] for temperatures under the diffusion regime. Firstly, the results obtained in a batch reactor preloaded with glucose, 0.06 g of AMT and 0.3 g of 4% Ru/AC are compared with the concentration profile predicted by the adjusted LHHW equation (Figure 3A). The comparative analysis validates the adjustment of the kinetic model after establishing a root-mean squared error equal to 4∙10-4 mol∙L-1 (2.3%) for an initial
glucose concentration of 0.0175 mol∙L-1. Additionally, the concentration profiles predicted for
glycolaldehyde hydrogenation have a good agreement with the experimental data obtained in the same batch reactor (Figure 3B). The comparison of the numerical model with the results obtained in a test carried out at 100 °C with an initial glycolaldehyde concentration of 8.5∙10-3 mol∙L-1
indicates a root-mean squared error equal to 6.9∙10-4 mol∙L-1 (8.1%). Similarly, a test performed
at 120 °C with an initial concentration of 6∙10-3 mol∙L-1 defines an error equal to 4.3∙10-4 mol∙L-1
14
Figure 3. Comparison of the aldose concentrations predicted with the hydrogenation models in
a batch reactor.
5.2 Influence of the reaction parameters
The variables that are considered in this section have a direct effect on the aldose hydrogenation rates. Nonetheless, only the glycolaldehyde hydrogenation belongs to the desired reaction pathway. Therefore, it is necessary to establish the appropriate level of these variables in order to enhance this reaction without increasing the undesired glucose hydrogenation considerably.
15
Previously, the influence of the reaction temperature and the glucose solution feed rate on the ethylene glycol yield has been analyzed [21]. Thus, we propose to study the following variables: Hydrogen partial pressure
Mass of homogeneous catalyst (ammonium metatungstate) Mass of heterogeneous catalyst (ruthenium/activated carbon)
The simulation results show the final yields obtained in a semibatch reactor. The comparative study considers the results obtained after 120 minutes at three different temperatures: 180 °C, 220 °C and 240 °C. Additionally, the solution feed rate and the initial reactor volume are set to values of 0.667 mL·min-1 and 20 mL respectively. The spans of these sensitivity analyses are
defined to describe the behavior of the reaction yields without generating significant variations on the dispersion and turbulence phenomena due to an excessive catalyst addition for the reaction volume. Thereafter, the simulation results of this section are obtained by setting two of the variables of this sensitivity analysis to a fixed value for the variation of the third one.
5.2.1 Hydrogen partial pressure
The hydrogen concentration in the aqueous solution is determined by its solubility. Thus, the influence of the hydrogen pressure can be described by Henry’s law. The increase of the partial pressure of this gas defines a proportional augmentation of the hydrogenation rates [29]. Moreover, previous analyses varied the pressure from 40 to 75 bar and evidenced a linear dependence of this reaction rate on the pressure [22]. This fact allows establishing that this variable has a first-order behavior with respect to hydrogen. However, sugars hydrogenation over ruthenium is often described by zero order kinetics at high hydrogen pressures [30].
The hydrogenation rates determine the concentrations in the chemical reactor during the injection and reaction time. Therefore, the variations of the partial hydrogen pressure are directly associated with the selectivity of the semi-continuous process. Figure 4 describes the evolution of the concentrations predicted by the kinetic model for reactions at 35 and 60 bar.
16
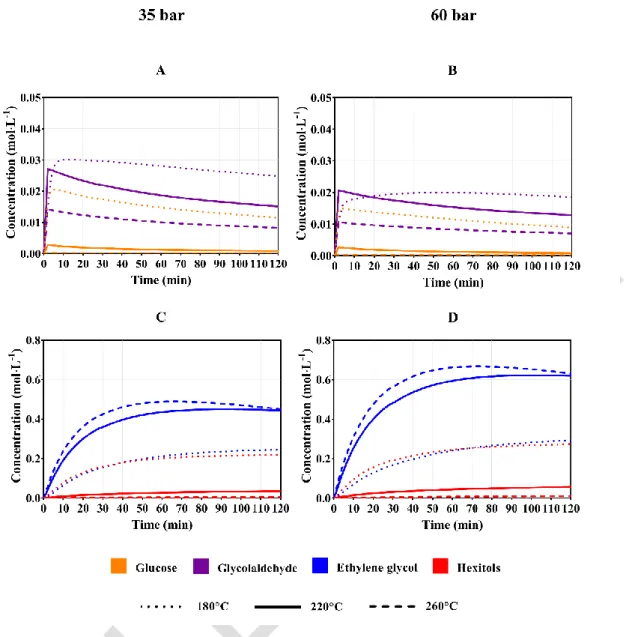
Figure 4. Influence of the hydrogen pressure on the concentrations in the liquid phase.
Conditions: AMT (0.06 g), Ru/AC 4% (0.3 g), 10% glucose solution, initial volume: 20 mL, feed flowrate: 0.667 mL.min-1, reaction time: 120 minutes.
Figure 4A and 4B indicate an important influence of the hydrogen pressure on the glucose and glycolaldehyde concentrations since these variables decrease when the reactor is pressurized at higher levels. This diminution is significant for both compounds when the reaction is carried out at 180 °C due to a low glucose conversion during the initial stages of the chemical process. Nevertheless, higher temperatures only define a significant reduction for the aldehyde. This result allows establishing how the ethylene glycol yield is reduced for excessive pressurization levels in the semibatch reactor. In the same manner, the behaviors observed for glucose and glycolaldehyde differ considerably from each other. On the one hand, Figure 4A and 4B indicate small variations of the glucose concentration during the reaction time. On the other hand, the glycolaldehyde concentrations show a significant time dependence since they reach peak values that are followed by a decreasing tendency at short reaction times. Evidently, low temperatures require longer times to reach the maximum glycolaldehyde concentrations due to a reduced cleavage rate in the glucose C-C bonds.
17
Moreover, the depletion of the glycolaldehyde concentration determines the transient behavior of the ethylene glycol concentration. The synthesis and hydrogenolysis of this diol are affected by high pressures when the reaction is carried out at 260 °C. During the first 60 minutes, the ethylene glycol production is increased by a higher presence of solubilized hydrogen in the liquid phase. Thereafter, the concentration of this compound diminishes continuously due to the gas production within the reactor. In consequence, a limit reaction time must be considered for high reaction temperatures. This behavior is also expected at 180 °C and 220 °C but longer times are required to reach the maximum ethylene glycol concentration. These results allow establishing the most appropriate residence times when other operating conditions of the chemical reactor have already been determined.
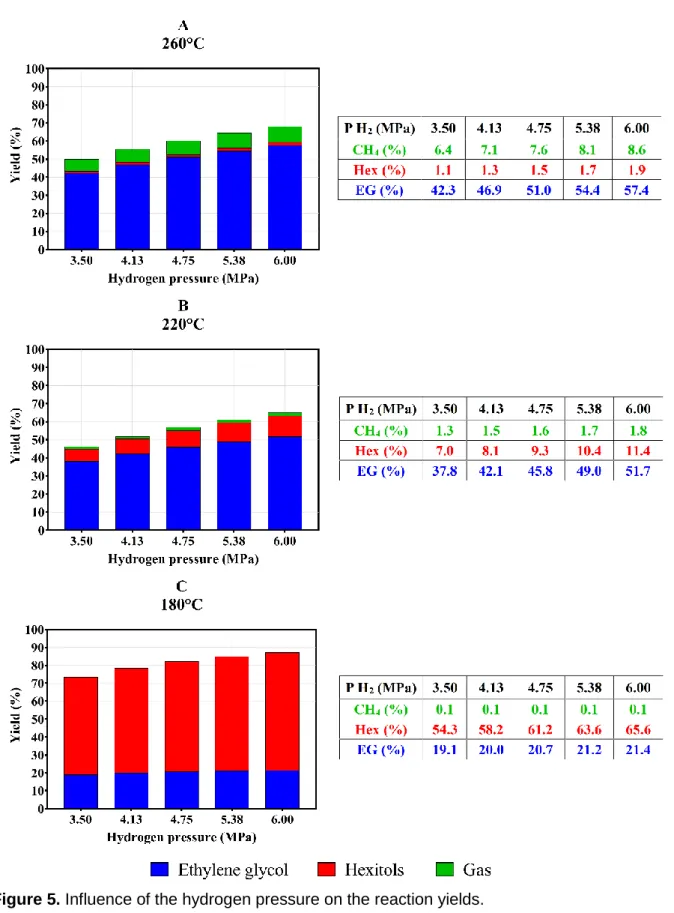
Furthermore, the hydrogen pressure must be at least 20 bar to reduce the formation of by-products such as humins or polymers [5]. However, it is recommended to pressurize the gas until 50 or 60 bar in order to obtain high ethylene glycol yields and a low gas production during the synthesis process. For this case study, Figure 5 describes the yields obtained for ethylene glycol, hexitols and methane at the temperatures that are considered above. Firstly, the results of the kinetic model at 260 °C (Figure 5A) indicate show an increase of the methane production when the hydrogen pressure is augmented. For pressures over 54 bar the gas production can achieve yields over 9% due to a high ethylene glycol decomposition. Therefore, the reactor operation above this pressure level is not recommended since it will be restrained by short injection periods. On the contrary, Figure 5C shows that the influence of the hydrogen pressure is negligible at 180 °C due to the high selectivity to hexitols. Finally, an intermediate behavior is observed at 220 °C in Figure 5B, which shows the increase in the production of the three compounds as the pressure increases. For this particular case, the operating pressure is defined by the augmentation of the three yields. In fact, the increases of the ethylene glycol yields stabilize when the pressure is over 47.5 bar whereas the increase of the by-products yields remains. This fact implies that pressures between 41 and 48 bar should be considered in order to reduce the hexitols and methane production and avoid an unnecessary increase of the operating costs.
18
Figure 5. Influence of the hydrogen pressure on the reaction yields.
Conditions: AMT (0.06 g), Ru/AC 4% (0.3 g), 10% glucose solution, initial volume: 20 mL, feed flowrate: 0.667 mL.min-1, reaction time: 60 minutes.
19
5.2.2 Mass of homogeneous catalyst (ammonium metatungstate)
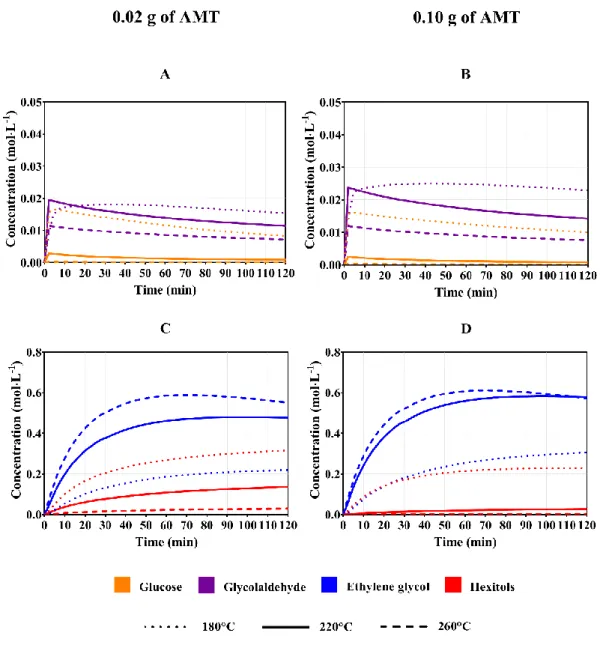
The influence of the homogeneous catalyst concentration on the ethylene glycol yield of this chemical process is also considered in this study through the variation of the amount of this catalyst that is preloaded in the reactor. Figure 6 shows the evolution of the concentrations of the organic compounds in the liquid phase when two different amounts of ammonium metatungstate are charged. Firstly, Figure 6A and 6B show that the glucose concentration decreases considerably due to the preload of higher concentrations of this catalyst if the reaction temperature is below 200 °C. On the contrary, the glycolaldehyde concentration shows an increase at all the reaction temperatures when the preloaded mass of AMT is 0.10 g instead of 0.02 g.
Figure 6. Influence of the mass of AMT on the concentrations in the liquid phase.
Conditions: Ru/AC 4% (0.3 g), 50 bar H2, 10% glucose solution, initial volume: 20 mL,
20
The enhancement of the ethylene glycol production that is associated with the addition of greater amounts of AMT is inferior for reactions at higher temperatures. For instance, Figure 7 shows that reactions carried out at 220 °C have an increase of the glycolaldehyde concentration with higher AMT concentrations. Nonetheless, this augmentation does not represent a significant increase in the diol concentration when the equipment is operated at 260 °C. This result is due to the thermal side reactions of this compound, which are also enhanced by the heating of the chemical reactor. This aspect is more evident when the equipment is operated at this temperature since the aldehyde concentration is considerably lower than that of 220 °C. Hence, the glycol concentration is not significantly increased either.
Furthermore, Figures 6C and 6D show that the addition of AMT extends the limit reaction time at which the diol decomposition occurs, from 60 to 80 minutes, when the reaction is carried out at 260 °C. For this reason, this parameter must be mainly associated with the reaction temperature and the influence of the concentration of this catalyst on the reaction yields must be established according to the operating temperature (Figure 7). For example, Figure 7A shows that the hexitols production is reduced from 2.2% to only 0.6% with the addition of 0.06 g of AMT instead of 0.02 g at 260 °C. On the contrary, an operation at 220 °C reduces the hexitols yield from 21.6% to 7.9% with the same catalyst addition (Figure 7B). Finally, the evaluation of the yields obtained at 180 °C (Figure 7C) indicates that the increase of the ethylene glycol concentration is significant but insufficient since the change from 0.02 g to 0.10 g of AMT only represents an augmentation of 8.6% in the diol yield. These results allow concluding that the AMT concentration can be an important operating parameter only at intermediate temperatures (200-240 °C).
21
Figure 7. Influence of the mass of AMT on the reaction yields.
Conditions: Ru/AC 4% (0.3 g), 50 bar H2, 10% glucose solution, initial volume: 20 mL, feed
22
5.2.3 Mass of heterogeneous catalyst (ruthenium/activated carbon)
The influence of the heterogeneous catalyst is also considered in this study through the variation of the amount of Ru/AC initially preloaded in the chemical reactor. The effects of a variation of this operating parameter are correlated to the glucose and glycolaldehyde hydrogenation rates. This influence can be analyzed with the kinetic model if the variation of the catalyst concentration does not constitute significant changes in the solid’s dispersibility or the turbulence regime of the reactive mixture. In accordance with this statement, Figure 8 illustrates the concentrations of aldoses, hexitols and ethylene glycol that are obtained by varying the mass of Ru/AC between 0.1 and 0.5 g. The addition of higher concentrations of the heterogeneous catalyst has the opposite behavior to that observed with the increase of the AMT concentration (Figure 6Erreur !
Source du renvoi introuvable.). A decrease of the glycolaldehyde and aldehyde concentrations is observed in Figure 8A and 8B when the initial amount of Ru/AC is increased.
Figure 8. Influence of the mass of Ru/AC 4% on the concentrations in the liquid phase.
Conditions: AMT (0.06 g), 50 bar H2, 10% glucose solution, initial volume: 20 mL,
23
Moreover, the simulation results indicate how the Ru/AC concentration defines the influence of the reaction temperature. On the one hand, low Ru/AC concentrations determine the glycolaldehyde and glucose concentrations according to the reaction temperature. On the other hand, high Ru/AC concentrations do not generate significant changes in the concentrations of both aldoses when the reactor is heated in spite of the enhancement of the retro-aldol condensation. This result is due to the immediate hydrogenation of glucose and glycolaldehyde that overcomes the effect associated with the temperature change. This fact illustrates how the mass of Ru/AC preloaded in the equipment determines the transient concentrations of glycolaldehyde and glucose.
Figure 8A shows high accumulations of glycolaldehyde and glucose in the aqueous solution when only 0.1 grams of Ru/AC are preloaded in the system. Figure 8C indicates that the maximum ethylene glycol concentration that is obtained in the process corresponds to only 0.42 mol·L-1
(220 °C). This result allows establishing that a minimum amount of Ru/AC must be charged in the equipment in order to avoid an excessive glycolaldehyde accumulation. Indeed, an operation without the minimum amount of Ru/AC leads to greater yields of the thermal side reactions. Furthermore, Figure 8Erreur ! Source du renvoi introuvable.D illustrates the main issue that can be associated with an excess of the heterogeneous catalyst in the mixture. Despite the small variations of the glycolaldehyde and glucose concentrations during the reaction with an excess of Ru/AC, the ethylene glycol production has a transient behavior that depends on the Ru/AC concentration. Indeed, an operation at 260 °C enhances the diol production but increases its degradation rate after the limit reaction time. In addition, these operating conditions also define the greatest decrease of the ethylene glycol concentration after 70 minutes. On the contrary, an operation at 180 °C has a low time dependence due to the high selectivity to hexitols. Finally, the operation at 220 °C shows that the maximum ethylene glycol concentration that is evidenced in this study (0.93 mol·L-1 in Figure 8D) is obtained with the addition of 0.5 g of Ru/AC.
The behaviors observed with the addition of an insufficient and excessive amount of Ru/AC allow concluding that it is possible to define a set of operating conditions that maximize the ethylene glycol yield without compromising the reaction time. Figure 9 shows the reaction yields that can be obtained at different temperatures and Ru/AC concentrations. This chart shows that all the reaction yields increase by the addition of more Ru/AC to the mixture. For this reason, the mass of heterogeneous catalyst that is charged into the chemical reactor must be determined according to a previous setting of the reaction time and temperature. Firstly, Figure 9A shows that an operation at 260 °C that lasts 60 minutes must not be carried out with more than 0.1 g of Ru/AC because the methane yield can be greater than 5%. Secondly, Figure 9B shows that an operation at 220 °C allows increasing the mass of this catalyst until 0.4 g before reaching a hexitols yield over 10%. Finally, Figure 9C shows that an operation at 180 °C must not consider high Ru/AC concentrations because this variation only enhances the hexitols production.
24
Figure 9. Influence of the mass of Ru/AC 4% on the reaction yields.
Conditions: AMT (0.06 g), 50 bar H2, 10% glucose solution, initial volume: 20 mL,
25
6 Conclusions
The development of a combined kinetic model for the conversion of glucose into ethylene glycol allows analyzing the influence of its operating conditions on the reaction yields. For this purpose, the kinetic parameters of the hydrogenations rate-laws were adjusted to the temperature range that enhances the ethylene glycol production (180 °C - 240 °C). Subsequently, this numerical model was used to evaluate the glucose conversion and selectivity in a semibatch reactor. This analysis identified the relation between the operating conditions and the transient concentration profiles of the reagent and the main products of this chemical process.
Firstly, the kinetic model allows establishing that the reaction temperature defines not only the selectivity but also the time in which the maximum ethylene glycol concentration is obtained in the equipment. In accordance with these results, the operating temperature that is recommended for high selectivity to ethylene glycol must be set at 220 °C approximately. The operation at this temperature defines a period during which a maximum ethylene glycol yield can be obtained along with a low hexitols and methane production. This enhancement can be improved by adding greater concentrations of the homogeneous catalyst in the mixture. However, the selectivity of the process can be negatively affected by operations carried out for periods longer than this critical time.
Secondly, other parameters such as the hydrogen partial pressure and the Ru/AC concentration have an impact on the maximum ethylene glycol concentration that can be reached in the semibatch reactor and the maximum reaction time. For instance, an increase in the reaction rates can be achieved with higher hydrogen and Ru/AC concentrations. Nonetheless, glucose hydrogenation is enhanced in a greater proportion than that of glycolaldehyde hydrogenation. Therefore, a maximum level must be defined for these variables in order to avoid an excessive conversion of glucose into hexitols. These limit concentrations are determined by the other operating conditions of the chemical reactor.
In conclusion, the combination of the two distinct approaches in the kinetic model is an important step forward in the development of a more accurate model. This integration allows analyzing the influence of the hydrogen pressure and the catalyst concentrations on the reaction selectivity. Furthermore, a detailed description of the flow characteristics during the agitation process can contribute to the definition of the residence time through the analysis of phenomena such as liquid re-circulation or parabolic gas holdup. For this purpose, further stages of this study will focus on the flow characterization and the influence of the operating conditions on the segregation levels of the heterogeneous catalyst. In this manner, the model defines the main aspects that must be considered during the design of a unit that benefits from the conversion of non-alimentary glucose for the production of ethylene glycol.
7 Acknowledgement
Nicolas Godin, Isariebel Quesada and Laurence Llovera from the Industrial Company of Vegetable Matter (CIMV) and Idaline Chanteperdrix from the Laboratory of Coordination Chemistry (LCC) are gratefully acknowledged for their support and contribution to the development of this scientific study.
26
Symbols used
i
A
[mol-1· L-1·s-1] or [s-1] Pre-exponential factor of the chemical reaction in the power lawmodel
* 1
A
[min-1·(mol·m-3) -0.257] Corrected pre-exponential factor of the retro-aldol condensationrate law
AMT
C
[mol·m-3] AMT concentrationAMT,0
C
[mol·L-1] AMT concentration before the injection of the glucose solutionGlu0
C
[mol·L-1] Glucose concentration in the injection feedj
C
[mol·L-1] Concentration of the j compound in the chemical reactor'
j
C
[mol·m-3] Concentration of the j compound in the chemical reactori
a
E
[kJ·mol-1] Activation energy of the chemical reaction in the power lawequation 𝑖
F
[L·s-1] Glucose solution feeding ratei
k
[mol-1·L·s-1] or [s-1] Kinetic constant of the reaction 𝑖 (Power-law equation)AMT
K
[m3·mol-1] AMT adsorption equilibrium constant on Ru/ACGA
K
[m3·mol-1] Glycolaldehyde adsorption equilibrium constant on Ru/ACGA AMT
K
[m6·mol-2] GA-complexes adsorption equilibrium constant on Ru/ACGlu
K
[m3·mol-1] Glucose adsorption equilibrium constant on Ru/ACGlu AMT
K
[m15·mol-5] Glucose-complexes adsorption equilibrium constant on Ru/ACH
K
[bar-1] Dissociative hydrogen adsorption equilibrium constant on Ru/ACGlu
N
[mol] Number of glucose moles in the aqueous mixtureFeed Glu
N
[mol] Number of glucose moles in the injection feedH
P
[bar] Partial hydrogen pressureR
[kJ·mol-1·K] Ideal gas constanti
r
[mol·L-1·s-1] Rate of the reaction 𝑖27
t
[min] Integration timeV
[L] Liquid volume in the reactor0
V [L] Initial liquid volume in the reactor
rut
W [g] Mass of ruthenium catalyst
x
[—] Moles of by-products produced per mole of glucosey
[—] Moles of by-products produced per mole of glycolaldehydej
Y
[—] Yield of the compound j on the chemical reactions networkGreek letters
[—] Reaction order of the chemical reaction in the power law equation,ji
[—] Stoichiometric coefficient of the compound 𝑗 in the reaction 𝑖Sub- and Superscripts
AMT
Ammonium metatungstateH
Hydrogeni
Chemical reaction (𝑖 = 1 𝑡𝑜 7)j Compound (𝑗 = 𝐺𝑙𝑢, 𝐻𝑒𝑥, 𝐸𝑟𝑦, 𝐺𝐴, 𝐸𝐺, 𝐺-𝐵𝑦𝑃, 𝐺𝐴-𝐵𝑦𝑃, 𝐺𝑎𝑠)
(Glucose, hexitols, erythrose, glycolaldehyde, ethylene glycol, glucose by-products, glycolaldehyde by-products, methane)
References
[1] H. Yue, Y. Zhao, X. Ma, J. Gong, Chem. Soc. Rev. 2012, 41 (11), 4218–4244. DOI: 10.1039/C2CS15359A.
[2] S. Rebsdat, D. Mayer, in Ullmann’s Encyclopedia of Industrial Chemistry, Wiley-VCH Verlag GmbH & Co. KGaA, 2000, 531-546.
[3] G. Zhao, M. Zheng, R. Sun, Z. Tai, J. Pang, A. Wang, X. Wang, T. Zhang, AIChE J. 2017, 63 (6), 2072-2080. DOI: 10.1002/aic.15589.
[4] L. Chen, P. Guo, M. Qiao, S. Yan, H. Li, W. Shen, H. Xu, K. Fan, J. Catal. 2008, 257 (1), 172-180. DOI: 10.1016/j.jcat.2008.04.021.
[5] G. Zhao, M. Zheng, J. Zhang, A. Wang, T. Zhang, Ind. Eng. Chem. Res. 2013, 52 (28), 9566-9572. DOI: 10.1021/ie400989a.
[6] J. Pang, M. Zheng, R. Sun, A. Wang, X. Wang, T. Zhang, Green Chem. 2016, 18 (2), pp. 342-359, 2016. DOI: 10.1039/C5GC01771H.
[7] N. Déchamp, A. Gamez, A. Perrard, P. Gallezot, Catal. Today 1995, 24, 29-34. DOI: 10.1016/0920-5861(95)00019-C.
28
[8] J. Zhang, B. Hou, A. Wang, Z. Li, H. Wang, T. Zhang, , AIChE J. 2015, 61 (1), 224-238. DOI: 10.1002/aic.14639.
[9] P. J. C. Hausoul, A. K. Beine, L. Neghadar, R. Palkovits, Catal. Sci. Technol. 2017, 7 (1), 56-63. DOI: 10.1039/C6CY02104B.
[10] F. Schenck, in Ullmann’s Encyclopedia of Industrial Chemistry, Wiley-VCH Verlag GmbH & Co. KGaA, 2000, 45-66.
[11] J. Zhang, X. Yang, B. Hou, A. Wang, Z. Li, H. Wang, T. Zhang, Chin. J. Catal. 2014, 35 (11), 1811-1817. DOI: 10.1016/S1872-2067(14)60151-0.
[12] M. Sasaki, K. Goto, K. Tajima, T. Adschiri, K. Arai, Green Chem. 2002, 4 (3), 285-287. DOI: 10.1039/B203968K.
[13] Y. Liu, Y. Liu, Y. Zhang, Appl. Catal. B Environ. 2019, 242, 100-108. DOI: 10.1016/j.apcatb.2018.09.085.
[14] Y. Liu, C. Luo, H. Liu, Angew. Chem. Int. 2012, 51 (13), 3249-3253. DOI: 10.1002/anie.201200351.
[15] Y. Cao, J. Wang, M. Kang, Y. Zhu, J. Fuel Chem. Technol. 2016, 7 (44), 845-852. DOI: S1872-5813(16)30038-X.
[16] M. Zheng, A. Wang, J. Pang, N. Li, T. Zhang, in Reaction Pathways and Mechanisms in
Thermocatalytic Biomass Conversion I: Cellulose Structure, Depolymerization and Conversion by Heterogeneous Catalysts (Eds: M. Schlaf, Z. Zhang), Springer Singapore,
SIngapore 2016, Ch. 9.
[17] A. Aho, S. Roggan, O. A. Simakova, T. Salmi, D. Yu. Murzin, Catal. Today 2015, 241 (B), 195-199. DOI: 10.1016/j.cattod.2013.12.031.
[18] I. Delidovich, R. Palkovits, ChemSusChem 2016, 9 (6), 547-561. DOI: 10.1002/cssc.201501577.
[20] R. Bermejo-Deval, M. Orazov, R. Gounder, S.-J. Hwang, M. E. Davis, ACS Catal. 2014, 4 (7), 2288-2297. DOI: 10.1021/cs500466j.
[21] G. D. Zakumbaeva, L. A. Beketaeva, L. B. Shapovalova, React. Kinet. Catal. Lett. 1978, 8 (2), 235-240. DOI: 10.1007/BF02061311.
[22] E. Crezee, B. Hoffer, R. Berger, M. Makkee, F. Kapteijn, J. Moulijn, Appl. Catal. Gen. 2003, 251 (1), 1-17. DOI: 10.1016/S0926-860X(03)00587-8.
[23] J. Zhang, B. Hou, A. Wang, Z. Li, H. Wang, T. Zhang, AIChE J. 2014, 60 (11), 3804-3813.DOI: 10.1002/aic.14554.
[24] J. Wisniak, R. Simon, Ind. Eng. Chem. Prod. Res. Dev. 1979, 18 (1), 50-57. DOI: 10.1021/i360069a011.
[25] L. Červený, Catalytic hydrogenation, Studies in Surface Science and Catalysis, Vol. 27, Elsevier Science Publishers, Amsterdam 1986.
[26] R. Verma, J. K. Gehlawat, J. Chem. Technol. Biotechnol. 1989, 46 (4), 295-301. DOI: 10.1002/jctb.280460406.
[27] G. F. Froment, J. De Wilde, K. B. Bischoff, Chemical reactor analysis and design, 3rd ed., Wiley, Hoboken 2011.
[28] H. Fogler, in Elements of Chemical Reaction Engineering, Prentice Hall, Upper Saddle River 2005, 813-865.
[29] D. K. Mishra, A. A. Dabbawala, J. J. Park, S. H. Jhung, J.-S. Hwang, Catal. Today 2014, 232, 99-107. DOI: 10.1016/j.cattod.2013.10.018.
29
[30] V. Sifontes, O. Oladele, K. Kordás, K. Eränen, J. Mikkola, D. Murzin, T. Salmi, J. Chem.
Technol. Biotechnol. 2011, 86 (5), 658-668. DOI: 10.1002/jctb.2565.
Table captions
Table 1. T Simplified chemical reaction network of the catalytic conversion of glucose to ethylene
glycol [21].
Table 2. Parameters of the power law models [21], [23].
Table 3. Parameters for the equilibrium adsorption constants in the presence of AMT [8]. Table 4. Estimated parameters for the equilibrium adsorption constants in presence of AMT
(temperatures between 180 °C and 260 °C).
Table 5. Comparison of the yields estimated with the adapted kinetic model and the experimental
data [21].
Figure captions
Figure 1. Simplified reaction network [21].
Figure 2. Scheme of the semi-batch reactor and the solution injection system.
Figure 3. Comparison of the aldose concentrations predicted with the hydrogenation models in a
batch reactor.
Figure 4. Influence of the hydrogen pressure on the concentrations in the liquid phase.
Conditions: AMT (0.06 g), Ru/AC 4% (0.3 g), 10% glucose solution, initial volume: 20 mL, feed flowrate: 0.667 mL.min-1, reaction time: 120 minutes.
Figure 5. Influence of the hydrogen pressure on the reaction yields.
Conditions: AMT (0.06 g), Ru/AC 4% (0.3 g), 10% glucose solution, initial volume: 20 mL, feed flowrate: 0.667 mL.min-1, reaction time: 60 minutes.
Figure 6. Influence of the mass of AMT on the concentrations in the liquid phase.
Conditions: Ru/AC 4% (0.3 g), 50 bar H2, 10% glucose solution, initial volume: 20 mL,
feed flowrate: 0.667 mL.min-1, reaction time: 120 minutes. Figure 7. Influence of the mass of AMT on the reaction yields.
Conditions: Ru/AC 4% (0.3 g), 50 bar H2, 10% glucose solution, initial volume: 20 mL, feed
flowrate: 0.667 mL.min-1, reaction time: 60 minutes.
Figure 8. Influence of the mass of Ru/AC 4% on the concentrations in the liquid phase.
Conditions: AMT (0.06 g), 50 bar H2, 10% glucose solution, initial volume: 20 mL,
feed flowrate: 0.667 mL.min-1, reaction time: 120 minutes.
Figure 9. Influence of the mass of Ru/AC 4% on the reaction yields.
Conditions: AMT (0.06 g), 50 bar H2, 10% glucose solution, initial volume: 20 mL,
feed flowrate: 0.667 mL.min-1, reaction time: 60 minutes. Entry for the Table of Contents
30
Type of Article: Table of Contents text.
Title
A. Author, B. Author, C. Author*
Chem. Eng. Technol. 20XX, XX (X),
![Table 1. T Simplified chemical reaction network of the catalytic conversion of glucose to ethylene glycol [21]](https://thumb-eu.123doks.com/thumbv2/123doknet/13660101.429434/6.892.112.799.118.550/simplified-chemical-reaction-network-catalytic-conversion-glucose-ethylene.webp)
![Table 2. Parameters of the power law models [21], [23].](https://thumb-eu.123doks.com/thumbv2/123doknet/13660101.429434/7.892.106.798.607.854/table-parameters-power-law-models.webp)
![Table 3. Parameters for the equilibrium adsorption constants in the presence of AMT [8]](https://thumb-eu.123doks.com/thumbv2/123doknet/13660101.429434/10.892.110.780.116.342/table-parameters-equilibrium-adsorption-constants-presence-amt.webp)
![Table 5. Comparison of the yields estimated with the adapted kinetic model and the experimental data [21]](https://thumb-eu.123doks.com/thumbv2/123doknet/13660101.429434/13.892.107.810.983.1161/table-comparison-yields-estimated-adapted-kinetic-model-experimental.webp)