PROVIDERS AND TARIFF PLANS
Price Index Concepts for Mobile Communication, Public
Transport and Basic Services in Switzerland
Thesis
presented to the Faculty of Economics and Social Sciences at the University of Fribourg (Switzerland)
by
Lukas Seger
from Gottlieben (TG)in fulfillment of the requirements for the degree of Doctor of Economics and Social Sciences
Accepted by the Faculty of Economics and Social Sciences December 15th, 2014 at the proposal of
Prof. Dr. Reiner Eichenberger (first supervisor) and Prof. Dr. Bruno Jeitziner (second supervisor)
The Faculty of Economics and Social Sciences of the University of Fribourg (Switzerland) does not intend either to approve or disapprove the opinions expressed in a thesis: they must be considered as the author’s own (decision of the Faculty Council of 23 January 1990).
Abstract
Providers of widely used services offer various tariff plans to consumers, such as different cell phone contracts for mobile communication or train tickets for public transport services. The service prices are thus dependent not only on the consumption but also on the underlying tariff plan. Comparisons of these service prices are commonly biased because tariff plans are not implemented correctly.
This thesis offers new concepts to compare service prices among providers and time periods. Since tariff plans and data structures are unique in most services, customised approaches are required. For mobile communication, a hedonic price index based on monthly bills is employed. The price development in public transport is measured by average travelled kilometers. Basic service prices across municipalities are compared via household consumption profiles. The concepts are motivated practically, described formally and illustrated em-pirically.
A lot of different people were involved in the creation of this thesis. I am very grateful for their support and want to thank them all, including those I do not mention explicitly by name.
In late 2011, Prof. Dr. Reiner Eichenberger accepted me without hesitation as a Ph.D. student, which I appreciated greatly. In his creative and very supportive manner, he immediately suggested the analysis of mobile communication and government service prices. The third topic was healthcare prices. But because many of my family members are medical professionals, I could not address that one without rocking the boat. Therefore, the existing project about public transport was included. I also want to thank Prof. Dr. Bruno Jeitziner for being a second advisor, as well as Prof. Dr. Mark Schelker for presiding over the jury.
Special thanks goes to two women. Helga Kahr offered me incredible help with the management of the data sampling from phone bills and was always an excellent secretary for our chair. AnneMarie O’Neill proofread the first version of the thesis perfectly, despite being challenged constantly by my ’Swiss English’.
In all projects third persons, companies and institutions were involved who supported me a great deal. I want to thank comparis.ch very much for the data, especially Ralf Beyeler, for being a discussion partner for mobile communication issues; the Swiss price control for the data, and Jörg Christoffel and Andrea Friedrich for explaining it to me; the Swiss Federal Railways for the entire project, and namely Stephan Osterwald and Sean Schwegler for their support; Lukas Rühli from Avenir Suisse for discussing institutional competencies in cantons; Prof. Dr. Andreas Ladner from the University of Lausanne for the
v data about parliaments; and finally, the Federal Office of Communications, namely René Dönni and Simona Schmid for giving helpful hints.
I also owe gratitude to the academics who were involved in the creation of this thesis. Prof. Dr. Klaus Neusser, Prof. Dr. David Stadelmann, Dr. Thomas Epper, Dr. Olivier Schöni, Severin Bernhard, Eva Spring and Daniel Suter contributed valuable ideas and comments to the thesis. In particular, Dr. Marco Portmann supported me with excellent suggestions in the final writing process. I also profited greatly from the education I received through the program for beginning doctoral students at the Study Center Gerzensee, provided by the Swiss National Bank. There, on top of the academic benefits, the rivalry between the cantons of Berne and Fribourg began to be, and still is, celebrated by Jass challenges. I want to condole with Dr. Jan Imhof and Thierry Graf from the ’Big Bad Jassers Berne’ for being continuously defeated. I want to especially thank Vincent Pochon for being an accomplished Jass partner, very good colleague and, together with Diana, Moumoute and Biloute, a great host over the past few semesters.
This thesis could have never been completed without my family. I thank my parents Brigitte and Rolf for an amazing childhood, which is sadly about to end, for financing all of my ’academic’ adventures and pushing me in the right directions when needed. While writing this thesis, I could always count on the love and support from Sereina. Writing was made easy when I knew that I could go home in the evening and she would be there. I also want to thank her parents, Lis and Christof, for always being so welcoming and for the uncountable outdoor activities we did together.
Finally, I am very grateful to Prof. Dr. Hans Wolfgang Brachinger, who pro-vided me the possibility of writing a thesis in the first place. I will never forget his unique, sincere and challenging nature.
Fribourg, July 2014 Lukas Seger
Abstract iii
Acknowledgements iv
Contents vi
List of Tables ix
List of Figures xi
1 Comparing Service Prices among Providers and Tariff Plans 1
1.1 General introduction and motivation . . . 1
1.2 Thesis outline . . . 6
2 Hedonic Price Indexes for Mobile Communication Services 12 2.1 Comparing communications service providers . . . 12
2.2 Hedonic price index concept . . . 16
2.2.1 General approach and the hedonic function . . . 17
2.2.2 Model specifications for the hedonic function . . . 20
2.2.3 Hedonic price indexes . . . 24
2.2.4 Comments on the indexes . . . 30
2.3 Empirical applications . . . 31
2.3.1 Data . . . 32
2.3.2 Model estimation and performance . . . 39
2.3.3 Constructing hedonic price indexes . . . 54
2.3.4 The influence of the consumers’ age . . . 60
2.4 Summary . . . 63
2.4.1 Results . . . 63 vi
CONTENTS vii
2.4.2 Outlook . . . 66
2.4.3 Manual . . . 69
3 Kilometer Price Index for Public Transport 73 3.1 Tariff plans in Swiss public transport . . . 73
3.2 Price index concept for an averagely travelled kilometer . . . . 75
3.2.1 Desired attributes of the index . . . 75
3.2.2 Adjusting a Laspeyres price index to tariff plans . . . . 77
3.2.3 The kilometer price index . . . 79
3.3 SBB passenger traffic price development . . . 81
3.3.1 Data . . . 81
3.3.2 Price development from 2007 to 2011 . . . 82
3.3.3 Comparison to tariff-based indexes . . . 83
3.3.4 The ’GA travelcard’ and ’Normal tariff’ ticket types . 85 3.4 Summary . . . 88
4 Administered Prices of Basic Services in Swiss Municipalities 90 4.1 Introduction to administered prices of basic services . . . 90
4.2 Price index concept for Swiss municipalities . . . 95
4.2.1 Selection and description of services . . . 96
4.2.2 Households, consumption profiles and service prices . . 98
4.2.3 Administered price index for basic services . . . 101
4.3 Empirical analyses of administered prices . . . 105
4.3.1 Data . . . 105
4.3.2 Absence of economies of scale . . . 110
4.3.3 Relation to tax rates and rents . . . 116
4.3.4 Institutional influence on price levels . . . 121
4.3.5 No sign of capitalisation in rents . . . 127
4.4 Summary and outlook . . . 131
4.4.1 Summary . . . 132
4.4.2 Fiscal competition through administered prices? . . . . 134
4.4.3 Cost-of-living index for Swiss municipalities . . . 136
5 General summary 139 5.1 Key results . . . 139
A Appendix 146
A.1 Mobile communication . . . 147
A.1.1 Average unit prices and the constant . . . 147
A.1.2 Comparison to official statistics . . . 155
A.2 Administered prices . . . 160
A.2.1 API for 324 municipalities . . . 160
A.2.2 Tables and figures . . . 166
List of Tables
1.1 Thesis outline . . . 8
2.1 Indexes with base period t . . . 28
2.2 Indexes with base period 0 . . . 29
2.3 Number of observations per quarter and provider . . . 33
2.4 Bills data . . . 35
2.5 Consumption behaviour and phone data . . . 38
2.6 Specifications with single consumption variables . . . 42
2.7 Specifications with grouped consumption variables . . . 46
2.8 Removing influential observations, grouped variables . . . 49
2.9 Removing influential observations, single variables . . . 51
2.10 Model estimation for index construction . . . 55
2.11 Indexes with base period t . . . 58
2.12 Indexes with base period 0 . . . 59
2.13 Impact of age on the invoiced amount . . . 61
3.1 SBB price development compared to prior year and CPI . . . . 84
4.1 Standard households and consumption profiles . . . 99
4.2 Summary statistics for the API 2012 . . . 102
4.3 Correlations between service prices . . . 104
4.4 Explanatory variables for municipalities in 2012 . . . 107
4.5 Agglomeration size index . . . 108
4.6 Absence of economies of scale . . . 113
4.7 The relation to tax rates and rents . . . 118
4.8 Institutional control of administered prices . . . 124
4.9 Capitalisation of administered prices . . . 129
A.1 Indexes with base period t . . . 149
A.2 Indexes with base period 0 . . . 149
A.3 Specifications with single consumption variables . . . 150
A.4 Specifications with grouped consumption variables . . . 151
A.5 Removing influential observations, grouped variables . . . 152
A.6 Removing influential observations, single variables . . . 153
A.7 Model estimation for index construction . . . 154
A.8 Complemented consumption profiles . . . 156
A.9 Profile-specific model estimation . . . 157
A.10 Predicted invoiced amounts in CHF, profile-specific prices . . 158
A.11 Predicted invoiced amounts in CHF, constant unit prices . . . 159
A.12 Complete API . . . 160
A.13 Economies of scale with modified specification . . . 168
A.14 Economies of scale dependent on topography . . . 169
A.15 Economies of scale and regions . . . 170
A.16 Tax rates and rents, controlled for scale effects . . . 171
A.17 Tax rates, rents and regions . . . 172
A.18 Tax rates and rents, robust for cantonal clusters . . . 173
A.19 Single institutions . . . 174
A.20 Institutional control in regions . . . 175
A.21 Institutional control and topography . . . 176
A.22 Institutional control, robust for cantonal clusters . . . 177
A.23 Capitalisation with different construction indicators . . . 178
List of Figures
1.1 The problem of multiple tariff plans per provider . . . 3
1.2 Determining the implicit service price of a provider . . . 5
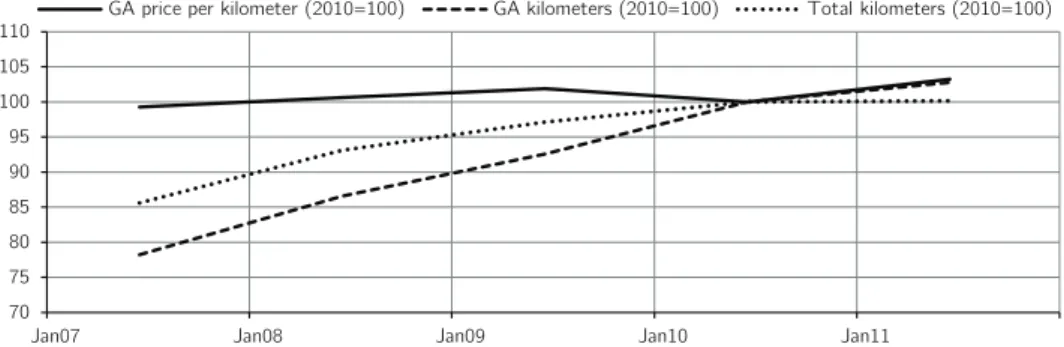
3.1 SBB price development, 2007 - 2011 . . . 83
3.2 The GA travelcard in the KMI . . . 86
3.3 The normal tariff tickets in the KMI . . . 87
4.1 API distribution within and across cantons . . . 103
A.1 Service price frequencies . . . 166
A.2 Service price distributions within and across cantons . . . 167
Comparing Service Prices
among Providers and Tariff
Plans
1.1
General introduction and motivation
The real income of consumers, and consequently their consumption and wealth, are influenced by prices. Likewise, firms’ profits depend on prices. Especially in monopolistic or oligopolistic competition, firms tend to have price-setting power. This is particularly unfavourable for consumers, but is also a prob-lem for the entire allocation. The markets of numerous important services such as, for example, mobile communication or public transport, are not per-fectly competitive. For that reason, prices are monitored and compared among service providers by governments, independent regulators and other organisa-tions.
Prices of goods are measured or compared among providers via price indexes. Especially when prices for ’complex’ services are analysed, these indexes usu-ally have one issue in common: tariff plans. The tariff plans of the services analysed in this thesis and the resulting issues for price statistics are illus-trated below. First and most importantly, if there are different tariff plans, consumers can choose how to pay for a service. This results in different prices for the same service. Consider, for example, fare systems in public
CHAPTER 1. COMPARING SERVICE PRICES AMONG PROVIDERS 2 port. A consumer can decide how to pay for a journey. The consumer may pay for one or multiple journeys with a travelcard or single tickets. Depend-ing on the chosen tariff plan, the price paid for each journey is different. A second example is mobile communications services. Multiple providers offer different telecommunication tariffs or contracts to consumers. The price for mobile communication services, which for consumers is the monthly invoiced amount, is not only dependent upon the consumption of multiple units, such as minutes called, text messages sent or data used. The specifications of the selected contract influence the price as well. Prices that result from tariff plans are therefore not only dependent upon the consumption of service units, but also on contract specifications. The third example is prices for basic services, such as water supply, electricity or waste management. In this case, it is not only a few providers, but all municipalities that may offer proper tariff plans, which requires efficient methods for comparing prices. Generally, tariff plans are in use for a large number of services. Their diversity and complexity pose problems for price comparisons.
To compare service prices resulting from tariff plans among providers, inde-pendent regulators or organisations such as the Organisation for Economic Co-operation and Development (OECD) currently use methods based on con-structed consumption profiles. Usually, a few profiles for different consumption intensities, such as small, medium or large, are defined. In these constructed profiles, quantities for several consumed service units, such as the number of calls or text messages, are specified. Then, the price to be paid for each pro-file and provider is determined. Thus, service prices for different, standardised consumption intensities are compared among providers. Fixed, standardised profiles are used because observed service prices of different consumers and providers cannot be compared directly. Different quantities of consumed units result in incomparable service prices. Similarly, standard price index formulas, which use quantities and unit prices, can hardly be applied. Implicit unit prices cannot be deducted directly from tariff plans. Normally, only explicit marginal unit prices are directly observable. For example, while the explicit marginal price per additional minute called is indicated in the contract, it is not the implicit unit price paid. The effective or implicit unit price is dependent upon the specifications of the tariff plan (for example, fixed cost or flat rates), as well as the consumption of other units.
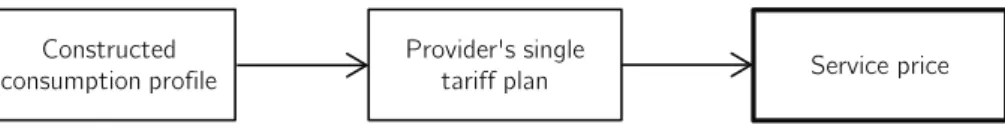
The application of consumption profiles to compare service prices among providers poses several problems. First and most importantly, the presence of multiple tariff plans per provider is crucial. As long as one single tariff plan per provider exists, one unique service price per profile and provider can be determined. As soon as a provider offers multiple tariff plans for one service, it is not unambiguously clear which tariff plan should be chosen to determine the service price for a profile. Therefore, several possible service prices per provider and constructed consumption profile exist, as illustrated in figure 1.1. Hypotheses about consumer behaviour must be made in order to select one tariff plan to determine the service price to be compared. In the case of mo-bile communication prices, for example, the OECD suggests that one should always select the contract that minimises the price per profile and provider. This method implies rational and perfectly informed consumers. It is not clear at all if consumers really possess these optimal contracts for their individual profiles. Price indexes and comparisons should reflect the prices paid in the real world, and not those which are theoretically optimal.
Figure 1.1: The problem of multiple tariff plans per provider
Provider's single
tariff plan Service price
Provider's multiple tariff plans
Single tariff plan, unique service price per profile
Multiple tariff plans, different possible service prices per profile
Multiple possible service prices Constructed consumption profile Constructed consumption profile
Besides the central issue of multiple tariff plans, comparing service provider prices with consumption profiles poses additional problems. The four major problems are listed below:
• Tariff plans may contain a large number of specifications. Consider, for example, discounts for students or young people on public transport or mobile communication. Consumption profiles usually don’t specify the age of consumers. Therefore, the prices actually paid by a large number
CHAPTER 1. COMPARING SERVICE PRICES AMONG PROVIDERS 4 of consumers cannot be determined accurately by profiles.
• It is impossible to reflect a complete consumption distribution with only a few profiles. A service may contain different units, such as in mobile communication minutes, text messages or megabytes all of which have to be specified. With, for example, three profiles, only a few specific consumption patterns can be considered.
• As for most other price indexes, adjusting prices to account for service quality is difficult. Again, profiles become too complex and specific if different quality levels are specified.
• Service providers may adapt their tariff plans to the profiles if they are announced in advance and not changed frequently.
For these reasons, using consumption profiles to compare provider prices result-ing from tariff plans is not a satisfyresult-ing approach. Nevertheless, service-specific technical manuals from independent regulators, statistical organisations or of-fices predominantly suggest the application of profiles; see, for example, OECD (2010) for mobile communication or Federal Electricity Comission (2012) and Price Control (2012) for basic services in municipalities. On the other hand, the general problems for price statistics caused by tariff plans are rarely dis-cussed. Tariff plans have very distinct characteristics across different ser-vices, so it is difficult to suggest general solutions. All service prices analysed in this thesis are included in consumer price indexes (CPI) through elemen-tary indexes in the lower levels of aggregation. In the CPI manual of the International Labour Office (2004) - which is one of the major manuals in price statistics - problems related to tariff plans for mobile communication ser-vices are identified. Possible solutions, such as using profiles, comparing unit prices or sampling phone bills, are briefly mentioned, but not specified. In the rather theoretical general price statistics literature, tariff plans are not men-tioned, e.g. Diewert (2002). The issue is also too specific for statistical text books and therefore not contained, e.g. Fahrmeir et al. (2007). The (scien-tific) literature research indicates that tariff plans are analysed in other fields, for example, in marketing or microeconomics, with a focus on consumer be-haviour. However, as the central issue of this thesis is to measure and compare service prices among different providers, this literature is not described here.
Service-specific literature is introduced in the corresponding chapters.1
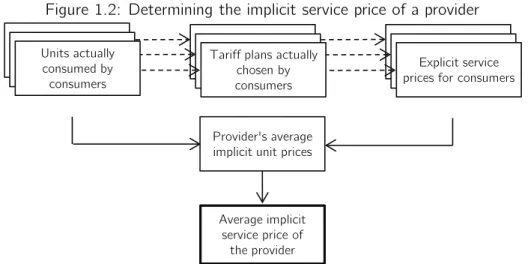
The contribution of this thesis is to present and apply alternative methods for comparing provider prices that result from tariff plans accurately. The general approach is to evaluate observed service prices with regard to the correspond-ing consumption. To this end, observed explicit service prices as they are paid by consumers are evaluated according to the units of a service actually con-sumed. As a result, implicit unit prices are obtained, as illustrated in figure 1.2. When implicit unit prices can be estimated, nearly every statistical method is applicable to weight and aggregate them to obtain an average implicit service price for a provider. Finally, this average implicit service price reflects the av-erage price paid with respect to actual consumption. To sum up, the central difference with the profile method is that it allows evaluating explicit service prices according to actually consumed units, instead of determining hypothet-ical service prices with the help of constructed consumption profiles and tariff plans.
Figure 1.2: Determining the implicit service price of a provider
Units actually consumed by consumers
Tariff plans actually chosen by consumers
Explicit service prices for consumers
Provider's average implicit unit prices
Average implicit service price of
the provider
At first glance, it may seem that not including tariff plans in the price compari-son is a loss of information. However, in the end, there is no need to implement the complex and diverse tariff plans directly. Tariff plans are still incorporated 1The literature researches were carried out on ideas.repec.org, webofknowledge.com
and scholar.google.com with a wide variety of keywords and the corresponding combina-tions. General keywords were for example ’price’, ’price statistics’, ’price index’, ’tariff’, ’tariff plan’, ’tariff scheme’, ’price plan’, ’price comparison’, ’provider’, ’service’, ’service provider’, ’service price’ etc.
CHAPTER 1. COMPARING SERVICE PRICES AMONG PROVIDERS 6 indirectly in the observed, explicit service prices needed to estimate implicit unit prices. No hypothesis about consumer behaviour is required to select the optimal tariff plan. Because all consumption (or at least an estimation of it), and not only a few constructed profiles, are considered, a provider’s average service price can be determined accurately. In addition, there is no utility for providers to adapt tariff plans to the consumption profiles of statistical of-fices. As a result, the suggested methods allow to compare provider prices much more precisely than with constructed consumption profiles. In contrast with the profile method, all and, more importantly, different tariff plans can be implemented consistently.
This thesis suggests and applies three different methods to compare prices from different providers and tariff plans. They are applied to mobile communi-cation, public transport and basic service prices in Swiss municipalities. All of these services are frequently purchased by most households and therefore have a certain relevance. Firstly, mobile communication services are purchased by most citizens. The tariff plans are complex, especially when analysed as ag-gregates of providers. Secondly, public transport prices are not only relevant to consumers, but also in politics. The whole infrastructure is dependent upon government subsidies. Hence, prices for consumers are influenced by fiscal decisions. Finally, basic services, like electricity, water supply and waste management, are consumed by all households. Administered prices for basic services are rarely analysed in the literature. For all services mentioned above, markets are not perfectly competitive or even regulated. In the latter case, markets are influenced by politics or governments. Consumers are a weak col-lective in the political process as stated by Olson (1965). In this light, prices should be monitored even more intensively. The aim of this thesis is to of-fer alternative and consistent price index concepts to compare services prices among different providers and tariff plans.
1.2
Thesis outline
To address the problems that emerge with the use of consumption profiles, this thesis offers and applies service-specific index concepts. Analysed tariff plans, suggested index concepts and empirical applications for each field are
intro-duced in the second section of the general introduction. They are summarised in table 1.1. For every service, prices are measured and analysed with a partic-ular, independent approach. In chapter 2, hedonic price indexes are introduced for mobile communication services. In chapter 3, a Laspeyres-type price index is suggested to evaluate public transport price development. Chapter 4 con-tains a profile-based index for basic service prices in Swiss municipalities. The most important findings of each project, the issues to be addressed in further research and general insights are summarised in chapter 5.
The concepts for mobile communication and public transport are new applica-tions based on already existing, but greatly modified index concepts. Contrary to the profile approach, both are able to provide precise and theoretically un-biased estimators for provider prices. Both concepts require very high data quality to perform well. Contrariwise, the profile approach for basic services in municipalities does not. Service prices for specific consumption profiles can more easily be collected. Here, consumption profiles can be applied because for basic services, there is only one tariff plan per municipality and service. The contribution of the last chapter lies in the fact that the prices of multi-ple services are compared jointly. In addition, the magnitudes of the prices are analysed and partially explained by several relevant municipality characteristics, such as tax rates and rents.
Each chapter is divided into four sections: 1 introduction, 2 index concept, 3 empirical application or analysis and 4 summary. The tariff plans analysed, new price index concepts introduced and the empirical applications of each chapter are summarised below.
Mobile Communication
Tariff plans are offered by communications service providers to consumers in the form of mobile communication contracts. These contracts differ widely. Fixed cost, flat rates, marginal cost, discounts for special groups of consumers or discounts on the price of mobile phones are just some specifications. The OECD method presently used compares minimal cost contracts for fixed con-sumption profiles among providers. This method is not capable of including most specifications of tariff plans, which results in overly simplified and biased price comparisons.
C H A P T E R 1. C O M P A R IN G S E R V IC E P R IC E S A M O N G P R O V ID E R S 8
Table 1.1: Thesis outline
Chapter / Content Tariff plans Price index concept Empirical analysis 2 Mobile Communication - Service providers’ mobile
com-munication contracts
-Contracts transform consumed units into invoiced amounts
-Hedonic price indexes (double-imputation, chaining)
-Price for average, aggregate con-sumption
-Price comparison of mobile com-munications service providers -Data: 415 phone bills from 2012 and 2013 (Swisscom, Orange) -Basic evaluation of model speci-fications and indexes
3 Public Transport -Tickets and travelcards of trans-port companies and tariff unions -Identical trips can be purchased with different tickets
-Laspeyres-type price index -Price development of an aver-agely travelled kilometer
-Analysis of SBB price develop-ment from 2007 to 2011
-Data: Aggregates of kilometers and revenue per ticket type -Comparison to ticket based price indexes
4 Basic Services -Municipality-specific tariffs for basic services
-Electricity, waste management, water supply and sewer water
-Price index based on household consumption profiles
-Price level for a representative household
-Service price comparison across the 324 largest Swiss municipali-ties in 2012
-Data: Service prices for three standard households
-Focus on economies of scale, tax rates, rents, institutional control and capitalisation
To address this issue, hedonic price indexes are introduced to adjust prices for consumed services. Hedonic price indexes are generally used to adjust prices for quality, predominantly for housing, but also for technology goods. Here, they are modified to adjust explicit service prices to actually consumed units. The hedonic model is based on data from phone bills, which contain explicit prices (monthly invoiced amounts) and consumed quantities of units, such as minutes called, text messages sent and data used. Monthly invoiced amounts are evaluated according to observed consumption. More precisely, implicit unit prices for minutes, text messages and data are estimated by regressing the invoiced amount on these units. Then, based on the implicit unit prices, invoiced amounts for the average consumption of different providers can be predicted and then be used to compare aggregated service prices. The theo-retical section is mainly about how to specify the hedonic function and which index formula best fits this case. The hedonic approach solves nearly all of the problems inherent in the use of consumption profiles. Most importantly, no as-sumptions about consumer behaviour have to be made. As a result, real-world prices are compared.
In the empirical section, the method is illustrated using data from 415 phone bills. Model specifications are estimated by different methods, and indexes are subsequently constructed. Because the sample contains only phone bills from employees and students of the University of Fribourg, the results are not representative for Switzerland. However, this first application provided a great deal of theoretical and practical insights about hedonic price indexes for mobile communication services. Interestingly, the obtained results contradict the official statistics, according to which Orange is cheaper than Swisscom, especially for small consumption profiles. If this difference is caused by the non-representative sample or, if tariff plan specifications, such as student dis-counts, do influence implicit unit prices so strongly is an open question for further research. However, it is shown unambiguously that mobile commu-nication prices cannot be measured and compared accurately through a few consumption profiles.
Using hedonic price indexes to compare service prices from tariff plans is a very promising alternative to consumption profiles. Besides the fact that the re-sulting implicit service prices are adjusted to consumption, a hedonic approach also allows additional analyses of service prices, as demonstrated at the end
CHAPTER 1. COMPARING SERVICE PRICES AMONG PROVIDERS 10 of the empirical section.
Public Transport
The third chapter is about public transport fares or prices. Consumers can pay for their trips with single tickets, travelcards or a combination of both. The very extreme case is the GA travelcard (Generalabonnement, abonnement général) which is a flat-rate tariff. In this tariff plan, there is no relation between price and consumption. Measures currently used to describe price development in public transport are based on tickets and consequently on tariff plans. Given the importance of public transport in Switzerland, which shows an increasing demand (number of kilometers travelled) and increasing explicit ticket prices, an index that reflects implicit prices is needed.
As a solution, a modified Laspeyres price index is suggested. Kilometers trav-elled are used as basic goods, instead of tickets or travelcards. Based on revenue and the aggregated kilometers travelled with a specific ticket type, the average price per kilometer travelled can be determined. The resulting index describes the price development of an average travelled kilometer and reflects several important issues, such as increasing consumption.
The data to illustrate this index concept are provided by the Swiss Federal Railways (SBB, CFF). Revenue and kilometers travelled per ticket type are the basic variables. They describe monthly aggregates for the SBB from 2007 to 2011. With this data, the price development of an average SBB-kilometer from 2007 to 2011 is described. Compared to given price indexes, which are based on ticket prices, price increases are estimated to be significantly lower. In years without any tariff changes, the estimated implicit service prices may even fall, which is never indicated by existing indexes, which use the explicit prices of tickets and travelcards.
Basic services in Swiss municipalities
Prices for electricity, water supply, sewer water and waste management services are analysed in the fourth chapter. The prices for these services are admin-istered on a municipal level and differ quite a bit. Two major contributions
are proffered through this analysis. First, based on data from the Swiss Price Control and the Federal Electricity Commission, an index that describes prices for multiple services, and not only a single service, is constructed. Although it is based on consumption profiles, thus far it represents the best way to anal-yse basic service prices in Swiss municipalities. Secondly, an analysis of basic service prices corresponds to the household perspective on user charges and consequently a part of non-tax government revenue. If user charges are anal-ysed in the literature, then they are mostly implemented as aggregates, which does not necessarily reflect the effective burden of households. By analysing service prices as they are paid by households, findings about user charges can be discussed and verified from an alternative perspective.
The indexes for administered prices estimate the total and individual cost for all selected services in a municipality. The cost for a representative Swiss house-hold is approximated by using three different househouse-hold consumption profiles. Consumption profiles can be used in this case because, for most services, there is only one tariff plan per municipality. The structure of this chapter differs slightly from the others. The empirical results of the indexes have already been presented in the second section, along with the index concept. Service prices from 2012 are analysed descriptively across the 324 largest municipalities in Switzerland. For the identical set of services, the aggregated administered price in the most expensive municipality (Le Locle) is approximately 2.5 times higher than in the least expensive municipality (Lugano).
An attempt to provide economic explanations for service price differences across municipalities is made in the empirical section. In a cross-sectional analysis, the administered price indexes are related to different municipality characteristics like those generally used in public economics. The most robust result is that tax burden and administered prices are related positively across municipalities. Municipalities with high tax rates have typically higher (admin-istered) service price levels. Another, but not highly robust, result is that, in cantons with strong finance commissions, service prices are lower. No evi-dence is found for capitalisation of service prices in rents. Economies of scale with respect to population and agglomeration size are not present in service prices.
Chapter 2
Hedonic Price Indexes for
Mobile Communication
Services
In chapter 2, hedonic price indexes are introduced to compare communications service providers. A sample consisting of 415 bills is used to illustrate the indexes.
After an introduction to mobile communication in Switzerland and the presently used method to measure prices in section 2.1, the hedonic model and indexes are created in section 2.2. The method is applied in section 2.3. Section 2.4 consists of a summary, an outlook and a discussion of practical issues.
2.1
Comparing communications service providers
Prices for mobile communication services vary significantly across countries, providers and individual consumers. Providers compete mainly by offering dif-ferent contracts or tariff plans to consumers. Consumers try to minimise mo-bile communication cost. They choose a provider and contract accordingly. However, these contracts usually include a large number of specifications that cannot be fully addressed through price comparisons.
Price comparisons between different providers are usually made by independent 12
regulators, statistical offices or private companies. They are even more com-plex than the comparisons of single tariff plans as done by consumers. Commu-nications service providers offer entire systems of tariff plans, different service qualities and also different levels of customer care. By introducing hedonic price indexes for mobile communication, this analysis provides a convincing and - compared to current price comparisons - more accurate method.
In Switzerland, the Federal Office of Communications is both, regulator and the statistical authority for mobile communication services. The price compar-isons of the Federal Office of Communications (2013) base on recommenda-tions of the OECD (2010) to use so-called ’minimal cost consumption profiles’. More concretely, three basic profiles for small, medium and strong consump-tion are constructed. For all three profiles and for every provider, the monthly minimal cost tariff plan or contract is selected for comparison.2 Minimal costs are compared because multiple tariff plans per provider exist, and one must be selected for each profile. Therefore, prices are compared as if consumers always used the tariff plan with the lowest cost. If consumers were rational, perfectly informed and completely flexible in their choice of contract, consump-tion profiles could be applied in this way. However, this is not the case. First and most importantly, consumers are not necessarily perfectly rational in terms of minimising their communication cost. For example, discounts on phone prices for subscribing a new contract are often more important in their selection of a certain tariff plan than the expected total communication cost. Secondly, the complete information hypothesis is violated because people do not know ex ante their own consumption. Consumption cost is not only de-pendent upon consumed units, but also upon the specifications of the contract or tariff plan. It is very difficult for consumers to pay attention to all specifi-cations, like flat rates or discounts received for subscribing. The minimal cost approach neither verifies that consumers are well informed by the provider so that they can effectively select the lowest cost tariff plan for their consump-tion. Thirdly, consumers cannot switch between providers flexibly. A minimal contract duration of one or two years is standard. Additionally, consumers are often faced with rollover contracts, which are automatically extended af-2Minor method changes were implemented in November 2013, which were motivated by
new recommendations from the OECD (2012). The major change was the addition of data traffic to the profiles.
CHAPTER 2. MOBILE COMMUNICATION 14 ter the basic duration, unless explicitly terminated. Changing contracts with a specific provider is usually possible, but only if a more expensive contract has been chosen. Besides the three principle problems discussed, the Federal Office of Communications has identified other problems with the minimal cost approach:
• All special services such as, for example, roaming packages, cannot be implemented.
• Price discounts on phones that are given for subscribing a contract are not considered.
• Demographic discounts such as, for example, for students, cannot be considered.
• Network quality and coverage are not included.
The method used by the Federal Office of Communications is a simple way to create a price comparison, but it neglects major aspects of mobile commu-nication tariffs. The greatest obstacles to develop the profile approach to an accurate method are the quickly changing, complex and diverse tariff plans. A method that is independent of tariff plans solves most of these problems. This is why hedonic price indexes can significantly improve price comparisons across providers. Hedonic price indexes are usually used to adjust prices to account for quality. They are applied for housing, computers, mobile phones or cars; see, for example, Triplett (2004), Hill (2011), Berndt and Rappaport (2001), Dewenter et al. (2007) or Beer (2007). However, hedonic price indexes are rarely applied for communication services. In the U.S. CPI, hedonic price in-dexes are used to adjust communication prices to account for improved call quality over time (for example, the clarity of calls), see Fixler et al. (2001). But they are not used to identify quantities consumed and prices paid with tar-iff plans. In addition, they are not adjusted to compare prices among mobile communications service providers, which yields different problems than an in-dex used to describe the general price development over time. Deligiorgi et al. (2007) used a hedonic approach to identify price-relevant characteristics of ADSL connections in Europe. Finally, the fact that tariff plans pose problems for consumers in their selection of the optimal tariff plan for mobile commu-nication services has been discussed by Xavier (1998) or Miravete (2003). However, none of these articles has focused on price comparisons among
mo-bile communications service providers.
In this project, hedonic price indexes are introduced to compare prices among different mobile communications service providers. They are used to evaluate explicit communication service prices according to actual observed consump-tion. Different tariff plan specifications from all providers can be implemented identically, and the limits of the consumption profile method are surpassed. All tariff plans can be compared identically, because the index evaluates explicit invoiced amounts according to units actually consumed, which is something every consumer has with every tariff plan.
To construct a hedonic index, first, invoiced amounts are regressed on con-sumed units. Subsequently, implicit unit prices of the providers can be esti-mated. Then, these implicit unit prices can be used to compare prices for consumers’ actually observed consumption patterns among providers. More precisely, for a given consumption pattern, the hypothetical price (invoiced amount) for all providers can be predicted using the implicit unit prices. As a result, the predicted invoiced amounts compared are adjusted to actually consumed units. These imputed invoiced amounts are finally aggregated or averaged through Fisher or Törnqvist price index formulas to compare the providers. By adapting hedonic price indexes to mobile communication ser-vices, most problems discussed above are completely resolved. Only the last point, which has to do with network quality and coverage, is only partially implemented. This method allows the comparison of mobile communication service prices among providers over time with regards to effectively consumed units, different tariff plans and customer service quality.
The hedonic model is presented and specified in the first part of section 2.2. The model is based on information from the bills consumers receive. In the basic hedonic function, the invoiced amount per month is explained by the consumption of units as minutes, text messages, megabytes and the phone received for signing the contract. The hedonic function can be specified in var-ious ways. Therefore, four different specifications are suggested. The second part discusses the index method and formulas used. The double-imputation approach applied favours Fisher and Törnqvist price index formulas. It is mainly the endogenous relation of consumption to tariff plans that has a crucial im-pact on the choice of the index formulas. To compare multiple providers over
CHAPTER 2. MOBILE COMMUNICATION 16 multiple time periods, chaining is suggested.
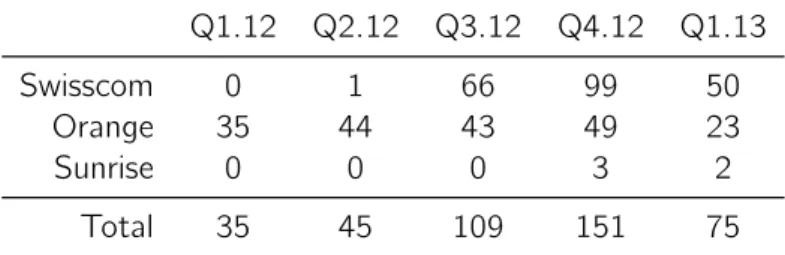
In section 2.3, various estimation methods are applied to the model specifica-tions in order to estimate implicit marginal unit prices. Based on the estimated implicit unit prices, standardised invoiced amounts can be predicted. These are required by the index formulas to compare the service prices of different providers consistently. The hedonic price indexes are used to compare prices of Swisscom and Orange. The data come from monthly bills, except for the mobile phone received for signing a contract. The underlying sample contains 415 bills from 60 consumers between 2012 and 2013.
Finally, an extended conclusion follows in section 2.4. First, the key results are summarised. In the second part, the outlook for further research is discussed. The last subsection addresses practical aspects that have not been included in any other part before, but which are still important in the creation of hedonic price indexes for mobile communication.
2.2
Hedonic price index concept
The hedonic price indexes for mobile communication services are motivated and formally described in this theoretical section. First, in subsection 2.2.1, the newly developed idea for the general model and the resulting hedonic function is introduced. Because this is the first application of hedonic price indexes for mobile communication services, different specifications for the hedonic func-tion are presented in subsecfunc-tion 2.2.2. The model specificafunc-tions are needed to estimate the implicit unit prices. A well-specified model forms the basis of a hedonic price index and greatly influences its accuracy.
Two index concepts to compare providers are outlined in 2.2.3. Both require implicit unit prices for all providers to be compared. A Fisher index describes price levels from a market or producer perspective. This is complemented by a modified Törnqvist index, which compares prices from a representative consumer’s perspective. Again, two concepts are presented because there is no prior literature that has suggested index formulas for mobile communica-tion. In addition, different index formulas yield different interpretations of the price comparisons. Then, the method for simultaneously creating indexes over multiple time periods and providers is illustrated.
Finally, in subsection 2.2.4, the choice of the double-imputation method and the specific index formulas is motivated. Advantages, compared to other he-donic price index types, are outlined. All presented specifications and index formulas are known concepts from the hedonic price index literature. They are usually applied to housing, and so they have been (quite notably) modified for application to mobile communications services.
2.2.1 General approach and the hedonic function
A hedonic price index for mobile communication can be created in various ways. The newly developed approach presented here is meant to model mobile com-munication service prices as accurately as possible. Basic specifications of the model and, consequently, the hedonic function must be made in the beginning. It seems very reasonable to start with monthly bills as basic observations. A consumer i receives a bill every month from its provider t. It contains the price, or total cost, and the corresponding service units consumed. To keep the notation as simple as possible, t denotes both, provider and correspond-ing time period of an observation. Because index formulas are used later on, specifying provider and time period separately is not necessary.
The price for communication services p corresponds to the monthly invoiced amount, minus the cost of all services from third companies. Therefore, in the price, only the services of the provider are considered. Other services, like costly hotlines or train ticket purchases via text messages, for example, are excluded from the model. The invoiced amount is dependent on the contract and the consumed service units. The tariff plan, or contract c, transforms vector x, containing all consumed units, into the invoiced amount. For every consumer i and provider t, this relation holds.
pit = cit(xit) (2.1)
The contract or tariff plan c can therefore be interpreted as a function that transforms the consumed units x into a price p. This is the basic hedonic func-tion. Keep in mind that consumed units are dependent upon the contract of provider t. A consumer with a complete flat-rate tariff plan, for example, such that the invoiced amount is independent of consumption, probably consumes
CHAPTER 2. MOBILE COMMUNICATION 18 more than he would without a flat rate. If all price-relevant consumption vari-ables are captured by the consumption vector x, the hedonic function (2.1) can be specified and estimated. Therefore, single contracts, and especially their specifications, are no longer directly relevant. The ’average’ contract of a provider t can be estimated. The precise model specifications to estimate c are introduced in the following subsection. This subsection is closed by intro-ducing all consumption variables considered price-relevant and thus included in x.
The following consumption units are considered as relevant to the invoiced amount:
• Minutes landline: minutes called on a fix net phone. These minutes can be separated into on-net calls on the fix net of the provider with which consumer i has a contract or off-net calls to a different one.
• Minutes mobile: minutes called on another mobile phone. These minutes can also be separated into on-net and off-net calls.
• Short message services (SMS): number of SMS sent. • Multimedia message services (MMS): number of MMS sent.
• Megabytes (MB): number of mobile data traffic consumed, measured in MB.
• Roaming to other countries: all units, apart from MB and on-net calls, can be made to another country and bring about special roaming tariffs. These units are usually more expensive for the consumer in the end. • Roaming abroad: if one of the units above is consumed abroad, special
tariffs are used, depending on country, involved providers and interna-tional regulations. Calls received abroad are also included.
• Discount on the phone price: for signing a contract, providers sell mobile phones with a discount. The longer in duration and the more expensive the signed contract, the higher the discount. The discount is divided by the minimal duration of the contract in months to obtain the discount per month. More precise descriptions follow in the data subsection 2.3.1. Another variable that might be considered is the number of calls. All minutes are included as aggregates per month. This method does not completely
describe the consumption, because for a given amount of minutes, the number of calls varies. The more connections established, the higher the cost for a given number of minutes consumed. Note that all variables observed appear on most bills. Only the information about the discount on the mobile phone price given for signing a contract does not. This additional information was gathered through a consumer survey. The discount is price-relevant consumption, and so it must be included. It is also very important for the choice of contract, which is often motivated by the phone and thus, the discount. The magnitude of the discount is usually indicative of the size of the fixed cost of a contract, which is the second-most important factor in consumers’ choice.
That consumption can be influenced by the contract becomes a problem for the estimations. For this analysis, it is assumed (for econometric reasons) that the choice of the contract is dependent upon the fixed cost and is thus captured in the discount on the phone price. Consequently, all other consumption variables are assumed to be independent of the contract. Obviously, this assumption and its implications can and should be discussed in further applications.
Finally, consumption not only contains explicitly billed units and quantities; it is also a question of quality. Both geographical network coverage and the speed of the data connection are crucial aspects. They are partially included in the model, but only as cap for maximal consumption. The basic logic is that with increasing network quality, potential consumption also increases. For example, in a high-quality network, a consumer can have a lot of data traffic in a month, whereas in a low-quality network, it is physically not possible. As long as consumers in a good network have relatively high data traffic and those in low-quality networks have small traffic, the hedonic approach can capture the quality via the quantity consumed. However, if, for example, a consumer likes a fast data connection but only uses a few megabytes, or vice versa, a consumer has a weak connection but uses it continuously, the assumption is violated. Precisely how the quality of a network should be included is not discussed here. It is assumed that the quality of the networks is at least partially indicated by the amount of units consumed.
CHAPTER 2. MOBILE COMMUNICATION 20 2.2.2 Model specifications for the hedonic function
After introducing the basic approach, specifications for the hedonic function in equation (2.1) are presented. Four specifications are suggested, namely the linear, a decreasing marginal price, a semi-log and a Box-Cox specification. For a precise discussion of these specification forms in the context of hous-ing, see Yu and Prud’homme (2010) or, more generally, Cropper et al. (1988). Because mobile communication services have yet to be measured by hedonic price indexes and differ greatly from houses, four specifications are considered to start with. These are then evaluated in the empirical section 2.3. Again, the specifications are important because they contribute an essential part of the quality of the estimated implicit unit prices, the predicted or imputed prices and, consequently, the price indexes.
Contrary to hedonic price indexes for houses or cars, the individual functions that transform consumption variables into a price are known precisely through the underlying contracts. At first glance, this might be a very strong indica-tor for the specification of the hedonic function. The hidden aspect of the problem is that these tariff plans are extremely varied. For example, a prepaid contract can be a fully linear function of consumption, where every minute, text message or megabyte consumed is paid exactly per unit, with a constant marginal price. On the other extreme, a full flat-rate tariff plan, the invoiced amount is completely independent of consumption, and the function would contain merely a constant. However, in between these two extremes, there is a wide variety of tariff plans. In the data, there is no pure form of both ex-treme tariff plans. Tariff plans usually contain flat-rate elements to a certain extent, often depending on the monthly fixed cost and demographic discounts. Most flat-rate elements can be observed in data traffic. In contrast, roaming is rarely covered by flat rates.
Besides the tariff plans, customer consultation to offer the client the optimal contract is also relevant. A provider can offer very attractive tariff plans, but if, for example, a lot of consumers with little consumption are in contracts with a high fixed cost, they pay relatively more than they would in contracts with a smaller fixed cost. This highlights the fact that, in the end, optimal model specifications are no longer that easily identified. By relating the invoiced amount directly to consumed units, customer consulting is also included in the
evaluation of prices. The uncertainty about the optimal form generated by the variation in tariff plans and customer consulting is the main reason that several model specifications are tested in this analysis.
Linear
First, the linear specification in equation (2.2) is introduced. A linear model is usually used if no further information for specification is available. The wide variety of tariff plans and customer consulting, therefore, supports the usage of a linear model. Prices or invoiced amounts p are modelled as a linear function of all k units consumed by consumer i with a specific provider t. The coefficients βj can be interpreted as the marginal implicit price of unit j . The constant corresponds to the basic price of signing a contract with a certain provider t. The equation is complemented by the stochastic error term u.
An increase of 1 in the consumption of unit j raises the invoiced amount or price by its marginal implicit unit price βj. Note that consumption x is in this subsection described for a single good j, and not as a vector of all goods, as it was before and will be later in the definition of indexes. Describing specifica-tions is more convenient with single units, whereas the hedonic function and the indexes can be better described with using vectors.
pt i = β0t+ k X j=1 βt jxi jt + uit (2.2)
The linear model’s key benefit is that the levels of the estimated coefficients can be interpreted as constant marginal unit prices. This helps to validate the estimated coefficients. If the constant was suppressed, the coefficients could be interpreted as average unit prices. However, they would be biased. Esti-mations of specifications without a constant, which offer interesting insights about the magnitudes of unit prices, are reported in appendix A.1.1.
Note that the marginal unit price in the linear specification for the first megabyte is the same as for the thousandth, for example. It seems reasonable to differ-entiate this problem.
CHAPTER 2. MOBILE COMMUNICATION 22 Decreasing marginal price
By discounting the consumption of unit j by 0 < θj ≤1, a decreasing marginal unit price is introduced in equation (2.3). This specification is mainly moti-vated by the general form of tariff systems. Consumers with low consumption usually have a small fixed cost component and pay a relatively high marginal price per unit. Consumers with high consumption have more flat-rate elements in their contracts, and therefore have a higher fixed-cost component and a relatively lower marginal price per additional unit consumed. By discounting consumption, the predictive power can be increased.
pt i = β0t+ k X j=1 βt j(xi jt)θj + uit (2.3) This model approach can also be interpreted in other ways. Obviously, the con-tribution of an additionally consumed unit to the invoiced amount decreases over all tariff plans. All providers diversify their tariff plans such that the higher the consumption, the lower the price per unit consumed. Nonetheless, it can also be seen as a way of decreasing the marginal utility of an additionally con-sumed unit. The most important megabyte concon-sumed, for example, is proba-bly worth much more than the thousandth. Maybe with the most important megabyte, a very important email is received, whereas with the thousandth, some additional seconds TV stream are consumed.
The interpretation of specification (2.3) is versatile. However, in this first application, the interpretation of the decreasing marginal contribution of a unit to the invoiced amount is used. Mixing utility and hedonic price functions imposes a new framework, as discussed to some extent by Rosen (1974). As this is a first encounter with hedonic price indexes for mobile communication, utility functions are not used in any form.
After introducing two models that are mainly motivated by ’economic’ con-cerns, the following two models are motivated by ’econometric’ benefits, pos-sibly offering better prediction quality.
Semi-logarithmic
The semi-logarithmic specification in equation (2.4) linearises the dependent variable. This is motivated by the usual distribution of prices to obtain normally distributed residuals. The coefficients can be interpreted as the semi-elasticity of the invoiced amount. If consumption of unit j is increased by 1, the invoiced amount p changes by 100 · βj%. log(pit) = βt0+ k X j=1 βjtxi jt + uit (2.4)
Note that a log-linear model (which also takes the logarithm of explanatory variables) is not a useful approach in the mobile communication context. A lot of consumption unit values are equal to 0, and its logarithm would be not defined. Roaming units in particular are consumed erratically.
Box-Cox
The Box-Cox specification in equation (2.5) completes the set. The form is dependent on the parameter λ, which can be estimated by maximum-likelihood. If λ is not significantly different from 0, the semi-logarithmic model specifica-tion is used. If it is, then the dependent variable is transformed as described in equation (2.6). The main benefit of a Box-Cox specification is that usually the residual distribution is closer to a normal distribution.
pit(λ)= β0t+ k X j=1 βjtxi jt + uti (2.5) pit(λ) = pλ−1 λ if λ 6= 0 log(p) if λ = 0 (2.6)
The four specifications will be estimated in the empirical section. The trade-off is between a simple model specification (linear) with a straight interpretation of results, versus having better specified models that suffice to the most im-portant assumptions of the ordinary least squares estimation (OLS). The goal
CHAPTER 2. MOBILE COMMUNICATION 24 for hedonic price indexes is generally to have a model with optimal predictive power. However, as this is the first application, other aspects of the model specifications (residual distribution, heteroscedasticity, specification) are also analysed in the empirical section. Other functional forms, especially non-linear models, may also be reliable. Additionally, prices could be predicted by non-parametric methods, such as classification algorithms, but these are not discussed here.
2.2.3 Hedonic price indexes
When the model specifications from the previous subsection are estimated, then the resulting coefficients can generally be interpreted as implicit marginal unit prices. Based on these implicit marginal unit prices, the indexes can be constructed.
In the first part of this subsection, a Fisher index, which describes the price development for aggregate consumption, is introduced. Then, in the second part, a modified Törnqvist index, which measures the price for a representa-tive consumer, is illustrated. Both indexes allow the comparison of the service prices exclusively between two providers. Therefore, in the final part, an ap-proach for comparing multiple providers over multiple time periods through chaining is presented. In the applied double-imputed indexes, predicted prices are used within standard price index formulas. The price predictions are based on the model specifications from the previous subsection. The motivation for the selection of the double-imputation method and the chaining follows in subsection 2.2.4.
Fisher: aggregate consumption perspective
The Fisher price index PF
0,1 in equation (2.7) describes the relative price be-tween two providers t = 0, 1 for the total amount of units consumed. The Fisher price index is the geometric mean between a Laspeyres PL
0,1and Paasche PP
0,1 index. The notation follows Hill (2011).
P0,1F =qPL
Price indexes are growth factors for price levels; thus, the geometric mean is used. The Laspeyres price index, as one element of the Fisher index, is defined in equation (2.8). This index measures how much the total amount of consumed units with provider 0, Pn0
i=1xi0, would cost relative to provider 1. It contains all n0 observed consumption vectors belonging to provider 0. Remember that xt
i are again vectors of all consumed units of one consumer i of provider t. Based on the model specifications described in subsection 2.2.2, unit prices for every provider can be estimated. By using the double-imputation method, (hypothetical) invoiced amounts are then predicted for all consumption vectors of provider 0 and denoted as pbt
i(xi0). Finally, the price or total cost for the aggregated consumption is compared between both providers. P0,1L = Pn0 i=1pb1i(xi0) Pn0 i=1pb0i(xi0) (2.8) Due to the double-imputation method, the effectively observed prices p0
i of provider 0 are not used. To compare both providers equally, predicted prices
b
pi0(xi0) replace the actual observed prices. Note that the index is implicitly weighted by expenditure shares. A large consumption vector generally results in a larger predicted price and has subsequently more impact on the aggregate than a small one.
The Paasche index (2.9) measures how much the total amount of consumed units of provider 1, Pn1
i=1(xi1), would cost relative to provider 0. Again, due to the double-imputation, it is not the observed prices p1
i that are used, but the predicted ones.
P0,1P = Pn1 i=1pb1i(xi1) Pn1 i=1pb0i(xi1) (2.9) The Fisher index, as geometric mean of Laspeyres and Paasche, describes the price change of aggregated consumption between two providers. Aggregated consumption and estimated unit prices of both providers are equally included. If only a Laspeyres or Paasche index were used, then the consumption of only one provider would be used as weights for the predicted prices. Even more important is the fact that consumers adapt their consumption to tariff plans
CHAPTER 2. MOBILE COMMUNICATION 26 or contracts. If, for example, only the consumption vectors of provider 0 were used, the predicted prices for provider 1 would become relatively high. Con-sumers of provider 1 adapt their consumption to the tariff plans of provider 1 to minimise communication cost. If the tariff plans or contracts are different between the two providers, a non-symmetric index would result in a signifi-cant bias. Using symmetric indexes is essential for comparing communications service providers. Additionally, the number of observations is allowed to differ across providers and periods, which is a nice property to work with.
Modified Törnqvist: average consumer perspective
The Fisher index compares price levels for aggregated consumption. As dis-cussed, expenditure shares are used. Consumers with high consumption have more weight in the index. This can be a problem because the provider with better tariff plans for intense consumption benefits. Therefore, an index that describes the average price level change for a representative consumer serves as an alternative. Here, all observations obtain equal weights, compared to the expenditure share weights used before.
Like the Fisher index, the Törnqvist index PT
0,1is a geometric mean. But unlike Fisher, it is the mean of the geometric Laspeyres PGL
0,1 and geometric Paasche PGP
0,1 indexes, as formulated below in equation (2.10).
P0,1T =qPGL
0,1 ·P0,1GP (2.10)
Like in Fisher, both providers are treated equally. The geometric Laspeyres index (2.11) is the geometric mean of the growth factors of all predicted prices for consumption of provider 0. In the standard geometric Laspeyres index, the growth factors are weighted by expenditure shares. But in order to show the price development for a representative consumer, here every obser-vation obtains equal weight. All n0 observations are weighted equally by 1/n0. Therefore, no matter how great the consumption is, price changes for every observation are included with the same weight. As in the basic Laspeyres index, the price development of the consumption of provider 0 is described.
P0,1GL = n0 Y i=1 b p1 i(xi0) b p0 i(xi0) !1 n0 (2.11) The geometric Paasche index (2.12) is also an average growth factor, but for the prices of the consumption with provider 1. All growth factors of all observations obtain again equal weights 1/n1. Note that double-imputation is again applied. Observed prices pt
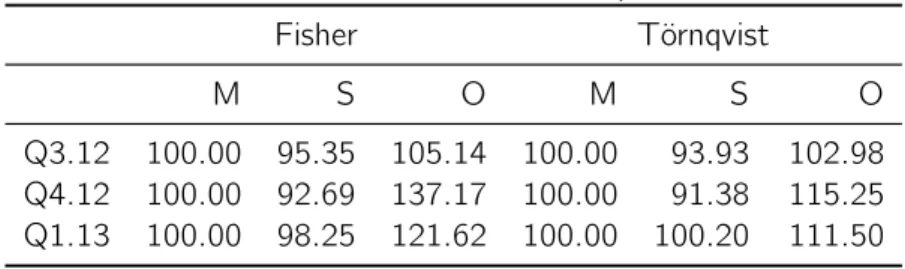
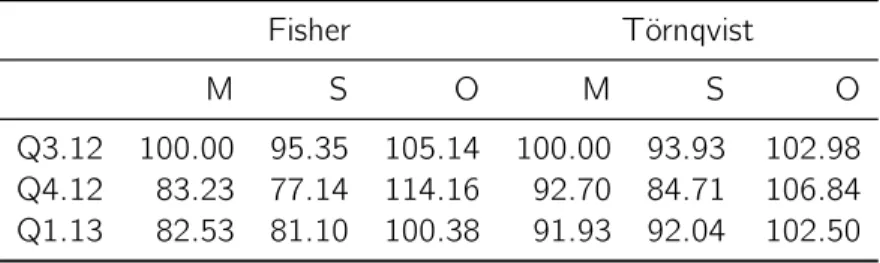
i are used neither in the geometric Laypeyres nor in the geometric Paasche index. Instead, they are replaced by the pre-dicted prices pbti(xit) in order to compare both providers in exactly the same manner. P0,1GP = n1 Y i=1 b p1i(xi1) b p0 i(xi1) !1 n1 (2.12) The equal weights used here in the geometric Paasche, Laypeyres and sub-sequently Törngvist index, could technically also be used in the Fisher index. But the intention when applying the Fisher index is to measure the price of the aggregated consumption. The modified Törnqvist index, in contrast, is an average growth factor in which every observation, regardless of high or low consumption, is included with equal weight. It describes the average price de-velopment of a representative consumer. Both indexes describe the price levels in a very similar manner. However, the resulting differences are significant, as shown in the empirical part on indexes in subsection 2.3.3.
Note that it does not matter if the number of observations differs across providers. Both indexes are symmetric and weight the consumption equally for both providers. Nevertheless, the number of observations remains important for the prediction quality. A large difference in the number of observations may result in different prediction accuracies.
Chaining: multiple time periods and providers
The indexes presented in both previous parts describe the relative price level between two providers. In the Fisher approach, the price for aggregated con-sumption is described, while in the Törnqvist index, it is the price change for an
CHAPTER 2. MOBILE COMMUNICATION 28 average consumer. An index for mobile communication service prices should be able to describe prices over multiple providers and time periods.
The focus of the method presented here lies in stability. Indexes should not change ex post; they should describe prices of period- or provider-specific con-sumption as precisely as possible and be flexible in terms of modification. This can be achieved by chaining indexes over time, as illustrated with the example below.
Consider as initial position three time periods s = a, b, c. The underlying market contains three providers t = 1, 2, 3, where t = 0 denotes the com-plete market, including all providers by their market shares. All providers are compared to the entire market (base) within one period. There is no need to introduce a market index, and any provider might be used as base. But if every provider should be treated equally, a market index seems a fair tool for avoiding the over-representation of one provider.
The chaining method applied to obtain indexes across all providers and time periods can be described as follows:
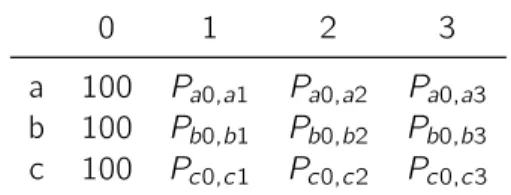
1. In every single period s, price indexes for the complete market 0 and every single provider t are created. As base period serves the complete market 0. The period s-specific indexes Ps0,st are independent between different time periods.
Table 2.1: Indexes with base period t
0 1 2 3
a 100 Pa0,a1 Pa0,a2 Pa0,a3 b 100 Pb0,b1 Pb0,b2 Pb0,b3 c 100 Pc0,c1 Pc0,c2 Pc0,c3
2. Indexes between markets for all subsequent periods Ps0,(s+1)0 are cre-ated. In this three period example, two indexes result: Pa0,b0and Pb0,c0. 3. All market indexes are chained through simple multiplication. With three
periods, only one index has to be chained.
As a result, all market indexes have the desired base period a0.
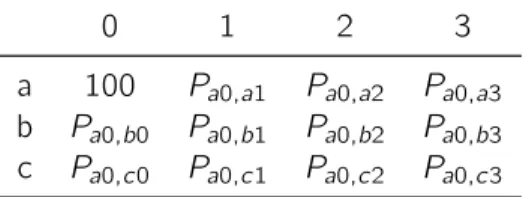
4. Finally, all index bases need to be changed to a0. Provider indexes are chained with the new market indexes with base period a0 and corre-sponding reference period s0.
Pa0,st = Pa0,s0·Ps0,st (2.14)
Thus, all indexes have base period a0. Note that the resulting represen-tation in table 2.2 corresponds to the OECD approach for inter-periodical comparisons. For intra-periodical price comparisons, each period’s mar-ket serves as base period, as illustrated in table 2.1.
Table 2.2: Indexes with base period 0
0 1 2 3
a 100 Pa0,a1 Pa0,a2 Pa0,a3 b Pa0,b0 Pa0,b1 Pa0,b2 Pa0,b3 c Pa0,c0 Pa0,c1 Pa0,c2 Pa0,c3
An ex post change of base period a0 to a period τ0 can be done by a base change, see equation (2.15). After the base change, the index value of the new base period corresponds to 100 points (by definition).
Pτ0,st = Pa0,st Pa0,τ 0
(2.15) Theoretically, all indexes could be calculated directly for the desired provider and period. Remember that in both index concepts, Fisher and Törnqvist, the consumption of the base and reference periods are included symmetrically. As long as the base and reference periods show similar consumption patterns, the resulting difference between chaining or directly determining indexes with desired periods should not be large.
However, as soon as the base and reference periods are further away, technical progress and new tariff plans change consumption significantly. In the more recent period, new goods or units that did not exist in the older period might be consumed. Solutions to these problems - like ignoring new goods - are given, but the final result is always inferior. Chaining allows for the description of