HAL Id: hal-02285812
https://hal.sorbonne-universite.fr/hal-02285812
Submitted on 13 Sep 2019
HAL is a multi-disciplinary open access
archive for the deposit and dissemination of
sci-entific research documents, whether they are
pub-lished or not. The documents may come from
teaching and research institutions in France or
abroad, or from public or private research centers.
L’archive ouverte pluridisciplinaire HAL, est
destinée au dépôt et à la diffusion de documents
scientifiques de niveau recherche, publiés ou non,
émanant des établissements d’enseignement et de
recherche français ou étrangers, des laboratoires
publics ou privés.
research trend and future directions in the field of
imaging biomarkers and artificial intelligence
Mathieu Sinigaglia, Tarek Assi, Florent Besson, Samy Ammari, Myriam
Edjlali, Whitney Feltus, Laura Rozenblum-Beddok, Binsheng Zhao, Lawrence
Schwartz, Fatima-Zohra Mokrane, et al.
To cite this version:
Mathieu Sinigaglia, Tarek Assi, Florent Besson, Samy Ammari, Myriam Edjlali, et al.. Imaging-guided
precision medicine in glioblastoma patients treated with immune checkpoint modulators: research
trend and future directions in the field of imaging biomarkers and artificial intelligence. EJNMMI
Research, SpringerOpen, 2019, 9 (1), pp.78. �10.1186/s13550-019-0542-5�. �hal-02285812�
R E V I E W
Open Access
Imaging-guided precision medicine in
glioblastoma patients treated with immune
checkpoint modulators: research trend and
future directions in the field of imaging
biomarkers and artificial intelligence
Mathieu Sinigaglia
1, Tarek Assi
2, Florent L. Besson
3,4, Samy Ammari
5, Myriam Edjlali
6, Whitney Feltus
7,
Laura Rozenblum-Beddok
8, Binsheng Zhao
7, Lawrence H. Schwartz
7, Fatima-Zohra Mokrane
7,9and
Laurent Dercle
7,10*Abstract
Immunotherapies that employ immune checkpoint modulators (ICMs) have emerged as an effective treatment for a variety of solid cancers, as well as a paradigm shift in the treatment of cancers. Despite this breakthrough, the median survival time of glioblastoma patients has remained at about 2 years. Therefore, the safety and anti-cancer efficacy of combination therapies that include ICMs are being actively investigated. Because of the distinct mechanisms of ICMs, which restore the immune system’s anti-tumor capacity, unconventional immune-related phenomena are increasingly being reported in terms of tumor response and progression, as well as adverse events. Indeed, immunotherapy response assessments for neuro-oncology (iRANO) play a central role in guiding cancer patient management and define a“wait and see strategy” for patients treated with ICMs in monotherapy with progressive disease on MRI. This article deciphers emerging research trends to ameliorate four challenges unaddressed by the iRANO criteria: (1) patient selection, (2) identification of immune-related phenomena other than pseudoprogression (i.e., hyperprogression, the abscopal effect, immune-related adverse events), (3) response assessment in combination therapies including ICM, and (4) alternatives to MRI. To this end, our article provides a structured approach for standardized selection and reporting of imaging modalities to enable the use of precision medicine by deciphering the characteristics of the tumor and its immune environment. Emerging preclinical or clinical innovations are also discussed as future directions such as immune-specific targeting and implementation of artificial intelligence algorithms.
Keywords: Gliblastoma, Immunotherapy, Artificial Intelligence, Radiomics, Imaging, RANO, iRANO, PET, MR, Nivolumab, Pembrolizumab, Pidilizumab, Durvalumab
Background
Despite advances in treatment strategies, the prognosis for glioblastoma patients remains poor, with a median survival of around 2 years. The poor prognosis of glioblastoma pa-tients can be attributed to their resistance to current
therapeutic approaches [1]. Hence potential synergistic as-sociations are investigated by combining existing treat-ments to target two hallmarks of glioblastoma: intra-tumoral heterogeneity and immunosuppressive microenvi-ronments. Early response assessments are therefore crucial considering the poor prognosis but the state-of-the-art is complex as several combination therapies are being actively investigated.
Thousands of patients with glioblastoma recruited into international clinical trials (Table 1, 3604 pts) are
© The Author(s). 2019 Open Access This article is distributed under the terms of the Creative Commons Attribution 4.0 International License (http://creativecommons.org/licenses/by/4.0/), which permits unrestricted use, distribution, and reproduction in any medium, provided you give appropriate credit to the original author(s) and the source, provide a link to the Creative Commons license, and indicate if changes were made.
* Correspondence:[email protected];[email protected]
7
Department of Radiology, New York Presbyterian Hospital—Columbia University Medical Center, New York, NY 10039, USA
10UMR1015, Institut Gustave Roussy, Université Paris Saclay, 94800 Villejuif,
France
currently being treated with immune checkpoint modu-lators (ICMs). ICMs restore the immune system’s cap-acity to eradicate tumors by inhibiting the immune suppressive capabilities of pathways such as CTLA-4, PD-1, and PD-L1 [2]. ICMs have advanced to the fore-front of treatment of solid tumors but without leading to an impact on outcome in patients with glioblastoma in comparison with other tumors such as melanoma. Hence, they are currently used only in combination with other molecules such as chemotherapy, targeted molecu-lar agents, vaccines, or radiotherapy.
Response evaluation is intrinsically challenging in glio-blastoma patients. Experts from the RANO working group have defined a compelling solution to solve (in part) im-aging challenges related to chemoradiation with temozolo-mide (pseudoprogression) and antiangiogenic therapy (pseudoresponse): the response assessment for neuro-on-cology (RANO) criteria. However, evaluating the efficacy of ICMs is a paradigm shift because ICMs trigger new im-aging patterns of tumor response and progression. Experts defined a MRI-guided strategy in patients treated with ICMs in monotherapy referred to as Immunotherapy Table 1 Prospective studies currently recruiting for Anti-PD1 treatment in Glioblastoma
Note: Details on clinical trials were obtained onClinicalTrials.govwebsite (https://clinicaltrials.gov/ct2/home). Last upadate, December 1, 2018.IDO-1 cytosolic enzyme indoleamine 2,3-dioxygenase-1,TTF Tumor treating Fields, TIL tumor infiltrating lymphocytes, GITR Glucocorticoid induced TNF receptor, ND not discolsed, DCE: dynamic contrast-enhanced
RANO (iRANO) criteria [3]. In progressive patients, a“wait and see strategy” is recommended and progression needs to be confirmed by active follow-up. However, a recent survey of 220 centers in Europe demonstrated that only a minority of centers (27%) use RANO criteria, while the majority pre-fers to undertake qualitative assessments. This lack of quantitative assessments demonstrates the need for stan-dardized evaluations and the development of quantitative algorithms for robust response assessments [4].
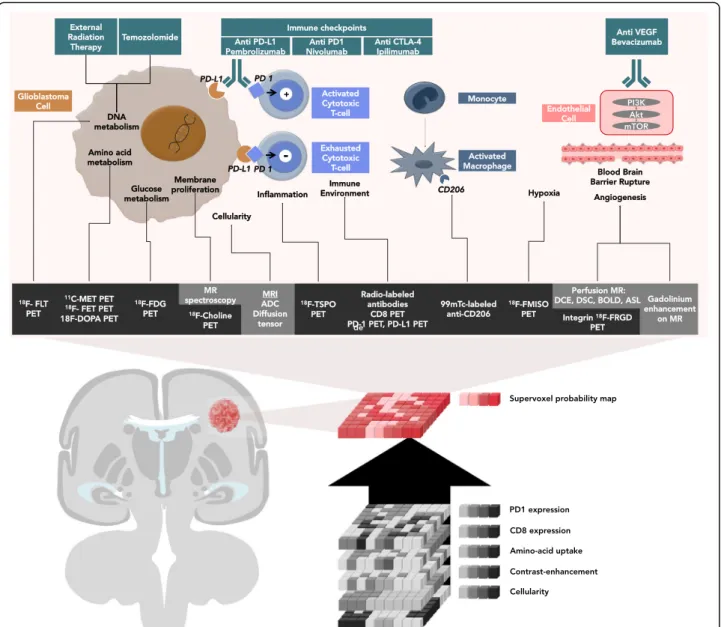
This review will discuss which imaging studies are used in ongoing clinical trials (Table1) and what nuclear medi-cine specialists and radiologists should be looking for and reporting when interpreting the efficacy of ICM in mono-therapy and in combination mono-therapy. Different approaches will be described. First, standard of care imaging techniques provide non-immune-specific imaging biomarkers, which are currently widely used in routine clinical work-ups. Second, breakthroughs in biomedical engineering allow tar-geting immune-specific biomarkers explored in preclinical studies. Third, artificial intelligence can be trained to iden-tify radiomics signatures by data mining standard of care MRIs. Fourth, synthetic metrics such as supervoxel [5] could capitalize on and combine these three approaches, thereby redefining medical imaging as a comprehensive and quantitative decision tool. (Fig.1, Tables2and3).
This report aims to provide a structured approach for standardized selection of imaging modalities to enable a precision medicine approach by deciphering the characteristics of the tumor and its immune environment. Furthermore, this review addresses chal-lenges faced by radiologists evaluating patients treated with ICMs: the evaluation of ICMs in combination therapies, new patterns of response (i.e., pseudopro-gression, hyperprogression and abscopal effect), the accuracy of alternative imaging metrics to differentiate tumor progression from delayed responses or from therapy-induced inflammation.
Rationale for ICM in combination therapy
The current standard of care for glioblastoma treat-ment involves surgical resection followed by a 6-week course of radiation therapy with 60 Gy delivered in 30 fractions [7]. The oral alkylating agent Temozolomide (TMZ) is used as concomitant and adjuvant chemo-therapy at a dose of 75 mg/m2 daily, throughout the radiation therapy [8]. In cases of disease recurrence after this protocol, the treatment may involve a new surgery, new radiation therapy or the use of bevacizu-mab (antibody targeting VEGF) [9].
The frequency and severity of glioblastoma explain how critical the optimization of treatment strategies is [10]. Glioblastoma is indeed the most common primary malignant brain tumor in adults and the median survival with current treatment strategies is 15 months[11]. An
even poorer prognosis is observed with male patients [12] older than 50 years [13] with neurological or general symptoms [14].
There is a strong rationale for the use of ICM. Glioblastoma cells [15,16] escape immune surveillance by creating an immune-suppressive environment [17], which is further promoted by central nervous system immune isolation, blood-brain barrier protection[18], the low activity of the major histocompatibility com-plex, and the low quantity of antigen presenting cells. ICMs aim to restore tumor elimination (Fig.1) through the activation of anergic T lymphocytes. Immune cells are indeed able to migrate across the blood-brain bar-rier to reach cervical lymph nodes and present tumor antigens.
The limited efficacy of the standard of care therapies, as well as ICMs in monotherapy [19] (Table1), have led to exploration of synergistic therapeutic combinations (Table 1) involving ICMs, radiotherapy, and systemic therapy. The rationale for radiotherapy is that it im-proves the response of tumors to ICMs by modulating the expression of molecules on the surface of tumor cells (e.g., major histocompatibility complex-1, calreti-culin, PD-L1 [20]), increasing the secretion of pro-in-flammatory cytokines (e.g., interferon gamma) and enhancing the recruitment of immune cells (e.g., it re-leases tumor antigens into the circulation, decreases the tumor interstitial fluid pressure [21], and activates CD8 T-Cells [22]). Alternatively, combinations with systemic therapy are also being actively investigated. This is exemplified by antiangiogenic drugs such as bevacizumab, which modulates immune response, the number of active T-cells, and the maturation of den-dritic cells [23–25].
Immune-related patterns of response and progression
Because of the distinct mechanisms of ICMs that restore the immune system’s anti-tumor capacity, unconventional immune-related phenomena are encountered in terms of tumor response and progression, and adverse events.
Pseudoprogression defines a transitory progression in tumor size or metabolism and can mislead the evaluation of cancer treatment efficacy. The pseudoprogression can be due to either delayed therapeutic efficacy or immune cell infiltration. These phenomena constrain clinicians to a wait and see strategy in case of appearance of growing disease, since tumor growth or new lesions do not preclude clinical benefit, treatment efficacy, and long-term survival. High rates of disease pseudoprogression are expected in glioblastoma patients treated with ICM in combination with standard-of-care therapies (e.g., radiotherapy), since pseudoprogression already occurs in up to 30% of glioblast-omas treated with standard-of-care therapies and up to
10% [26,27] of solid tumors treated with ICMs. Several les-sons can be learned from classical treatments [28]. First, the only validated diagnostic criterion of a pseudoprogres-sion is the stability or improvement over time. This strategy is problematic in glioblastoma patients given their short life expectancy[3]. Second, MRI changes observed in pseudo-progression are not specific (the increase in contrast en-hancement and signal abnormalities on T1, T2, and Flair sequences). Third, in the majority of cases, pseudoprogres-sion occurs within the first 12 weeks after completion of chemoradiation [29]. Consequently, alternative imaging cri-teria are needed (Fig.1).
Hyperprogression defines an acceleration of tumor growth after the initiation of ICM therapy, as compared to the period before treatment initiation used as a refer-ence. Hyperprogression was reported in 9–29% of pa-tients with solid tumors and was associated with a shorter overall survival [30] (Fig. 2). An idiosyncratic effect of ICMs is suspected [31].
The abscopal effect defines the occurrence of an ob-jective response outside of the radiation field [32] when radiation therapy is combined with ICM. The abscopal effect is triggered by several factors such as (1) the modulation of the expression of molecules on the Fig. 1 Imaging of actionable molecular pathways in patients with glioblastoma: the concept of supervoxels. Imaging allows non-invasive evaluation of the action of immune checkpoint modulators in patients with glioblastoma. Currently, most clinicians perform a visual and qualitative assessment. Alternatively, artificial intelligence can be trained to extract imaging biomarkers by measuring the signal in each unique voxel of a region of interest provided by each imaging technique. Ultimately, artificial intelligence can resume the information provided by multiple voxels from multiple imaging modality to provide one single quantitative probability map using supervoxels (synthetic summary of all voxels from the same volume of interest using different imaging modalities)
surface of tumor cells [20], (2) increased expression of pro-inflammatory cytokines, and (3) enhancement of the recruitment of immune cells [21]. The role of abscopal effects related to ICMs in glioblastoma patients/in the CNS needs to be investigated.
Pseudoresponses define a transitory radiographic re-sponse due to an action on blood vessel permeability rather than an anti-tumor effect. Pseudoresponses occur in antiangiogenic therapies and not in treatment with ICMs in monotherapy [3, 33]. In antiangiogenic therap-ies, the RANO criteria require a radiographic response to persist for more than 4 weeks: a rapid radiographic response can be observed in up to 60% of patients and is not related to increased survival.
Immune related adverse events (iRAE) can occur theor-etically at any site and at any time in patients treated with
ICMs. In patients with glioblastoma, the radiologists should be aware that systemic ICM therapies are expected to trigger iRAE most frequently at specific sites such as lung, mediastinum lymph nodes (sarcoidosis-like), colon (enterocolitis), glands (hypophysitis, thyroiditis), liver (hepatitis), pancreas (pancreatitis), and joints (arthralgia). Life-threatening iRAE should be suspected in case of oc-currence of pneumonitis and colitis. Medical imaging de-tects 74% of irAE in patients treated with anti-PD1 and guides patients and their health care providers towards specific management [34].
Current guidelines
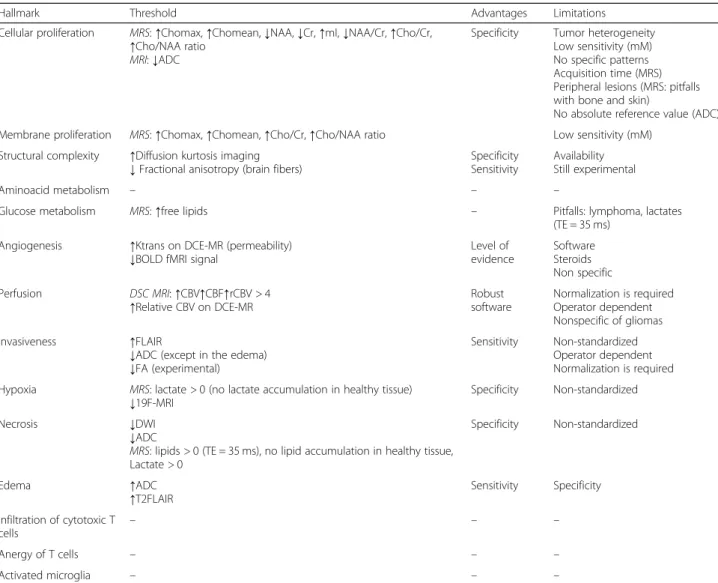
There is a crucial need for defining the optimal imaging-guided strategy in glioblastoma patients treated with ICMs, both in monotherapy and combination therapy. Table 2 MRI imaging biomarkers for assessment of the immune and tumor environment of glioblastoma
Hallmark Threshold Advantages Limitations
Cellular proliferation MRS: ↑Chomax, ↑Chomean, ↓NAA, ↓Cr, ↑mI, ↓NAA/Cr, ↑Cho/Cr, ↑Cho/NAA ratio
MRI: ↓ADC
Specificity Tumor heterogeneity Low sensitivity (mM) No specific patterns Acquisition time (MRS) Peripheral lesions (MRS: pitfalls with bone and skin)
No absolute reference value (ADC) Membrane proliferation MRS: ↑Chomax, ↑Chomean, ↑Cho/Cr, ↑Cho/NAA ratio Low sensitivity (mM)
Structural complexity ↑Diffusion kurtosis imaging
↓ Fractional anisotropy (brain fibers) SpecificitySensitivity
Availability Still experimental
Aminoacid metabolism – – –
Glucose metabolism MRS: ↑free lipids – Pitfalls: lymphoma, lactates
(TE = 35 ms) Angiogenesis ↑Ktrans on DCE-MR (permeability)
↓BOLD fMRI signal Level ofevidence
Software Steroids Non specific Perfusion DSC MRI: ↑CBV↑CBF↑rCBV > 4
↑Relative CBV on DCE-MR Robustsoftware
Normalization is required Operator dependent Nonspecific of gliomas Invasiveness ↑FLAIR
↓ADC (except in the edema) ↓FA (experimental)
Sensitivity Non-standardized Operator dependent Normalization is required Hypoxia MRS: lactate > 0 (no lactate accumulation in healthy tissue)
↓19F-MRI Specificity Non-standardized
Necrosis ↓DWI
↓ADC
MRS: lipids > 0 (TE = 35 ms), no lipid accumulation in healthy tissue, Lactate > 0
Specificity Non-standardized
Edema ↑ADC
↑T2FLAIR Sensitivity Specificity
Infiltration of cytotoxic T cells
– – –
Anergy of T cells – – –
Activated microglia – – –
Note: [6].MRS magnetic resonance spectroscopy, Chomax maximum concentration of containing compounds, Chomean mean concentration of choline-containing compounds,Cr creatinine, mI myoinositol, NAA N-acetyl-aspartate, BBB blood-brain barrier, CBV cerebral blood volume, CBF cerebral blood flow, rCBV related CBV,FLAIR fluid-attenuated inversion recovery, ADC apparent diffusion coefficient, FA fractional anisotropy. BOLD blood oxygenation level dependent, fMRI functional magnetic resonance imaging,TE EchoTime (ms), ↓ decrease, ↑ increase
The only existing guideline was proposed by the RANO working group (iRANO criteria) and concerns response assessment using contrast-enhanced MRI in patients treated with ICMs in monotherapy (Fig.3) [3].
On MRI, iRANO criteria recommend a “wait and see” strategy in patients with a radiological progression within 6 months after initiating ICMs in monotherapy [3] due to the pseudoprogression phenomenon. A radiological pro-gression is defined by a worsening of clinical status (i.e., neurological symptoms and consumption of corticoids), an increase in the size of contrast enhancement of target lesions, or an apparition of new lesions. Strikingly, the management of combination therapies and hyperprogres-sion was not discussed by the RANO working group.
While MRI is the current standard of care for staging and response assessment, guidelines [35] increasingly rec-ommend, in addition, the use of amino acid positron emission tomography (PET) to detect viable tumor tissue,
tumor delineation (estimation of true tumor extension in low- and high-grade gliomas), selection of the best biopsy site (stereotactic biopsy guiding), non-invasive tumor grading (combination of dynamic 18F-FET-PET and diffu-sion MRI), therapy planning (defining the true tumor vol-ume to be treated), treatment monitoring (response assessment to locoregional chemo- and radiotherapy), and early detection of residual tumor after surgery. However, the role of amino acid PET in ICM response assessment remains unaddressed.
Limitations of conventional non-immune-specific MRI biomarkers
In patients with glioblastoma, diagnosis and response assessment rely on various imaging techniques not
designed for ICM monitoring (Table 2) which are,
therefore “non-immune-specific.” MRI sequences in-clude post contrast T1- and T2-weighted images, Table 3 PET imaging biomarkers for assessment of the immune and tumor environment of gliobastoma
Hallmark Threshold Advantages Limitations
Cellular proliferation ↑18F-FLT Correlated to Ki-67 High sensitivity (nM) Absolute quantification
Does not cross the intact blood-brain barrier (BBB) High cortical background activity Low specificity
Challenging production Membrane proliferation ↑18F-choline High sensitivity (nM)
Absolute quantification Radiation necrosis vs. recurrence
Does not cross the intact BBB Inflammation vs. Tumor tissue High cortical background activity Availability
Structural complexity – – –
Aminoacid metabolism ↑11C-methionine ↑18F-FET ↑18F-FDOPA
Cross the intact BBB Specificity
Half-life (11C- methionine = 20 min) Availability
Glucose metabolism ↑18F-FDG Availability Cross the intact BBB No side effects
High cortical background activity Non-specific: inflammation vs. tumor
Angiogenesis ↑18F-RGD Marker forαVβ3 expression Primarily an experimental application Perfusion ↑15O-H2O Quantification in mL/100 g per min Availability
Time and cost consuming
Invasiveness – – –
Hypoxia ↑18F-FMISO
↑18F-FAZA ↓15O-H2O
Identification of radiation resistant areas Primarily experimental application
Necrosis – – –
Edema – – –
Infiltration of
cytotoxic T cells ↑18F-FHBG
Track HSV1-tk reporter gene expression (cytotoxic T cells)
Preclinical experimental application
↑ 89Zr-PEGylated-anti-CD8-VHH Track CD8+ T cells Primarily experimental application ↑68Ga-DOTA-D-Phe1-Tyr3-Octreotide Activated immune cells Primarily experimental application Anergy of T cells ↑PD-1 or PD-L1 Prediction of the effectiveness of anti-PD1 Still experimental on
mouse tumor models
Activated microglia ↑TSPO (immuno-PET) Nonspecific: tumor vs.
neuro-inflammation 18F-FLT18
F-fluorothymidine,BBB blood-brain barrier, 18F-FDG18
F-fluorodeoxyglucose,18F-FET18
F-fluoroethyltyrosine,11C-MET 11C-methionine,18F-RGD18
F-arginine-glycine-aspartic acid,18F-FMISO18F-fluoromisonidazole,18F-FHBG18F-fluoro-3-(hydroxymethyl)butylguanin,↓ decrease, ↑ increase
diffusion and perfusion imaging, and proton magnetic resonance spectroscopy.
Cellular density: diffusion-weighted imaging
MRI measures cellular density through the apparent diffusion coefficients (ADCs) on diffusion-weighted images (DWIs), measuring itself the random diffusion of water molecules (Brownian motion) in biological tissues [36]. The paradigm in cytotoxic treatment is that a decrease in ADC reflects degradation of cellu-lar integrity by necrosis or edema [37, 38] and pre-dicts treatment efficacy [39]. In patients treated with
ICM, the interpretation of ADC is not straightforward. Indeed an increase in the volume of tissue with intermedi-ate ADC predicts efficacy [40] while an inflammatory cell swelling and macrophage recruitment can decrease ADC [40]. Imaging biomarkers derived from ADC were also leveraged to guide dendritic cell immunotherapy (mini-mum ADC [41] and percentage of voxels with decreasing ADC [42]). Therefore, the role of ADC in predicting response to ICM combined with angiogenesis inhibitors re-mains to be elucidated considering that each one of this two treatments in monotherapy have an opposite effect on ADC [39,43].
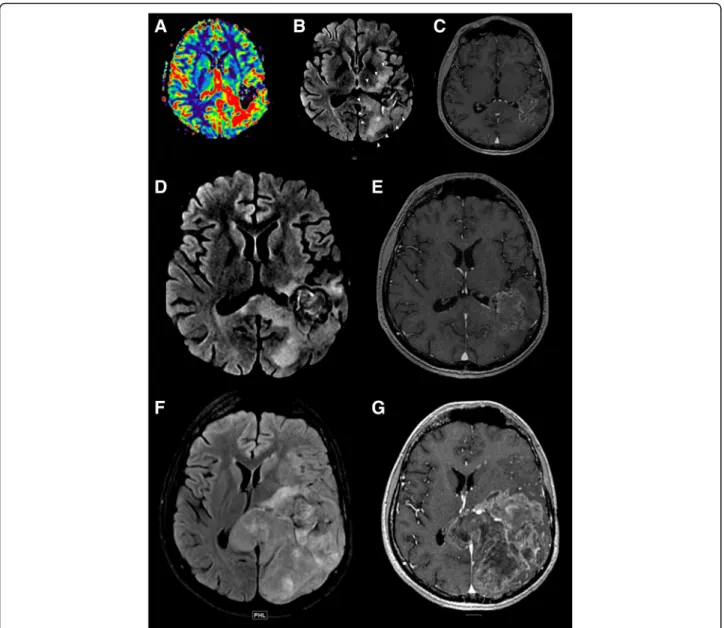
Fig. 2 Detection of a potential hyperprogression in a patient with glioblastoma. This case illustrates the potential risk of hyperprogression.
Imaging of an 18 year old patient with a diagnosis of glioblastoma treated with anti-PD-1. MRIs were obtained at 3-month intervals (baseline, a–e;
3 months, f, g). a–e Baseline T1 post-contrast MRI prior to immunotherapy and re-gamma knife therapy demonstrating an enhancing lesion with
increased perfusion. f, g MRI post-initiation of immunotherapy showing fast interval growth of the lesion, as well as a life-threatening mass effect. This case illustrates the potential life-threatening local complications of hyperprogression
Cellular density: fractional anisotropy (FA)
Fractional anisotropy is used in clinical research to estimate tissue viability and brain fiber integrity [44]. Interestingly, changes in fractional anisotropy appraise treatment efficacy and can occur as soon as 1 day after the initiation of cyto-toxic chemotherapies [38]. Although FA has not been in-vestigated in ICMs, a recent study on brain metastases has shown that FA reflects immune microenvironment activity. This could be leveraged in patients treated with ICM since higher T-cell infiltration co-localizes with white matter dis-ruption and a decrease in anisotropic diffusion [45]. A current drawback is that there are significant inter-observer and inter-structure variations in fractional anisotropy [46]. Membrane proliferation
Magnetic resonance spectroscopic imaging (MRSI) can estimate the concentration of a subset of specific
brain metabolites such as choline and creatinine. This technology is used to diagnose tumor tissue which is characterized by a high concentration of choline metabolites and low creatinine metabolites [37]. Creatinine reflects cellular integrity and is usually used to balance the lack of specificity of evaluating choline concentration alone. The inherent limitation of MRSI for the assessment of ICM is that membrane proliferation is a nonspecific process observed in neo-plastic and inflammatory diseases. Nevertheless, a piv-otal report demonstrated that choline imaging was more representative of the tumor volume than gado-linium enhancement in glioblastoma treated by intra-lesional immunotherapy [47]. There is therefore a rationale suggesting that a lesion with gadolinium enhancement without increased membrane
prolifera-tion suggests a “flare phenomenon” which usually
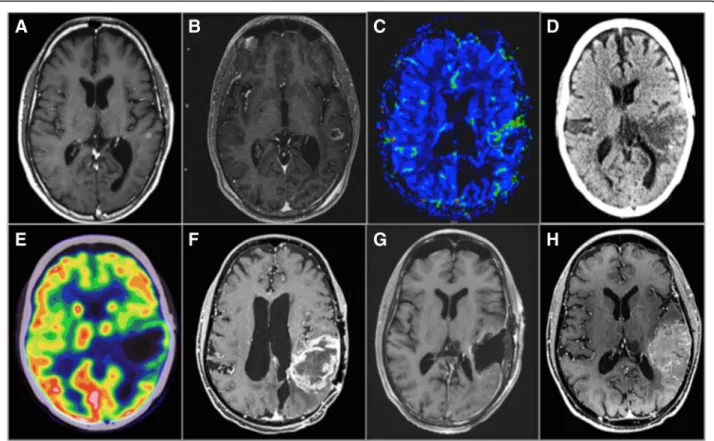
Fig. 3 Multimodal image-guided management in a PD-1, PD-L1, TILs glioblastoma. This case illustrates the potential interest of
pre-immunotherapy immuno-PET imaging biomarkers since the immune escaping environment (i.e., pathology was negative for PD-1, PD-L1 and, tumor infiltrating lymphocytes) explaining the insensitivity of this patient to immunotherapy was demonstrated only on the pathology
post-resection at the end of immunotherapy. Existing imaging techniques demonstrated treatment insensitivity (a–h) but were not able to decipher
the immune contexture for an early prediction of outcome. Imaging of a patient with recurrent glioblastoma in the left parietal lobe treated with combined immunotherapy (nivolumab) and re-gamma knife. MRIs were obtained at 3-month intervals. a Baseline T1 post-contrast MRI prior to immunotherapy and re-gamma knife therapy demonstrating a 6 × 5 mm enhancing lesion in the left parietal lobe. b MRI post-initiation of immunotherapy and pre-re-gamma knife therapy showing interval growth of the lesion. c MRI perfusion demonstrating growth and increased flow along the anterior margin of the tumor. d, e PET/CT demonstrating continued growth and increased FDG activity along the margin of the lesion. f Subsequent MRI demonstrating significant growth, increased peripheral nodular enhancement, and central necrosis. g Post-contrast MRI post-resection showing mild non-specific enhancement around the resection margin. h Follow-up MRI 7 months after resection demonstrating progression of disease
resolves within 3 months [48]. Clinical value in sys-temic ICMs has to be evaluated.
Angiogenesis and perfusion
Glioblastoma is among the most vascularized solid tu-mors. A wide range of advanced MRI sequences allows a comprehensive analysis of tumor angiogenesis: gadolin-ium contrast enhancement [49], perfusion-weighted imaging [36], dynamic contrast-enhanced magnetic resonance imaging (dynamic T1-weighted approach), arterial spin-labeling, or T2-weighted rapid echo-planar sequence (DSC-MRI). Arterial spin labeling (ASL) is a promising perfusion parameter using arterial blood pro-ton signals after magnetic labeling when gadolinium is not usable [50, 51]. Preliminary results suggested that this technology could be used in the future to optimize the management of the combination of antiangiogenic therapies, and ICMs which are currently investigated in most clinical trials (Table 1). Typically, effective antian-giogenic therapies induce a steroid-like effect, normalize blood-brain barrier permeability, and so decrease MR enhancement [52–54]. These parameters can also be used to differentiate immune system-induced inflamma-tion such as pseudoprogression (low cerebral blood volume) from true tumor growth (high cerebral blood volume) in glioblastoma patients treated with radiation therapy [55] or ICM [41]. Immunotherapeutics can also lead to an early increase in contrast enhancement, due to the inflammatory response [40]. In this case, pseudo-progression can be suggested if the neo-angiogenesis is absent on the perfusion sequences or the contrast enhancement is far from the initial lesion and within the radiotherapy field.
Hypoxia
The extremely poor prognosis of glioblastoma is mostly attributed to the high percentage of hypoxic niches in the tumor microenvironment. Functional MRI (blood ixygena-tion level-dependent or BOLD MRI, 19F-MRI, electron paramagnetic resonance) [56] is used to detect hypoxia in clinical research. A decrease in the fMRI activation volumes on BOLD fMRI adjacent to a glioblastoma was observed in aberrant neo-angiogenesis, with the resultant de-coupling of blood flow from neuronal activity [57]. Recent results suggest that functional MRI could play a significant role in the monitoring of antiangiogenic therapies [58] or ICMs [59]. Additionally, clinical trials using local T cell immuno-therapy (autologous primary human CD8+cytolytic T lym-phocytes) have demonstrated that MRI sequences can be used to detect a T-cell mediated necrosis. This pattern should be studied in depth in patients treated with systemic immunotherapy.
MRI biomarkers under investigation Techniques investigated in ongoing ICM trials Alternative contrast agents
Ferumoxytol is an ultrasmall superparamagnetic iron oxide used as an alternative contrast agent in patients with impaired renal function and is currently being investigated in ICMs (Table 1). It has as a unique feature, a prolonged intravascular residence time of more than 12 h because of its size and carbohydrate coating. The use of cerebral blood volume (CBV) mapping with ferumoxytol may help determine thera-peutic efficacy in a variety of brain tumors by differ-entiating highly vascular malignant tumor tissue from treatment-related neuro-inflammation, which corre-lates with survival [60–62].
Magnetic resonance fingerprinting
MRI acquisitions are often restricted to a qualitative
or “weighted” measurement and are almost never
quantitative. The same tissue can have different inten-sities in different data sets depending on several cofounding variables (e.g., type of scanner, type of de-tectors). Magnetic resonance fingerprinting (MRF) takes a different approach to data acquisition, post-processing, and visualization, by using a pseudorando-mized acquisition generating a unique signal evolution or “fingerprint” simultaneously representing all inves-tigated tissue properties [63]. MRF could thus provide highly specific and quantitative images and is cur-rently being investigated (Table1) [64].
Artificial intelligence-derived MRI biomarkers
There is a strong rationale suggesting that artificial intelligence (AI) could be used to optimize the manage-ment of patients with glioblastoma [65] (Table4). First, radiologists’ visual assessment does not use all informa-tion available in medical images. Second, treatment monitoring and strategies are increasingly complex. Radiomics is a fast-evolving field in medical imaging consisting in the extraction of high-throughput quantita-tive imaging features that characterize the inner organization of a tumor. The core assumption is that medical images contain quantitative information that could be used to optimize patient’s treatments. Thus, the computer can associate specific imaging traits to tumor characteristics, prognosis, optimal treatment, or tumor response (Table4). AI can even combine infor-mation from different imaging techniques to provide unique synthetic information analyzable by the clin-ician: one single quantitative probability map of “supervoxels” (Fig. 1 and 4). Theoretically, AI could be trained to identify patterns associated with re-sponses to ICM in monotherapy or in combination. However, there are limitations to AI approaches. The
Table 4 Current precision diagnosis and treatment approaches using radiomics on standard of care MRI sequences in patients with glioblastoma Year, Author Seque nce Training and Validation set Extracted radiomics features, selection , and statistical learning Biologic correlation and relevance 2008, Diehn T1, T1+ T2 T, 22 pts V, 110 pts -10 binary imaging traits (enhancem ent, necrosi s, mass effect, T2 edema, cortical involveme nt, SVZ involvement, C:N ratio, contrast/T2 ratio, T2 edema, T2 heterogene ity). -Unsu pervised hierarc hical cluste ring, Spearman rank-correlation coefficient . -Associations betw een angiogenesis, tumor hypoxia, and the contr ast enha ncement imagin g phenotype; proli feration gene-expressi on signature and mass effect ph enotype; EGFR prot ein overexpression and contrast: nec rosis imaging trait. 2011, Zinn FLAIR T, 26 pts V, 26 pts -Quant itative models of ed ema/invasion, enhanci ng tumor, nec rosis. -Compa rative marker selectio n, ingenui ty pathway analysis . -Imaging traits associated with upregu lation of mRNA invo lved in cellular migration/ inv asion (PERIOSTIN),which was seen to co rrelate with decreased survival. 2014, Rahman ADC-/ + T2/FLAIR T, 91 pts -6 variables extract ed from histograms of apparent diffus ion coefficient were measured at three times (bas eline, post-treatme nt and change) . -Cox proportional hazards model adjusted for clinical variables. -ADC histogra m analysi s within both enhan cing and nonenhancing componen ts of tumor can be used to stratify for PFS and OS in pat ients with recu rrent glioblastoma treated with Bevacizumab. 2014, Jamshidi T1, T1+ T2 Flas T, 23 pts -(1) infilt rative versus edemat ous T2 abnormal ity, (2) degree of co ntrast enhance ment, (3) necrosis, (4) supr aventricular zone (SVZ) invo lvement, (5) mass effect, and (6) contrast-to-necrosis ratio. -Resampli ng statis tics, analysis of variance, Pearson correlation co efficient. -Gene-to-trait associations were found such as co ntrast-to-necrosis ratio with KLK3 and RUNX3, SVZ involvement with the Ras oncogene family and the meta bolic enzyme TYMS, and vasogenic ed ema with the oncogene FOXP1 and PIK3I P1. 2015, Lee T1+F lair T, 65 pts -36 spatial habitat diversi ty (regi ons with distinct ly differ ent intensity chara cteristics) features based on pixel abu ndances w/in ROIs. -Overall coefficient of vari ation, symbolic regression method. -Association with OS and EG FR+ status -Could be a useful prognostic tool for MRIs of pat ients with gliobla stomas. 2016, Kickingerede r T1, T1+ Flair T, 112 pts V, 60 pts -4842 total -17 first-order features, 9 volume and shape features, 162 texture features. -Superv ised principal compo nent analysis , Cox proportion al hazard models, integrated Brier scores. -An 72-feature radiomics-based class ification of recu rrent glioblastoma permits the predicti on of tre atment outcome to antian giogenic therapy through PFS and OS. 2016, Kickingerede r T1+ Flair T, 79 pts V, 40 pts -12,190 indexes -Superv ised principal compo nent analysis . -An 11-feature radiomic signa ture allowed predict ion of PFS and OS, stratification of patients with newly diagn osed glioblastoma, and improved performa nce co mpared with that of establishe d clinical and radiologi c risk models. 2016, Grossmann T1+ FLAIR T, 144 pts (gene, 91 pts) -Volumetr ic features such as the nec rotic core, contrast enha ncement, abnorma l tumor volume, tumor-ass ociated edema, and total tumor volum e (TV), as well as ratios of these tumor compo nents. -Spearman rho, C-index, Noether test . -Association of imaging features with im mune respo nse pathways and apoptosis, signal transduction and protein folding processes, homeostasi s and cell cycli ng path ways, as well as OS. 2016, McGarry T1, T1+ ADC FLAIR T, 81 pts -Map co ntaining 81 (3 4) potential voxel-wise codes. A 4-digit code was assigned to each voxel. The digit order chosen was T1, ADC, T1+, and FLAIR. Codes ranged from 1111 (dark voxels on all images) to 3333. -Log-rank Kaplan-Meier survival analysi s, -Radiomic signa ture predicted poorer progno sis at tumor diagnosis in newl y diagn osed glioblastoma
Table 4 Current precision diagnosis and treatment approaches using radiomics on standard of care MRI sequences in patients with glioblastoma (Continued) Year, Author Seque nce Training and Validation set Extracted radiomics features, selection , and statistical learning Biologic correlation and relevance Cox proportional hazards mo del, combine d class ifier. 2017, Prasanna T1 FLAIR T2 T, 65 pts -402 radiomic features were ob tained for each region: enhancing lesion, peritumoral brain zone and tumor necrosis. -Redu ndancy maximum relevance fea ture selection , random forest (RF) classifier, threefold cross-validation. -Ten radiomic “peritumor al ” MRI features, suggest ive of intensity heterogeneit y and textural patterns, were predictive of survi val on treatment-naï ve pre-operati ve glioblastoma. 2017, Yu FLAIR T, 110 pts V, 30 pts -671 high-throughput features were extracte d from grade II glioma. -Classif ication by support vector machine and AdaBoost, leave-one-out cross-validation. -110 features were selected for the noninva sive IDH1 status estimation of grad e II glioma. 2017, Xi T1, T1+ T2 T, 98 pts V, 20 pts -1665 imaging features -Redu ced using LASSO regularization, classification by support vector machine. -The best classification system for predicting MGM T promoter methylation status in preoperative glioba stoma originated from the combinat ion of 36 T1, T2, and enha nced T1 images features. 2017, Kickingerede r T1, T1+ FLAIR T2 T, 120 pts V, 60 pts -1043 imaging features -Penalized Cox mo del with 10-fold cross-validation. -The 8-feature radiomic signature increased the prediction accuracy for PFS and OS beyo nd the assesse d molec ular, clinical, and standa rd imaging pa ramete rs in newly diagnosed glioblastoma prior to standa rd-of-care treatmen t. 2017, Li T1+ T, 96 pts -555 im aging features -Stud ent ’s tests (t test) -Glioblastoma in different age groups (< 45 and ≥ 45 years old) presen t different radiomics-fea ture patterns, suggesting differ ent pathologic, pro tein, or genic origin s. -101 features show ing the consiste ncy with the age grou ps, and unsupervised clustering results of thos e fea tures also show coherence with the age difference . 2017, Grossmann T1+ FLAIR T, 126 pts V, 165 pts -65 imaging features from T1 and FLAIR scans at baseline (pretreatmen t) and follow-up after 6 weeks (post treatment initiation) -Unbiased unsupervised feature selection (PCA), selection of variant features (coefficient of variation). -Mini mal redundancy maximal relevance algorithm, Cox proportion al hazards model for PFS or OS. -Multivariable analysi s of features derived at base line imaging resulted in significant stratification of OS and PFS. -These stratifications were stronger compar ed with cl inical or volumetric covariat es prognostic value for survi val and progr ession in pat ients with recu rrent gliobla stoma receiving bevacizumab treatment. 2017, Kanas T1+ FLAIR T, 86 pts -10 quan titative variable s and 24 qualitative vari ables were calculate d from the volum es of three distinct regions: edema/invasion, tumor enhance ment (tumor), and necrosis. -Isometric feature mapping, locally linear embeddin g, Laplacian eigenmaps , linear discriminant analysis, factor analysis, principal co mponents analysis, stochast ic proximity embeddin g, random fore st, k-nearest neighbors, Gaussi an naive Bayes, and the J48 tre e. -The status of MGMT promoter me thylation was predict ed with an accuracy of up to 73.6%. -Experimental analysis showed that the ed ema/ nec rosis volume ratio, tumor/necrosis volum e ratio , ed ema volum e, and tumor location and enha ncement charact eristics were the most signifi cant vari ables in respe ct to the status of MGMT promot er methyla tion in gliobla stoma. 2010, Drabycz T1+ T2 FLAIR T, 59 pts -4 visual qualitative texture features (cysts, ring/nodular enhance ment, margins, homogeneit y), volume, 11 regions/sectors features and space –frequenc y texture analysis based on the S-transform. -Two-wa y repeate d-measures analysis of vari ance (ANOVA) test s. -Ring enha ncement assessed visually is significantl y assoc iated with unmethylate d MGMT promoter statu s. -Texture features on T2 images assessed by the space – frequency analysis were significantly different between methylated and unmethylated cases. Flas fast low-angle shot, OS overall survival, PFS progression free survival, MGMT O6-meth ylguanine-DNA-m ethyltransferase, IDH isoc itrate deshydrog enase
major drawback is that building a reliable predictive model with AI requires a large amount of well-anno-tated clinical and imaging data to avoid overfitting. In the field of glioblastoma imaging, we can assume that the use of AI will therefore be first restricted to the use of MRI in standard of care therapies.
Machine-learning algorithms and AI signatures were trained to predict overall survival in patients with solid tumors treated with ICM based on pretreatment-im-aging biomarkers. These biomarkers, predictors of poorer outcomes, can be macroscopic such as the pres-ence of a higher tumor burden and sarcopenia [66] or microscopic such as an AI-signature estimating CD8 cell counts and predicting clinical outcomes of patients treated with immunotherapy [67]. One of the most promising fields is the evaluation of intrinsic glioblast-oma heterogeneity, which is due to the coexistence of distinct sub-clones and also regional intrinsic plasticity shaped by tumor microenvironment [68]. In addition, it exists also an important inter-tumor heterogeneity with variable expression levels of surface biomarkers [69]. These phenotypic heterogeneities explain treatment re-sistances developed by glioblastoma. AI can be trained to decipher spatial and temporal glioblastoma hetero-geneity which is a major driver of the poor prognosis of glioblastoma patients [70]. On a larger perspective, tumor heterogeneity evolution in space and time under immune selection is the major obstacle to personalized-medicine and biomarker development [71].
The use of AI in glioblastoma patients is primarily in the field of diagnosis and treatment plan. The vast ma-jority of current studies (Table4) used standard of care MRI sequences and combined several features extracted
from both unenhanced and enhanced sequences [72]. The typical radiomics pipeline involved the delineation of the tumor on medical images, then the calculation of imaging features in this volume of interest (i.e., using mathematical formulas defined a priori or identified dir-ectly by the computer using deep-learning) and finally the creation of prognostic or predictive models using these features. AI identified several signatures associated with methylation [72, 73], age-related patterns [74] and prognosis factors [75,76].
Few studies explored AI to guide treatment monitoring and follow-up: AI identified patterns associated with treat-ment response [77, 78] such as enhancement patterns in antiangiogenic therapies [77]. Since the majority (83%) of centers prefer to undertake qualitative assessments of re-sponse rather than using RANO criteria [4], AI could be used to standardize evaluations across institutions rather than relying on the interpretation of expert radiologists which is inherently subjective.
Limitations of conventional non-immune-specific PET biomarkers
PET imaging is the procedure of choice for image-based quantification of biological processes (Table 3), as it pro-vides at least three main advantages compared to MRI in this setting specifically: (1) its detection sensitivity is more than 103 times higher, (2) the direct proportionality be-tween the PET numerical signal and biological tracers’ concentration allows powerful image-based quantification, and (3) finally the possibility to combine any biological vector of interest to a radiomarker has virtually no limits. However, radiochemistry capabilities, availability, and cost of several radiotracers remain major limitations.
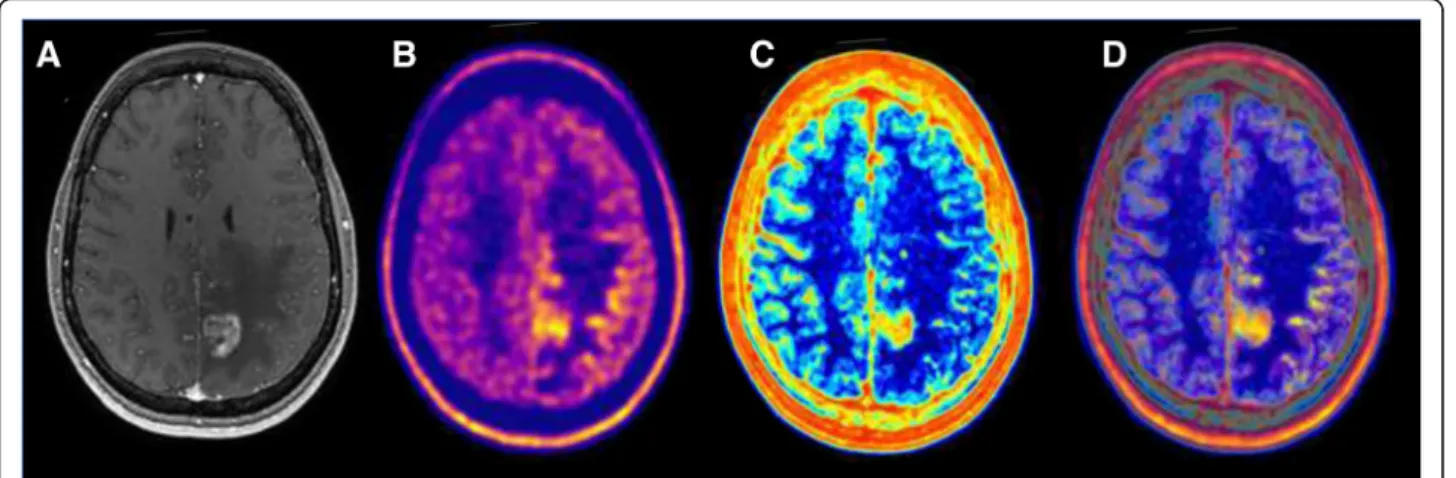
Fig. 4 Multimodal image-guided management using artificial intelligence in glioblastoma. This case illustrates the potential interest of imaging biomarkers extracted using artificial intelligence. Imaging of a patient with glioblastoma. a Baseline T1 post-contrast MRI prior to therapy demonstrating an enhancing lesion. b Baseline 18F-Dopa PET showing an increased amino acid uptake outside of the enhancing lesion on MRI. c Analysis of the MRI by artificial intelligence demonstrating areas with high heterogeneity (red) and low heterogeneity in normal healthy brain tissue (blue). This map is a parametric map of local entropy computed using the baseline T1 post-contrast MRI. The only limit in the analysis of the local heterogeneity/entropy is that contours/edge/interface are always heterogeneous. d Fused image of the Baseline 18F-Dopa PET (b) and of the parametric map of local entropy (c)
Glucose metabolism
Increased glucose consumption is a hallmark of can-cers [79], but the critical role of glycolysis in the function of many immune cells has also resulted in
18
F-FDG PET being used to measure immune re-sponses. Although increased 18F-FDG PET uptake is observed in high-grade tumors [80], poorer prognosis [81], and anaplastic transformation [82] (Fig. 3), the lack of specificity of glucose consumption [83] makes its applications uncertain for the assessment of
glio-bastoma response to ICM in monotherapy [84].
Moreover, recent researches have shown that FDG accumulates mostly in innate immune cells, and so
18
F-FDG PET seems to be more useful in evaluating the effects of therapies that target inflammatory me-diators than in monitoring cell expansion [85]. How-ever, high FDG-uptake could be used in combination therapies to predict radiation therapy failure [86], antiangiogenic failure [87], and poorer outcome, as well as tumor recurrence [82].
Amino acid metabolism
The growth of proliferating glioblastoma cells relies on a large neutral amino acid transport system. These amino acids are used as the natural building blocks of proteins and to detect high-grade tumors. The most frequently used radiolabeled amino acid are18F-FET (fluor-18 Fluoro-ethyl-L-tyrosine) [88, 89], 11C-methionine, alpha-11C-L -methyl-tryptophan (AMT) [90], and18F-FDOPA [91,92]. The use of amino acids could provide a breakthrough in the evalu-ation of response to ICM therapies in monotherapy or combinations [93]. Indeed, amino acid uptake is independ-ent of regional tumor perfusion and blood-brain barrier permeability, and the large neutral amino acid transport system is specifically overexpressed by tumor cells [89,94] regardless of the breakup of the blood-brain barrier con-trary to MRI and gadolinium-enhancement [95]. An early decrease in PET amino acid uptake outperformed MRI for early prediction of recurrence [88], outcome [96], and re-sponse to chemotherapy, bevacizumab, or VEGF inhibitor [97].18F-FET PET detected pseudoprogression in glioblast-oma treated with bevacizumab [98], as well as in melanoma brain metastasis treated with ICMs [99]. The main limita-tion for response assessment in glioblastoma patients treated with ICMs is the lack of prospective data.
DNA synthesis
An increased cellular proliferation rate is a hallmark of malignancy and requires DNA synthesis. Nucleoside an-alogs such as 18F-FLT (3′-(18 F)-Fluoro-3′-deoxythymi-dine) [100] are phosphorylated and trapped in cells synthesizing DNA [101]. Consequently, 18F-FLT uptake is associated with a high signal to noise ratio (i.e., low uptake in normal brain tissue), and strongly correlated
to cellular proliferation (i.e., Ki-67) in brain tumors [102]. The main advantage is the possibility of dynamic evaluation of the kinetics of the radiotracer biodistribu-tion. The limitations are that FLT uptake in brain tissue requires a disruption of the blood-brain barrier and is increased by inflammation [101]. Clinical value in ICMs has not been evaluated although there is a rationale sug-gesting that 18F-FLT PET could be useful for response evaluation since it is a surrogate marker of angiogenesis and proliferation [52]. An early decrease in18F-FLT up-take [103] predicted prolonged survival in patients treated with bevacizumab plus Irinotecan.
Membrane proliferation
18
F-fluorocholine is a widely available PET tracer that is a small precursor molecule for the synthesis of mem-brane phospholipids. 18F-fluorocholine PET can predict early response in glioblastoma treated with radiotherapy and temozolomide [104]. Clinical value in ICMs has not been evaluated. However, the limitation is that choline is increased in inflammatory processes (false positives) [105], and its brain uptake is strongly affected by distur-bances of the blood-brain barrier observed in high-grade gliomas [106].
Angiogenesis and perfusion
H215O PET remains the reference standard for cerebral blood flow evaluation [107], however, its use is not pos-sible without a cyclotron on site (half-life of 15O = 2 min), making its use not possible in clinical practice. Novel PET tracers are in development such as integrins that are glycoproteins involved in cell-to-matrix relation-ships[108], which can be evaluated by PET (18
F-AlF-NOTA-PRGD2 PET, 18F FPPRGD2 PET). The literature
about radiolabeled integrin is scarce. Integrins were used to diagnose glioblastoma and predicted early response to conventional treatment and bevacizumab failure [109] and therefore could be used to evaluate ICM in combin-ation therapies.
Hypoxia
Hypoxia promotes an immunosuppressive environment, therapy resistance, and disease recurrence [10, 110]. Hypoxia can be detected using specific PET radiotracers such as 15Oxygen, 18F-Fluoromisonidazole (18F-FMISO) [111], and 18 F-1-(5-fluoro-5-deoxy-α-D-arabinofurano-syl)-2-nitroimidazole (18F-FAZA). The main limitation is that the signal to noise ratio of PET radiotracers target-ing hypoxia is low compared to normal brain tissue. Increased hypoxia measured by 18F-MISO PET can be used in treatment planning since it predicted shorter survival and could be used in radiotherapy planning to boost treatment in hypoxic and potentially radio-resist-ant areas.18F-FMISO could play a significant role in the
monitoring of bevacizumab therapy [58], as well as in the monitoring of ICMs [59] since aberrant hypoxic
neo-vascularity is associated with immunosuppressive
environments. Mitochondrial activity
The mitochondrial translocator protein (TSPO) is over-expressed in activated microglia [112]. TSPO have been mostly developed to investigate neuroinflammatory pro-cesses. The main limitations are that they are not yet available in daily practice and there are nonoptimal im-aging properties since its uptake in glioblastoma lesions is more likely to be due to simple breakdown of the blood-brain barrier. TSPO was only evaluated in diag-nostic settings and was never evaluated for response as-sessment.18F-GE-180 is a novel third generation TSPO receptor ligand with high binding affinity compared to existent radiotracers and with better diagnostic perfor-mances than MRI [113].
Somatostatin receptors
Somatostatin receptor (SSTR) expression can be measured by scintigraphy or PET [114]. In the ma-jority of glioblastomas, the expression of SSTR2 is negative (the most commonly expressed is SSTR5) [115]. Theoretically, the expression of SSTR2 by acti-vated immune cells such as leukocytes and macro-phages could be detected and used to characterize the inflammatory infiltrate in patients treated with ICM [116]. However, a limitation of this approach is that the disruption of the blood-brain barrier in high-grade gliomas may increase somatostatin recep-tor ligand uptake.
Immune-specific PET biomarkers under investigation
Rationale
Glioblastoma is a heterogeneous immunosuppressive microenvironment. While ICMs aim to restore tumor elimination by immune cells, to date imaging techniques used in clinical routine and in research have mainly fo-cused on tumor cells rather than the immune environ-ment. Nonetheless, the immune context, which is determined by the density, composition, functional state, and organization of the leukocyte infiltrate of the tumor, predicts the efficacy of ICMs. Although this immune contexture can be used to predict prognosis and treat-ment response and undergoes temporal changes in case of immune responses, it is not being evaluated by current clinical trials (Table1).
In the future, the strategy could shift to substitute non-specific imaging biomarkers by immune-specific biomarkers. Innovations in chemistry allowed to produce radiotracers targeting PD-1 or PD-L1
(lymphocytic exhaustion) [117], CD8 (cytotoxic lym-phocytes) [118], or IL2 (activated lymphocytes) [119]. This whole body in vivo assessment of the density of receptors and ligands involved in lymphocyte activa-tion might provide more comprehensive informaactiva-tion
than ex vivo immunohistochemistry provided by
single biopsy samples. There are indeed various publi-cations showing the promising results of immuno-PET [120] using antibodies, diabodies, or small mole-cules (Table 1).
Radiolabeled ICM: PD-(L)1
There is a strong rationale suggesting that the prom-ising group of radiotracers targeting PD-1 or its ligand ((L)1) will be increasingly used. First, PD-(L)1 PET could guide treatment planning. Although these radiotracers do not discriminate PD-L1 expres-sion on tumor cells and immune cells, PET can
quan-tify non-invasively tumor heterogeneity. As a
comparison, the current reference standard is immu-nohistochemistry which allows evaluating PD-L1 ex-pression on tumor cells and immune cells on a biopsy sample. However, immunohistochemistry is an invasive technique, which is limited by the temporal and spatial heterogeneity of glioblastoma’s PD-L1 ex-pression [121]. Second, PD-(L)1 PET could be used to monitor and predict ICM efficacy. In animal models, an effective immunoradiotherapy increases the expres-sion of PD-1 and tumor infiltration by PD-1+ lym-phocytes [122]. Finally, these radiotracers could be used to evaluate in vivo the pharmacokinetics and biodistribution of ICM.
PD-(L)1 imaging is being investigated prospectively in several clinical trials in melanoma, NSCLC, breast, and bladder cancers but not in patients treated with glioblastoma. Current radiotracers include the high-affinity engineered protein scaffold (HAC-PD-1) that can detect human PD-L1 expression 1 h after injec-tion [123], anti-PD-L1 antibodies [122, 124, 125], anti-PD-1 antibodies [122, 126], and small non-anti-bodies PD-L1-specific peptides [127, 128]. The
radi-olabeling of these agents used either positron
emitters or single-photon emitters such as 64Cu
[122], 89Zr [125], 18F [128], 111In [124], and 99mTc [127].
There are currently two different strategies for PD-(L)1 imaging. On the one hand, PD-PD-(L)1 anti-bodies can accumulate in tissue but suffer from lower tumor penetration, long retention in the blood pool, and poor signal to noise ratio. Additionally, higher doses need to be injected and imaging must be per-formed several days after injection [117, 122]. On the other hand, non-antibody small molecules with high affinity for PD-L1 allow an efficient penetration in to
the tumor, as well as high signal-to-noise ratios. Imaging can therefore be performed within a few hours after injection and requires lower activities, and there is a faster clearance by the kidneys [127].
CD8 imaging
Cluster of differentiation 8 (CD8) is a transmembrane glycoprotein and a co-receptor for the T cell receptor (TCR), which is specific to class I MHC proteins. MHC class I displays fragments of non-self-peptides derived from cytosolic proteins, which will trigger an immediate response from the immune system against tumor cells [129]. There is a strong rationale demonstrating that high intratumor CD8 expression is associated with better outcome and could be used to predict or monitor ICM treatment efficiency.
Radiolabeled PET agents have been developed to target and identify CD8 in vivo [130] but are not yet used in human research. Alternatively, MRI imaging of CD8+ T-Lymphocytes recruitment was investigated in an experimental mice model. CD8+ T-lymphocytes labeled with superparamagnetic iron oxide accumu-lated in the tumor 24 h after injection [131]. The limitation of MRI tracking is the quantity of super-paramagnetic necessary to obtain a good signal while PET radiotracers require nonpharmacologic doses. Tumor-associated macrophages imaging
Tumor-associated-macrophages (TAMs) are major com-ponents of glioblastoma microenvironment and overex-press the immunosupoverex-pressive PD-1 ligand [132, 133]. There are two subpopulations and two phenotypes of TAMs. The subpopulations include microglia and monocyte-derived macrophages[133], and two pheno-types have been described: M1 and M2. An increased number of TAMs with a M2-like phenotype is associated with a poorer prognosis [134] and promotes tumor angiogenesis and immune-suppression [135]. Imaging biomarkers targeting specifically TAMs could be lever-aged to guide precision approaches in patients treated with ICM in monotherapy or in combination since mac-rophages are becoming an increasingly important target for cancer therapy.
Several strategies were developed to detect the pres-ence of TAMs in vivo [136]. First, activated macro-phages are extremely FDG avid and can be detected by FDG PET, but there is a need for more specific bio-markers in glioblastoma patients [83]. Second, CD206 is a receptor overexpressed on M2 macrophages which can be detected through single-photon emission
com-puted tomography (SPECT) imaging (99mTc-labeled
anti-CD206 and 125I-αCD206) and optical imaging
(Dye-αCD206) [135]. SPECT and infrared fluorescence
imaging using an anti-CD206 monoclonal antibody were used as early biomarkers to predict post-chemo-therapy tumor relapse [135]. Third, gadolinium tagged with a fluorescent poly (l-glutamic acid) was used to detect TAMs in rat glioma model since it is co-local-ized with CD68 (a marker for macrophages) and CD169 (marker for activated macrophages) [137]. Interleukin-2 imaging
Activated T lymphocytes, especially CD4+ and CD8+ Th1 (T helper) lymphocytes, produce Interleukin-2 (IL-2). This cytokine produced after antigen stimulation plays pivotal and complex roles in both the immune response and limit-ing inappropriate immune reactions. IL-2 mediates diverse pleiotropic actions, promoting T cell proliferation, survival, cytolytic activity, NK cell activity, development of regulatory T cells, and activation-induced cell death [138]. Because IL-2 is a cornerstone in the immune environment, radiola-beled agents are developed to target and identify interleukin 2 in vivo [119]. These new biomarkers could be useful in ICMs.
Other biomarkers of inflammation
Many PET radiotracers are available to characterize specific components of the inflammatory process [139]: neovascularization (18F-RGD targeting αvβ3),
Cyclooxygenase (11C-celecoxib), matrix metallopro-teinase (18F-CGS27023A), microglia (11C-GW405833
targeting CB2R, 64Cu-DOTA-etanercept targeting
TNFR, 18F-DPA-714 targeting TSPO), neutrophils
(64Cu-PEG-cFLFLFK targeting FPR, 18F-FDG trans-ported by glut), B cells (124I-rituximab targeting CD20, 18F-FDG transported by glut), T cells (18 F-FB-IL2 targeting F-FB-IL2R, 18F-FDG transported by glut), and macrophages (68Ga-DOTA-TOC targeting SSTR, 18 F-FDG transported by glut, 64Cu-DOTA-etanercept tar-geting TNFR, 18F-RGD targeting αvβ3, 18F-DPA-714
targeting TSPO). These radiotracers seem promising for detecting the inflammatory process and could be used to decipher immune contexture or identify pseudoprogression.
Conclusion and perspectives
This review summarizes perspectives on the emerging trends in medical imaging for optimizing treatments in glioblastoma patients treated with CTLA4 and anti-PD-1 agents in monotherapy or in combination, as well as on the potential biomarkers that might improve the early identification of patients that will benefit from those treatments.
Evaluating the efficacy of ICMs is challenging because it triggers new radiological patterns of response and pro-gression such as hyperpropro-gression, pseudopropro-gression, abscopal effect, and immune-related adverse events.
Immunotherapy response assessment for neuro-oncol-ogy (iRANO) criteria [3], define a“wait and see strategy” for progressive patients treated with ICMs in monother-apy. However, a recent survey demonstrated that a
mi-nority of centers use RANO criteria [4], and we
observed that a minority of clinical trials implemented iRANO criteria (Table 1). This lack of quantitative as-sessment demonstrates the need for standardized evalu-ation and the development of quantitative algorithms for robust response assessments.
Our review listed studies using MRI and PET tech-niques and demonstrates that there is a lot of noise in the current heterogeneous literature. Our insight and impression is that future prospective clinical work is still needed and that the most promising im-aging modalities are standard of care MRI, aminoa-cid PET, and immunoPET. Additionally, the major concrete recommendation from our review is that the optimal imaging modality related to these im-aging challenges in clinical routine remains MRI since it is the only technique with sufficient clinical evidences and with specific immune-related evalu-ation criteria (iRANO). The limitevalu-ation of all
ad-vanced MRI techniques is indeed the lack of
standardization and robustness combined with a dis-ease where biopsy confirmation is difficult and biased, making it very difficult to recommend other options than further studies are recommended. A main limitation for PET tracers is transport across the blood-brain barrier. This has limited to perman-ently establish them for clinical use since the tumor is simply not detected with sufficient sensitivity. This includes most of the tracers mentioned. Nonetheless, specific tracers such as amino acid tracers have po-tential value since amino acid transport is independ-ent from the intact or disrupted blood-brain barrier. The level of evidence of data presented in the litera-ture remains speculative. All these points need to be clarified by future researches.
The most promising field is the use of new bio-engineering techniques, which allow the targeting of probes deciphering the immune contexture, while datamining techniques and artificial intelligence will fully exploit and quantify the existing information from conventional imaging techniques. Further devel-opment of the new concept of supervoxels could capitalize and combine these two approaches, thereby redefining medical imaging as a comprehensive and quantitative decision tool characterizing the tumor and its environment. Artificial intelligence could excel in combining all this information and extract syn-thetic quantitative probability guiding the decision to start, continue or stop ICM in monotherapy or combination.
Abbreviations
18F-FDOPA:18F-fluorodopamine;18F-FET:18
F-Fluoro-ethyl-L-tyrosine;18
F-FLT: 3′-(18F)-Fluoro-3′-deoxythymidine;18F-FMISO:18F-Fluoromisonidazole;
ADC: Apparent diffusion coefficient; BBB: brain barrier; BOLD: Blood-oxygen level dependent; CBF: Cerebral blood flow; CBV: Cerebral blood volume; Cho: Choline; Cr: Creatinine; CTLA-4: Cytotoxic T-lymphocyte antigen-4; DCE: Dynamic contrast-enhanced; DNA: Deoxyribonucleic acid; EGF: Epithelial growth factor; FDG: Fluorodeoxyglucose; ICM: Immune checkpoint modulators; IDH: Isocitrate dehydrogenase; IL: Interleukin; MGMT: O6-methylguanine-DNA-methyltransferase; MHC: Major histocompatibility complex; MRI: Magnetic resonance imaging;
MRSI: Magnetic resonance spectroscopic imaging; NAA: N-Acetyl-Aspartate; PD-1: Programmed death 1; PD-L1: Programmed death-ligand 1;
PET: Positron-emission tomography; RANO: Response assessment for neuro-oncology; TAMs: Tumor-associated-macrophages; TSPO: Translocator protein; VEGF: Vascular endothelial growth factor
Acknowledgements NA.
Authors’ contributions
All authors contributed to the writing and editing of the manuscript. All authors approved the final content of this manuscript.
Funding
LD work was funded by a grant from Fondation Philanthropia, Geneva, Switzerland, and the Fondation Nuovo-Soldati.
Availability of data and materials NA.
Ethics approval and consent to participate
This article does not contain any studies with human participants or animals performed by any of the authors.
Consent for publication The authors consent for publication. Competing interests
The authors declare that they have no competing interests. Author details
1
Department of Imaging Nuclear Medicine, Institut Claudius Regaud—Institut Universitaire du Cancer de Toulouse—Oncopole, Toulouse, France.
2
Département de médecine oncologique, Gustave Roussy, Université Paris-Saclay, 94805 Villejuif, France.3Department of Biophysics and Nuclear
Medicine, Bicêtre University Hospital, Assistance Publique-Hôpitaux de Paris, 78 rue du Général Leclerc, 94275 Le Kremlin-Bicêtre, France.4IR4M–UMR
8081, CNRS, Université Paris Sud, Université Paris Saclay, Orsay, France.
5Département d’imagerie médicale, Gustave Roussy, Université Paris-Saclay,
94805 Villejuif, France.6INSERM U894, Service d’imagerie morphologique et fonctionnelle, Hôpital Sainte-Anne, Université Paris Descartes, 1, rue Cabanis, 75014 Paris, France.7Department of Radiology, New York Presbyterian Hospital—Columbia University Medical Center, New York, NY 10039, USA.
8
Service de Médecine Nucléaire, AP-HP, Hôpital La Pitié-Salpêtrière, Sorbonne Université, 75013 Paris, France.9Département d’imagerie médicale, CHU
Rangueil, Université Toulouse Paul Sabatier, Toulouse, France.10UMR1015, Institut Gustave Roussy, Université Paris Saclay, 94800 Villejuif, France.
Received: 21 March 2019 Accepted: 19 July 2019
References
1. Stupp R, Hegi ME, Mason WP, van den Bent MJ, Taphoorn MJB, Janzer
RC, et al. Effects of radiotherapy with concomitant and adjuvant temozolomide versus radiotherapy alone on survival in glioblastoma in a randomised phase III study: 5-year analysis of the EORTC-NCIC trial.
Lancet Oncol. 2009;10:459–66.
2. Pardoll DM. The blockade of immune checkpoints in cancer