HAL Id: hal-00301291
https://hal.archives-ouvertes.fr/hal-00301291
Submitted on 22 Oct 2003HAL is a multi-disciplinary open access
archive for the deposit and dissemination of sci-entific research documents, whether they are pub-lished or not. The documents may come from teaching and research institutions in France or abroad, or from public or private research centers.
L’archive ouverte pluridisciplinaire HAL, est destinée au dépôt et à la diffusion de documents scientifiques de niveau recherche, publiés ou non, émanant des établissements d’enseignement et de recherche français ou étrangers, des laboratoires publics ou privés.
Assessment of possible airborne impact from nuclear
risk sites ? Part II: probabilistic analysis of atmospheric
transport patterns in Euro-Arctic region
A. G. Mahura, A. A. Baklanov
To cite this version:
A. G. Mahura, A. A. Baklanov. Assessment of possible airborne impact from nuclear risk sites ? Part II: probabilistic analysis of atmospheric transport patterns in Euro-Arctic region. Atmospheric Chemistry and Physics Discussions, European Geosciences Union, 2003, 3 (5), pp.5319-5356. �hal-00301291�
ACPD
3, 5319–5356, 2003
Assessment of possible airborne impact from nuclear
risk sites – Part II
A. G. Mahura and A. A. Baklanov Title Page Abstract Introduction Conclusions References Tables Figures J I J I Back Close
Full Screen / Esc
Print Version Interactive Discussion
Atmos. Chem. Phys. Discuss., 3, 5319–5356, 2003 www.atmos-chem-phys.org/acpd/3/5319/
© European Geosciences Union 2003
Atmospheric Chemistry and Physics Discussions
Assessment of possible airborne impact
from nuclear risk sites – Part II:
probabilistic analysis of atmospheric
transport patterns in Euro-Arctic region
A. G. Mahura1, 2 and A. A. Baklanov1
1
Danish Meteorological Institute, DMI, DK-2100, Copenhagen, Denmark
2
Institute of the Northern Environmental Problems, INEP, Kola Science Centre, Apatity, 184200, Russia
Received: 21 July 2003 – Accepted: 1 October 2003 – Published: 22 October 2003 Correspondence to: A. G. Mahura (mahura@dmi.dk)
ACPD
3, 5319–5356, 2003
Assessment of possible airborne impact from nuclear
risk sites – Part II
A. G. Mahura and A. A. Baklanov Title Page Abstract Introduction Conclusions References Tables Figures J I J I Back Close
Full Screen / Esc
Print Version Interactive Discussion
Abstract
The probabilistic analysis of atmospheric transport patterns from most important nu-clear risk sites in the Euro-Arctic region is performed employing the methodology devel-oped within the “Arctic Risk” Project of the NARP Programme (Baklanov and Mahura, 2003). The risk sites are the nuclear power plants in the Northwest Russia, Finland,
5
Sweden, Lithuania, United Kingdom, and Germany as well as the Novaya Zemlya test site of Russia. The geographical regions of interest are the Northern and Central Eu-ropean countries and Northwest Russia.
In this study, the employed research tools are the trajectory model to calculate a multiyear dataset of forward trajectories that originated over the risk site locations, and
10
a set of statistical methods (including exploratory, cluster, and probability fields analy-ses) for analysis of trajectory modelling results. The probabilistic analyses of trajectory modelling results for eleven sites are presented as a set of various indicators of the risk sites possible impact on geographical regions and countries of interest.
The nuclear risk site possible impact (on a particular geographical region, territory,
15
country, site, etc.) due to atmospheric transport from the site after hypothetical ac-cidental release of radioactivity can be properly estimated based on a combined in-terpretation of the indicators (simple characteristics, atmospheric transport pathways, airflow and fast transport probability fields, maximum reaching distance and maximum possible impact zone, typical transport time and precipitation factor fields) for different
20
time periods (annual, seasonal, and monthly) for any selected site (both separately for each site or grouped for several sites) in the Euro-Arctic region. Such estimation could be the useful input information for the decision-making process, risk assessment, and planning of emergency response systems for sites of nuclear, chemical, and biological danger.
ACPD
3, 5319–5356, 2003
Assessment of possible airborne impact from nuclear
risk sites – Part II
A. G. Mahura and A. A. Baklanov Title Page Abstract Introduction Conclusions References Tables Figures J I J I Back Close
Full Screen / Esc
Print Version Interactive Discussion
1. Introduction
A number of nuclear risk sites (NRSs) having nuclear reactors, weapons, and radioac-tive wastes and posing concern for the population are situated in the Northern Eu-rope territories. Among these is the Northwest Russia, where there are about 180 nuclear reactors in operation, 140 reactors are waiting to be decommissioned, more
5
than 10 storage sites for radioactive waste containing large amounts of spent nuclear fuel (Bergman and Baklanov, 1998). “The State of the Arctic Environment” report of the Arctic Monitoring and Assessment Programme (AMAP, 1998) had emphasized: “there are considerable shortcomings in the analysis... that allow conclusions to be drawn about the probability and consequences of potential accidents in the nuclear power
10
plants in the Arctic”. This report gave the following recommendation: “More author-itative and comprehensive evaluations should be made for the risk posed to human health and the environment by accidents in nuclear power installations. Assessments of the risk of releases of radionuclides and the radiological consequences for humans and the environment should be performed for all existing nuclear installations in, and
15
near, the Arctic”.
The main aim of our study is the following. First, it is testing of the methodology for evaluation of the atmospheric transport of radioactive pollutants from the nuclear risk sites (NRSs) on different geographical regions, territories, countries, etc. Second, it is combining of the atmospheric transport modelling and statistical analyses to evaluate
20
possible impact due to atmospheric transport from accidental releases at NRSs located in the Euro-Arctic region. The main purpose of our study is a probabilistic analysis of atmospheric transport patterns from selected sites for further GIS-based studies of vulnerability to radioactive deposition and risk assessment of the NRS impact on the environment and population.
25
The risk sites of concern (in total 11) located in the European countries and Russia (Fig. 1) are the nuclear power plants (NPPs) and former nuclear weapons test site. The geographical regions and countries of interest are the Northern and Central European
ACPD
3, 5319–5356, 2003
Assessment of possible airborne impact from nuclear
risk sites – Part II
A. G. Mahura and A. A. Baklanov Title Page Abstract Introduction Conclusions References Tables Figures J I J I Back Close
Full Screen / Esc
Print Version Interactive Discussion
countries and Northwest Russia. In this study several research tools developed within the “Arctic Risk” Project (AR-NARP, 2001–2003; Baklanov and Mahura, 2001; Mahura, 2001; Mahura and Baklanov, 2002; Baklanov et al., 2002b) were applied. Baklanov and Mahura (2003) noted that for assessment of risk and vulnerability it is important to consider a set of various social-geophysical factors and probability indicators. These
5
depend on the geographical location of the area of interest and structure of its popu-lation. Thus, for estimation of the potential nuclear risk and vulnerability levels for the nuclear risk sites it will be important to know:
– Which geographical regions are the most likely to be impacted?
– What are the fast, average, typical times and their probabilities for atmospheric 10
transport from NRSs to neighbouring countries?
– What are precipitation probability and contribution during atmospheric transport
for various atmospheric layers and over different geographical territories?
– What are temporal (annual, seasonal, and monthly) and spatial variability for the
above mentioned characteristics?
15
2. Selected approaches
The suggested methodology by Baklanov and Mahura (2003) mentioned several re-search tools and approaches, which could be applied for the probabilistic atmospheric studies. The main focus of this paper will be only on a consideration of the trajectory modelling approach and statistical analyses of trajectory modelling results in order to
20
evaluate the possible impact due to atmospheric transport from the selected NRSs on the geographical territories within the Euro-Arctic region. The further papers will de-scribe analysis of the NRS impact indicators based on dispersion modelling approach as well as the GIS-based risk and vulnerability analysis for the risk sites in the Euro-Arctic region.
ACPD
3, 5319–5356, 2003
Assessment of possible airborne impact from nuclear
risk sites – Part II
A. G. Mahura and A. A. Baklanov Title Page Abstract Introduction Conclusions References Tables Figures J I J I Back Close
Full Screen / Esc
Print Version Interactive Discussion
2.1. Nuclear risk sites of concern
The selected sites of concern include the nuclear power plants in Russia, Lithuania, Germany, United Kingdom, Finland, and Sweden (Table 1, Fig. 1). All these sites are located within the area of the study’s interest. Moreover, the Kola NPP (Murmansk Re-gion, Russia) has the old type of reactors (VVER-230); Leningrad (Leningrad ReRe-gion,
5
Russia) and Ignalina (Lithuania) NPPs have the RBMK type of reactor (having the most concern of experts); and the Novaya Zemlya Archipelago of Russia was considered as a former nuclear weapons test site and potential site for nuclear waste deposit. The Block of the British NPPs (BBP) is represented by a group of the risk sites: Chapelcross (Annan, Dumfriesshire), Calder Hall (Seascale, Cumbria), Heysham (Heysham,
Lan-10
cashire), and Hunterston (Ayrshire, Strathclyde) NPPs and the Sellafield reprocessing plant. The Block of the German NPPs (BGP) is represented by a group of NPPs: Stade (Stade, Niedersachsen), Kruemmel (Geesthacht, Schleswig-Holstein), Brunsbuettel (Brunsbuettel, Schleswig-Holstein), Brokdorf (Brokdorf, Schleswig-Holstein), and Un-terweser (Rodenkirchen, Niedersachsen). Although these NPPs use different reactor
15
types and, hence, they could have different risks of accidental releases, the grouping is useful for airborne transport studies because all NPPs are located geographically close to each other and, hence, atmospheric transport patterns will be relatively similar. It is important to note that the probability of accidents at NRSs is not considered in our study, and the focus is only on the geophysical airborne transport aspects.
20
2.2. Research tools
The first research tool is the trajectory modelling. In our study, an isentropic trajectory model based on a technique described by Merrill et al. (1985) was applied. A multiyear dataset (1991–1996) of 5-day forward trajectories originated over the NRS locations (shown in Table 1, Fig. 1) at various altitudes above sea level (asl) was calculated.
25
For the trajectory calculation, the National Center for Environmental Prediction (NCEP) Global Tropospheric Analyses was used. For each site, trajectories were calculated
ACPD
3, 5319–5356, 2003
Assessment of possible airborne impact from nuclear
risk sites – Part II
A. G. Mahura and A. A. Baklanov Title Page Abstract Introduction Conclusions References Tables Figures J I J I Back Close
Full Screen / Esc
Print Version Interactive Discussion
twice per day at 00:00 and 12:00 UTC at 16 isentropic surfaces (i.e. more than 280 thousand trajectories). Then, from calculated trajectories only about of 17.5 thousand of whose originated near the surface were selected for further statistical analysis.
The second research tool is the cluster analysis. This approach should be con-sidered as the simple approach. The cluster analysis was applied in several studies
5
related to NRSs located in the Chukotka Region (Mahura et al., 1999), Kola Peninsula (Baklanov et al., 2002a), and Russian Far East (Mahura et al., 2002). The potential risk sources considered there were the nuclear power plants, spent nuclear fuel storage fa-cilities, and nuclear submarine bases. In general, this technique allows identifying atmospheric transport pathways from the sites.
10
The third research tool is the probability fields analysis. The attempt to use this analysis to interpret atmospheric transport patterns from the nuclear risk sites was performed by Mahura et al. (2001) and Baklanov et al. (2002a), on example of the Kola NPP (Murmansk region, Russia). The major focus was the annual airflow probability fields which allowed testing the quality of the cluster analysis of trajectories used for
15
identification of atmospheric transport pathways from the sites. Such probability fields analysis provides additional information and detailed structure of the airflow patterns from the site on a geographical map. In our study, the annual, seasonal, and monthly probability fields for the airflow, fast transport, and other indicators were constructed and evaluated for the selected NRSs.
20
2.3. Indicators of risk site possible impact due to atmospheric transport
The results of probabilistic analysis for the nuclear risk sites are presented in a form of various indicators (Fig. 2) of the NRS possible impact on geographical regions, ter-ritories, and countries of concern. These indicators are based on evaluation of the trajectory modelling results. Among these indicators, the following should be
men-25
tioned: 1) simple characteristics of the NRS possible impact, 2) atmospheric transport pathways (ATP), 3) airflow (AF) probability fields, 4) fast transport (FT) probability fields, 5) maximum possible impact zone (MPIZ), 6) maximum reaching distance (MRD), 7)
ACPD
3, 5319–5356, 2003
Assessment of possible airborne impact from nuclear
risk sites – Part II
A. G. Mahura and A. A. Baklanov Title Page Abstract Introduction Conclusions References Tables Figures J I J I Back Close
Full Screen / Esc
Print Version Interactive Discussion
precipitation factor (PF), and 8) typical transport time (TTT) fields.
3. Results and discussion
In this section of the paper the combined analyses and interpretation of various indica-tors of the NRS possible impact will be given on examples of eleven NRSs located in the Euro-Arctic region. More details (including annual, seasonal, and monthly
variabil-5
ity of indicators) can be found in Mahura and Baklanov (2002).
3.1. Simple characteristics of the nuclear risk site impact and atmospheric transport pathways
In this study, all calculated forward trajectories that originated over the NRS locations were analyzed in order to investigate the likelihood that the risk sites might have impact
10
on the neighbouring countries or distant geographical regions. As a first approximation, trajectories can be separated into groups by altitudes of initial trajectory points. The boundaries of geographical regions can be selected depending on political borders, climatic regimes, areas of research interest, etc. For simplicity, it can be assumed that any trajectory, which crosses the boundaries of the chosen geographical region,
15
might bring air parcels containing radionuclides. Therefore, only trajectories crossing boundaries of these regions should be selected in further evaluation of the NRS impact. Among the simple characteristics the following could be suggested. First, it is the number and percentage of trajectories reaching the boundaries of the chosen geo-graphical regions (upper boundary of the NRS impact). Second, it is the number and
20
percentage of days when, at least, one trajectory had reached the region (lower bound-ary of the NRS impact). Third, it is the average transport time of air parcels to reach the chosen regions. Fourth, it is the probability of atmospheric transport within different atmospheric layers (boundary layer and free troposphere). Fifth, it is the likelihood of very rapid (or fast) atmospheric transport of air parcels, i.e. transport in one day or
ACPD
3, 5319–5356, 2003
Assessment of possible airborne impact from nuclear
risk sites – Part II
A. G. Mahura and A. A. Baklanov Title Page Abstract Introduction Conclusions References Tables Figures J I J I Back Close
Full Screen / Esc
Print Version Interactive Discussion
less. All these characteristics can be evaluated over a multiyear dataset of calculated trajectories, by individual year, season, and month. Such analyses allow investigating possible spatial and temporal variation in the airflow patterns from the NRS region to the chosen geographical regions of concern. Another approach in the simple analysis is to apply, as a research tool, a cluster analysis technique for trajectories originated at
5
each site. As a result, the mean trajectories for each cluster will be produced. These mean trajectories are atmospheric transport pathways from the sites, and they can be explained based on existing synoptic features and peculiarities in the studied regions. These pathways show the general direction and probability of atmospheric transport from the site region.
10
Although results of the cluster analysis are useful, they are not completely repre-sentative, because information between clusters represented by mean trajectories (or transport pathways), reflecting only the general direction of airflow from the site, is “missing”. Therefore, another research tool – probability fields analysis – is required to extract this additional information.
15
It should be noted that evaluation of simple characteristics and atmospheric trans-port pathways for several NRSs in the Russian Far East and Northwest Russia are discussed by Mahura et al. (1999); Mahura (2001); Baklanov et al. (2002a); Mahura (2002).
3.2. Airflow and fast transport probability fields
20
3.2.1. Airflow probability fields
The first type of probabilistic fields – airflow probability fields (constructed based on 5-day isentropic trajectories) – shows the common features in the atmospheric trans-port patterns from NRSs. First, it could provide a general insight on the possible main direction of atmospheric transport for radioactive plume. Second, it shows a
proba-25
bility that radioactive plume will reach or pass over a given area on a geographical map. In comparison with the atmospheric transport pathways, the AF probability fields
ACPD
3, 5319–5356, 2003
Assessment of possible airborne impact from nuclear
risk sites – Part II
A. G. Mahura and A. A. Baklanov Title Page Abstract Introduction Conclusions References Tables Figures J I J I Back Close
Full Screen / Esc
Print Version Interactive Discussion
show more detailed information about distribution of direction and probabilities of at-mospheric transport from the sites toward a particular geographical territory, region, country, etc. in the studied area. These fields characterize not only the highly possible direction of the contaminated cloud atmospheric transport from the risk sites, but also define boundaries of territories on a geographical map where the order of magnitude
5
of the NRS possible impact could be evaluated. In this case, it is possible to depict the region (i.e. Area of the Highest Probability of the Possible Impact – AHPPI; see Baklanov and Mahura, 2003) on a map where the risk site impact might be the highest, and for other regions to re-calculate the NRS possible impact as a part of NRS AHPPI. Moreover, the airflow probability field is a reliable test to reject or support results of
10
the cluster analysis (which can be applied to identify the general atmospheric transport pathways from NRSs), because the calculated clusters (or mean trajectories) will be located in the troughs and crests of probabilistic fields.
The regions, where the highest crossing by trajectories is occurred, have the highest probability of the NRS possible impact. In this study, all airflow probability fields were
15
constructed by averaging airflow patterns over a selected time period: year, season, and month (based on a multiyear dataset). The seasonal division was considered as standard (i.e. each season included three months; for example, spring includes March, April, and May). Although it should be noted that for a particular application the different scale might be considered: by the vegetation period, by snow cover presence,
20
by prevailing wind direction, etc.
3.2.2. Temporal variability of the airflow probability fields
On an annual scale, the westerly transport dominates for all NRSs considered in this study (Fig. 3). Some additional transport patterns are seen. For the block of the British NPP (BBP) Oskarshamn NPP (ONP) and Olkiluoto NPP (TRS), the airflow pattern is
25
shifted toward the northeast of the sites. For the Ignalina NPP (INP), the AF proba-bility field is shifted toward the southeast of the site. For NRSs located closer to the North Atlantic region (i.e. blocks of the British (BBP) and German (BGP) NPPs, and
ACPD
3, 5319–5356, 2003
Assessment of possible airborne impact from nuclear
risk sites – Part II
A. G. Mahura and A. A. Baklanov Title Page Abstract Introduction Conclusions References Tables Figures J I J I Back Close
Full Screen / Esc
Print Version Interactive Discussion
Barsebaeck NPP (BBP)), the boundaries of probabilistic fields are extended farther (approximately on 1/3 in comparison with other NRSs) in the western direction from the sites. Therefore, the probability to reach more remote (in the western direction) territories from the sites is increased.
As any meteorological variable, the calculated AF probability fields based on the wind
5
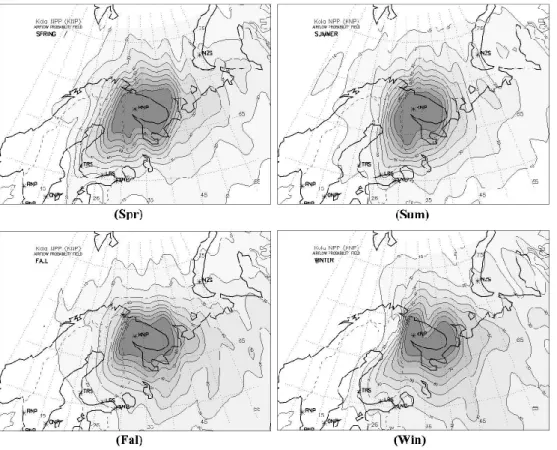
characteristics have a temporal variability. Let us consider, as examples, the variability of the airflow patterns for the Kola NPP by seasons (Fig. 4) and Leningrad NPP by months (Fig. 5).
For the Kola NPP (Fig. 4), during all seasons, the predominant transport is in the eastern direction from the site. Although, during spring, there is increase of transport
10
in the south-western direction (it is reflected by shifting of the AHHPI boundaries to the central territories of Finland). During summer, these boundaries are extended to the south of the site (reaching 65◦N), but in other seasons they are located northerly of this latitude. During winter, the probability to reach Sweden is minimal; but the north-western and central regions of Russia are at the higher risk of being impacted during
15
atmospheric transport from the site. Moreover, it should be noted, that isolines of the airflow probability fields could be represented as the varying boundaries showing an order of the NRS possible impact on a particular geographical territory. For example, for the Yamal Peninsula (Russia), likelihood of the KNP possible impact is the lowest during summer compared with other seasons, whereas for the Baltic States this likelihood is
20
the lowest during spring.
For the Leningrad NPP (LNP), more detailed consideration of temporal variability by months (Fig. 5) showed some peculiarities in the airflow patterns, which are not seen on both annual and seasonal scales. In July, atmospheric transport in the south-ern direction dominates for trajectories originated within the boundary layer over the
25
LNP region. The LNP AHPPI boundaries reach territories southerly of 55◦N. During February–March, the boundaries are extended significantly to the west of the site. Dur-ing October–November, the probability for air parcels to pass over the Barents Sea is decreased. In September, there is a probability to reach the western seashore of the
ACPD
3, 5319–5356, 2003
Assessment of possible airborne impact from nuclear
risk sites – Part II
A. G. Mahura and A. A. Baklanov Title Page Abstract Introduction Conclusions References Tables Figures J I J I Back Close
Full Screen / Esc
Print Version Interactive Discussion
Southern Norway, although during other months, only a small part of the northern ter-ritories of this country could be affected due to atmospheric transport from the LNP region. Throughout the year, the boundaries of LNP AHPPI are located within the Rus-sian territories, except in March, September, and November when these are extended also to the northern territories of Estonia.
5
3.2.3. Fast transport probability fields
The second type of probabilistic fields – fast transport probability fields (constructed based on 0.5 and 1-day isentropic trajectories) – indicates the probability of the air parcels movement during the first day of transport. It is important information, espe-cially, for the impact estimating of the short-lived radionuclides such as133,131I,132Te
10
and Noble gases such as85Kr, 131,133,135Xe. These fast transport fields show those territories that can be reached during the first day of atmospheric transport from the site, and those areas that are at the most danger due to atmospheric transport. In this study, the fast transport probability fields were calculated after 12 and 24 h of at-mospheric transport from the risk sites. Similarly to the AF probability fields, the FT
15
probability fields could be used for evaluation of the risk site impact during the first day after accidental release at site.
Let us consider several examples of result interpretation. First, it is an individual interpretation of the fast transport probability fields for one or more NRSs with respect to geographical regions, territories, and countries of concern. Second, it is a combined
20
interpretation of the airflow and fast transport probability fields for two or more NRSs with respect to each other and geographical regions, territories, or countries of concern. 3.2.4. Individual interpretation of the fast transport probability fields for one or more
sites
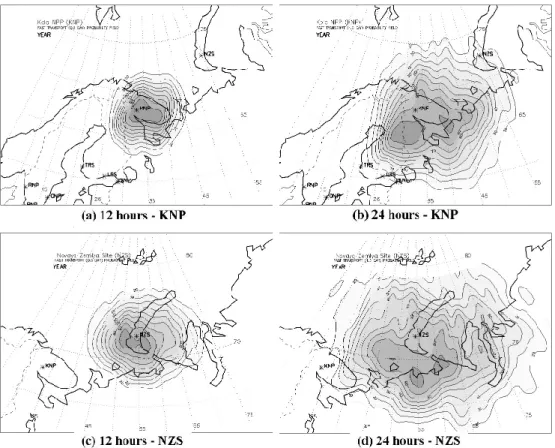
Let us consider some NRSs for such an analysis. For the Kola NPP (KNP), the annual
25
ACPD
3, 5319–5356, 2003
Assessment of possible airborne impact from nuclear
risk sites – Part II
A. G. Mahura and A. A. Baklanov Title Page Abstract Introduction Conclusions References Tables Figures J I J I Back Close
Full Screen / Esc
Print Version Interactive Discussion
entire Kola Peninsula is located within the boundaries of KNP AHPPI. During the first 12 h, the atmospheric transport from KNP is dominated by westerlies, although after 24 h the transport to southwest can be also identified (Fig. 6b). Two maxima of AHPPI could be seen. The first maximum is located in the eastern part of the Kola Peninsula, the second – in the central regions of Karelia and Finland. Both maxima show that
5
after a day of transport, there is the highest possibility that the contaminated cloud could arrive to the mentioned territories, and hence, the NRS possible impact might be higher compared with other territories. On a seasonal scale, for the Kola NPP, during fall the FT probability field after 24 h showed a shift of AHPPI in the eastern direction from the site toward less populated territories of the Northwest Russia. During summer,
10
the total area of the FT probability fields is smaller (due to significant decrease of wind speeds) compared with other seasons. This tendency is observed for all NRSs. In the same time, more southern regions with respect to the KNP location are included in the boundaries of AHPPI. There are also several maxima of AHPPI throughout the year, except summer.
15
On an annual scale, for the Novaya Zemlya test site (NZS) there is a pattern showing transport in the western direction from the site after the first 12 h of atmospheric trans-port (Fig. 6c), and a pattern showing transtrans-port in the southern direction from the site after the first 24 h of atmospheric transport. It should be noted that for the FT probabil-ity field after 12 h, the AHPPI, although it is located near the site, is separated into two
20
maxima located over the Arctic seas: one to the east and one to the west of the site. After the first day, the NZS possible impact could be the highest on the territories of the Russian Arctic seashore (Fig. 6d), and there are also two maxima of NZS AHPPI located to the south of the site.
Let us compare the NRS possible impact from two or more NRSs on a particular
25
country and region of concern – e.g. 1) Denmark and 2) Kaliningrad Region (Russia). For this purpose, for simplicity, the annual (although seasonal or monthly variability could be used) fast transport probability fields after 12 and 24 h of atmospheric trans-port were evaluate for 1) the blocks of the British (BBP) and German (BGP) NPPs (as
ACPD
3, 5319–5356, 2003
Assessment of possible airborne impact from nuclear
risk sites – Part II
A. G. Mahura and A. A. Baklanov Title Page Abstract Introduction Conclusions References Tables Figures J I J I Back Close
Full Screen / Esc
Print Version Interactive Discussion
example 1; see Fig. 7); 2) the Ignalina (INP) and Barsebaeck (BNP) NPPs (as example 2; see Fig. 8). Such an analysis could allow determining: which of NRSs will represent the highest danger due to atmospheric transport, from the probabilistic point of view, to a considered geographical region, territory, country, etc.
In the first example, for both blocks of NPPs – German and British, during the first
5
12 h, the tendency dominating of westerly flows is observed (Figs. 7a, c). The area of BGP AHPPI is larger compared with the area of BBP AHPPI. The boundaries of the BGP AHPPI’s middle and high values (>50%) reach the central and southern territo-ries of Denmark. For BBP, the maximal values of AHPPI are located in vicinity of the British Islands, and probability to reach the Danish territories is minimal. The FT
prob-10
ability fields after 24 h (Figs. 7b, d) showed that although the dominating atmospheric transport for both sites is still toward the east, for BBP the transport in the southern and northern directions is observed. The BBP AHPPI area is significantly increased, and its boundaries are extended farther in the meridional direction compared with latitudinal direction. Hence, the probability to reach the western territories of Denmark has risen.
15
In the second example, for two NRSs – Ignalina and Barsebaeck NPPs – the west-erly flows dominate during the first 12 h of atmospheric transport (Figs. 8a, c). For INP, the end of the first day shows a tendency of the airflow shifting in the south-eastern direction from the site. For BNP, the western territories of the Kaliningrad Region will be located within the AHPPI boundaries of this site. Moreover, the entire Kaliningrad
20
Region, Lithuania, and Latvia lie inside the BNP AHPPI after 24 h of atmospheric trans-port (Figs. 8b, d). Although, for INP, the medium values of INP AHPPI are observed only on the eastern territories of the Kaliningrad Region.
3.2.5. Combined interpretation of airflow and fast transport probability fields for sev-eral sites
25
In this section, the combined analysis of the AF and both FT (12 and 24 h) probability fields for several NRSs is considered. The seasonal variability of the airflow and fast transport patterns is compared (Fig. 9) for the blocks of the British (BBP) and German
ACPD
3, 5319–5356, 2003
Assessment of possible airborne impact from nuclear
risk sites – Part II
A. G. Mahura and A. A. Baklanov Title Page Abstract Introduction Conclusions References Tables Figures J I J I Back Close
Full Screen / Esc
Print Version Interactive Discussion
(BGP) NPPs, Loviisa (LRS) and Barsebaeck (BNP) NPPs with respect to the Nordic countries: Denmark, Finland, Norway, Sweden, Iceland, and Faeroe Islands. It is a convenient step for such analysis to plot a selected field on one figure for several NRSs simultaneously, and to choose several critical isolines (for example, 10, 25, 50, 75, >90% of NRS AHPPI) for better and easier interpretation of results.
5
The seasonal variability of the airflow patterns for two NRSs – BBP and BGP – is shown in Fig. 9a, and it reflects the dominance of the westerly flows in the atmospheric transport from these sites. The AHPPI boundaries (>90) for both sites intersect each other over the North Sea throughout the year, except summer. The total area of the BBP airflow pattern is larger compared with BGP, and moreover, in spring it almost
10
covers the BGP airflow pattern area. During spring and fall, the BGP AF probability field is more extended in the western direction from the site toward the North Atlantic Ocean. Throughout the year, except winter, the Faeroe Islands will be located within 25–50% of BBP AHPPI. Considering a minimal isoline of 25% of AHPPI, it should be noted that the central parts of the Scandinavian Peninsula are less reachable throughout the year,
15
except spring, and hence, the NRS possible impact is lower compared with Denmark. For the Faeroe Islands, the BBP possible impact will vary between 25–55% of AHPPI, although for Iceland it is lower than 25% of AHPPI.
The seasonal variability of the fast transport patterns (for 24 h of atmospheric trans-port) for two NRSs BBP and LRS is shown in Fig. 9b. For BBP, during spring and
20
fall the AHPPI boundaries extended significantly to the south of the site, and moreover, in spring three maxima of BBP AHPPI could be identified over the United Kingdom, Denmark, and Ireland. During winter and spring, the boundaries of this FT probability field (enclosed by 25% of AHPPI isoline), are extended farther to north and south com-pared with other seasons. Among the Scandinavian countries only Denmark and the
25
southern territories of Norway and Sweden might be affected by the end of the first day if an accidental release of radioactivity occurred at the site.
For LRS, in summer, the AHPPI boundaries are more extended to the southeast of the site, in winter – to the northeast of the site. Throughout the year, the total area
ACPD
3, 5319–5356, 2003
Assessment of possible airborne impact from nuclear
risk sites – Part II
A. G. Mahura and A. A. Baklanov Title Page Abstract Introduction Conclusions References Tables Figures J I J I Back Close
Full Screen / Esc
Print Version Interactive Discussion
of the LRS FT probability field is smaller compared with BBP, which could be also affected by the difference in the continental vs. maritime climatic regimes of the sites, respectively. The probability of reaching the eastern seashore of Sweden is low, and the NRS possible impact there will be only 25% of AHPPI. The southern territories of Finland are always inside the LRS AHPPI boundaries throughout the year, except
5
summer.
The seasonal variability of the FT patterns (for 12 h of atmospheric transport) for three NRSs – BBP, LRS, and BNP – is shown in Fig. 9c. For these sites, the domi-nating transport pattern is transport in the eastern direction from the sites. The AHPPI boundaries are extended to the east of the sites, although for BBP it is extended more
10
to the north of BBP in summer and to the west of BBP in spring, as well as for BNP it is extended to the west of BNP during fall. The seasonal variability for LRS is less pronounced, and throughout the year, the LRS AHPPI boundaries are located within the same geographical regions. Only neighbouring to NRSs countries and regions will be located within the AHPPI boundaries. For LRS, it is the border regions of the
North-15
west Russia, Finland, and Estonia. For BNP, it is the Baltic seashore of Germany and Poland, Denmark, and the south of Sweden. For BBP, it is only the United Kingdom with the western parts of the North Sea.
If consider Denmark as a country of concern than, throughout the year, after the first 12 h of atmospheric transport: 1) Loviisa NPP does not affect the Danish territory 2)
20
Barsebaeck NPP will always represent the highest probability of atmospheric transport to Denmark, and this probability is higher during spring and fall (when the BNP AHPPI boundaries pass over the Danish borders) compared with other seasons, and 3) block of the British NPPs shows the relatively fast transport toward Denmark, and the NRS possible impact over Denmark will be 10-25% of BBP AHPPI.
25
Finally, the NRS possible impact (on a particular geographical region, territory, coun-try, etc.) due to atmospheric transport based on selected probabilistic fields (airflow and fast transport) for different time periods (annual, seasonal, and monthly) for any of 11 selected NRSs in the Euro-Arctic region both separately for each site or combined
ACPD
3, 5319–5356, 2003
Assessment of possible airborne impact from nuclear
risk sites – Part II
A. G. Mahura and A. A. Baklanov Title Page Abstract Introduction Conclusions References Tables Figures J I J I Back Close
Full Screen / Esc
Print Version Interactive Discussion
for several sites can be evaluated.
Moreover, it should be noted that both types of probability fields could be used for emergency planning and preparedness, in advance, for estimates of possible atmo-spheric transport (including probabilities, direction, speed, etc.) of the radionuclide plume after hypothetical accidental releases at NRSs.
5
3.3. Maximum possible impact zone and maximum reaching distance indicators In this section, two additional indicators – maximum reaching distance (MRD) and max-imum possible impact zone (MPIZ), which could play a role of indicators of the NRS possible impact, are introduced and analyzed. In addition to the airflow and fast trans-port probability fields, these are the third type of probabilistic fields. It should be noted
10
that this type of the field, first, indicates boundaries of regions with the highest proba-bility of being reached by trajectories during the first day of atmospheric transport from the risk sites (i.e. MPIZ indicator). Second, this type of the field shows the farthest boundaries on the geographical map that might be reached during the first day by, at least, one trajectory originating over the NRS location (i.e. MRD indicator).
15
3.3.1. Maximum possible impact zone
Maximum possible impact zone (MPIZ) indicator, similarly to the FT probability fields, is important characteristic during the first day of atmospheric transport after an accidental release at the site. The boundaries of the MPIZ indicators calculated for selected NRSs in the Euro-Arctic region are shown in Fig. 10. It should be noted, that although
20
MPIZs are concentrated in vicinity of the sites, the configuration of the MPIZ isolines will depend on the dominating transport patterns during the first day of atmospheric transport, and isolines are extended along the direction of the main flow. For most of the considered NRSs, the dominating airflows from the sites are westerlies. Additionally, for the BBP site the MPIZ boundaries are extended to the north of the site. For the
25
ACPD
3, 5319–5356, 2003
Assessment of possible airborne impact from nuclear
risk sites – Part II
A. G. Mahura and A. A. Baklanov Title Page Abstract Introduction Conclusions References Tables Figures J I J I Back Close
Full Screen / Esc
Print Version Interactive Discussion
For studies of the long-term consequences of routine discharges or accidental re-leases at NRSs it is important to evaluate not only boundaries of MPIZ, but also areas of regions enclosed by the MPIZ isolines. To estimate areas, at first, the figure inside the MPIZ boundary (or isoline) was approximated by a set of triangles, where each triangle has a top at the NRS coordinates and a side on the MPIZ isoline. Then, the
5
areas of all triangles were calculated, and the total area under the MPIZ isoline was calculated as a sum of areas of all triangles. The estimation of seasonal maximum and minimum, and annual average areas for MPIZ is given in Table 2. It should be noted that this variability depends on the wind velocities on the synoptic- and mesoscales throughout the year. And although, during winter the wind speeds are higher compared
10
with summer, there is a variability defined by the local peculiarities near the sites. On a seasonal scale (Table 2), among 11 NRSs the MPIZ area reaches a minimum in summer, except for the Leningrad (LNP), Ignalina (INP), and Barsebaeck (BNP) NPPs, where a minimum is in fall; and Olkiluoto NPP (TRS), where a minimum is in spring. For the NZS site, throughout the year, the MPIZ area is maximal among 11 considered
15
NRSs.
3.3.2. Maximum reaching distance
Maximum reaching distance (MRD) indicator, similarly to the maximum possible impact zone indicator, is important characteristic during the first day of atmospheric transport after an accidental release at the site. The boundaries of the MRD indicators for the
20
selected NRSs in the Euro-Arctic region are shown in Fig. 11. If to consider a large dataset of trajectories, there is a situation after accidental release when the contam-inated air parcels might reach the most remote geographical regions. The distance to these remote boundaries might vary between hundreds and thousands kilometers. Boundaries, depicted on Fig. 11 reflect such possibility. They could be interpreted as
25
probable boundaries of the NRS possible impact during the first day after the hypothet-ical accidental release when atmospheric transport from the site was the fastest. This indicator helps for decision-makers to evaluate what time (in a worst-case scenario)
ACPD
3, 5319–5356, 2003
Assessment of possible airborne impact from nuclear
risk sites – Part II
A. G. Mahura and A. A. Baklanov Title Page Abstract Introduction Conclusions References Tables Figures J I J I Back Close
Full Screen / Esc
Print Version Interactive Discussion
will be available before taking possible countermeasures.
For example, as shown in Fig. 11a, for the Kola NPP (KNP), the zone of such impact is extended to the northern territories of Sweden and Norway, most of the territory of Finland, and north-western territories of Russia (including the Barents, White, and Kara Seas). For the Leningrad NPP (LNP), the boundaries include a significant part of
5
Finland, Baltic States Byelorussia, north-western and central regions of Russia. For the Novaya Zemlya test site (NZS), the atmospheric transport is extended in the latitudinal direction by 20–30◦from the site, and in the meridional direction – 8–10◦from the site. For the Olkiluoto NPP (TRS), as shown in Fig. 11b, the MRD boundaries are extended over the large part of the Scandinavian Peninsula, Northwest Russia, Baltic States,
10
and, partially over Belarus and Poland.
Similarly to MPIZ, it is possible to estimate areas enclosed by the MRD isolines for each NRS (see Table 3). The MRD areas, of course, are significantly larger than the MPIZ areas, and the latter is also included in the MRD area. The dominating direction of atmospheric transport is less underlined by MRD compared with MPIZ. Because the
15
construction of the MRD indicator boundaries includes cells of gridded domain with the lowest probabilities of transport through the cells (i.e. at least one trajectory reached a cell), it is not possible to explain such variability only by the general synoptic and mesoscale features (i.e. there is a contribution of anomalies in the general transport patterns from the sites throughout the year). Among 11 NRSs, for NZS, the annual
20
MRD area is the highest and it is equal to 903.5 · 104km2with a maximum in winter and a minimum in simmer. For the Oskarshamn NPP (ONP), this area is the lowest and it is equal to 595.1 · 104km2with a maximum in winter and a minimum in spring. For all NRSs, the maximum of MRD area is observed in winter, except for KNP and BGP (when it is observed in spring).
25
3.4. Typical transport time fields
In the emergency response systems for nuclear accidents, the estimation of the ra-dionuclide transport time to a particular territory, region, country, etc. is one of
im-ACPD
3, 5319–5356, 2003
Assessment of possible airborne impact from nuclear
risk sites – Part II
A. G. Mahura and A. A. Baklanov Title Page Abstract Introduction Conclusions References Tables Figures J I J I Back Close
Full Screen / Esc
Print Version Interactive Discussion
portant input parameters in the decision-making process. This information could be extracted from calculated trajectories by constructing the fourth type of probabilistic fields called the typical transport time (TTT) fields. These fields show: first, how long it will take for an air parcel to reach a particular geographical region from the NRS loca-tion, and second, what territories would be at the highest risk during the first few days
5
of the contaminated cloud transport after an accident at NRS.
Several examples of the annual typical transport time fields for evaluation of the NRS possible impact are shown in Fig. 12. For BBP, during the first day the typical situa-tion would be atmospheric transport over the United Kingdom territories and adjacent seas without reaching the populated territories of the continental European countries
10
(Fig. 12a). After 2 days, the air mass might reach the southern territories of Norway and Sweden, as well as countries on the seashore of the North and Baltic Seas. The at-mospheric transport in the southern and south-eastern directions is minimal. For KNP, during the first day the territories of the Murmansk and Archangelsk Regions, north of Karelia, and Finland could be reached, and on the second day, the large territory of
15
the Northwest Russia, northern and central regions of the Scandinavian Peninsula are included (Fig. 12b). Moreover, a significant shift of the TTT isoline at 2 days is seen in the eastern direction (dominating airflow pattern for the KNP site).
If to assume, that the nuclear weapons testing (considering possible vent emissions during underground testing as a possible source of radioactivity) would be resumed
20
on the Novaya Zemlya Archipelago than the typical transport time field shows that, on average, during the first day the contaminated air parcels could reach only the Russian Arctic seashore (Fig. 12c). During two days of transport the boundaries are extended significantly in both eastern and southern directions reaching 60◦N, although countries of the Northern Europe will remain unaffected.
25
Detailed analysis of the TTT fields for individual and several combined NRSs allows identifying geographical regions and territories of the neighbouring countries which could be reached during atmospheric transport and might be impacted by radioac-tive pollution during a selected period of time, if an accidental release (or releases)
ACPD
3, 5319–5356, 2003
Assessment of possible airborne impact from nuclear
risk sites – Part II
A. G. Mahura and A. A. Baklanov Title Page Abstract Introduction Conclusions References Tables Figures J I J I Back Close
Full Screen / Esc
Print Version Interactive Discussion
occurred at NRSs. This information could be used to forecast the arrival of the contam-inated cloud to a particular territory, and hence, it will allow planning countermeasures, including informing and evacuating of population. The overlapping of isolines (shown in Fig. 12) occurred because daily the airflow propagates in the direction of prevailing atmospheric transport, and hence, the TTT isolines will be shifted in the same direction.
5
4. Conclusions
In this study the methodology (Baklanov and Mahura, 2003) for evaluation of the at-mospheric transport of radioactive pollutants from the nuclear risk sites (NRSs) to dif-ferent geographical regions and countries of concern was tested. The combination of atmospheric transport modelling and statistical analyses was used to evaluate possible
10
impact due to atmospheric transport from the hypothetical accidental release at NRSs located in the Euro-Arctic region.
The nuclear risk sites of concern (in total 11), selected in this study, are nuclear power plants (NPPs) located in Russia (Kola and Leningrad NPPs), Finland (Lovi-isa and Olkiluoto NPPs), Sweden (Barsebaeck, Oskarshamn, and Ringhals NPPs),
15
Lithuania (Ignalina NPP), groups of the British and German NPPs as well as the No-vaya Zemlya test site of Russia. The geographical regions and countries of interest are the Northern and Central European countries and Northwest Russia.
Once the nuclear risk sites of concern and geographical region of interest were de-fined, it was of particular interest to answer the following questions: Which
geograph-20
ical territories are at highest risk from the hypothetical accidental releases at selected NRSs? What are probabilities and times for radionuclide atmospheric transport to dif-ferent neighbouring countries in case of accidents at these NRSs?
To answer these questions, several research tools developed within the Arctic Risk Project (AR-NARP, 2001–2003) were applied. First, an isentropic trajectory model was
25
used to calculate a multiyear (1991–1996) dataset of 5-day forward trajectories that originated over the NRS locations at various altitudes. As input data for modelling
ACPD
3, 5319–5356, 2003
Assessment of possible airborne impact from nuclear
risk sites – Part II
A. G. Mahura and A. A. Baklanov Title Page Abstract Introduction Conclusions References Tables Figures J I J I Back Close
Full Screen / Esc
Print Version Interactive Discussion
purposes we used NCAR meteorological gridded fields. Second, a set of statistical methods (including exploratory, cluster, and probability fields analyses) was used for evaluation of trajectory modelling results.
The results of probabilistic analysis of trajectory modelling results for 11 NRSs are presented as a set of various indicators of the NRS possible impact on geographical
5
regions and countries of interest. In this study, we calculated, constructed, and evalu-ated several important indicators based on trajectory modelling results: 1) atmospheric transport pathways (ATP), 2) airflow (AF) probability fields, 3) fast transport (FT) prob-ability fields, 4) maximum reaching distance (MRD), 5) maximum possible impact zone (MPIZ), and 6) typical transport time (TTT) fields. To evaluate the temporal variability
10
of all these indicators, analyses were performed annually, seasonally, and monthly. In this study, for all selected NRSs, throughout the year, the westerly atmospheric transport dominates within the boundary layer. For the block of the British, Oskar-shamn, and Olkiluoto NPPs, the airflow pattern is shifted toward the northeast of the sites. For the Ignalina NPP, the AF probability field is shifted toward the southeast of
15
the site. For NRSs located closer to the North Atlantic region (i.e. blocks of the British and German NPPs, and Barsebaeck NPP), the boundaries of probabilistic fields are extended farther (approximately on 1/3 in comparison with other NRSs) in the western direction from the sites.
Considering Denmark as a country of concern it should be noted that throughout
20
the year after the first 12 h of atmospheric transport: 1) Barsebaeck NPP will always represent the highest probability of atmospheric transport toward Denmark, especially in spring and fall, 2) block of the German NPPs shows the possible impact of 60–80% of AHPPI as well as the block of the British NPPs shows the possible impact of 10–25% of AHPPI over the Danish territory.
25
The NRS possible impact (on a particular geographical region, territory, country, site, etc.) due to atmospheric transport from NRS after hypothetical accidental re-leases of radioactivity can be properly estimated based on a combined interpretation of the indicators (simple characteristics, atmospheric transport pathways, airflow and
ACPD
3, 5319–5356, 2003
Assessment of possible airborne impact from nuclear
risk sites – Part II
A. G. Mahura and A. A. Baklanov Title Page Abstract Introduction Conclusions References Tables Figures J I J I Back Close
Full Screen / Esc
Print Version Interactive Discussion
fast transport probability fields, maximum reaching distance and maximum possible impact zone, typical transport time, and precipitation factor fields) for different time periods (annual, seasonal, and monthly) for any selected NRSs (both separately for each site or grouped for several sites) in the Euro-Arctic region. Such estimation could be the useful input information for the decision-making process, risk assessment, and
5
planning of emergency response systems at risk sites of nuclear, chemical, biological, etc. danger.
Acknowledgements. The authors are grateful to L. Laursen and J.H. Sørensen (Danish
Meteo-rological Institute, DMI), O. Rigina (Geographical Institute, Copenhagen University, Denmark), R. Bergman (Swedish Defence Research Authority), B. Segerst ˚ahl (Thule Institute, University
10
of Oulu, Finland), J. Merrill (University of Rhode Island, USA), F. Parker (Vanderbilt University, USA), K. Compton (International Institute for Applied Systems Analysis, Austria), S. Nielsen (Risø National Laboratory, Denmark), and S. C. Hoe (Danish Emergency Management Agency) for collaboration, discussions and constructive comments.
The computer facilities and meteorological data archives at the DMI and National Center for
15
Atmospheric Research (NCAR, USA) have been used extensively in the study. The authors are grateful to the DMI and NCAR computer consulting services for the collaboration, computer assistance, and advice.
Financial support of this study included the grants of the Nordic Arctic Research Programme, Nordisk Forskerutdanningsakademi, and US Department of Energy.
20
References
AR-NARP: On-going Project Atmospheric Transport Pathways, Vulnerability and Possible Acci-dental Consequences from the Nuclear Risk Sites in the European Arctic (Arctic Risk) of the NARP: Nordic Arctic Research Programme,http://www.dmi.dk/f+u/luft/eng/arctic-risk/main. html, 2001–2003.
25
AMAP: AMAP Assessment Report: Arctic Pollution Issues, Arctic Monitoring and Assessment Programme (AMAP), Oslo, Norway, 869, 1998.
ACPD
3, 5319–5356, 2003
Assessment of possible airborne impact from nuclear
risk sites – Part II
A. G. Mahura and A. A. Baklanov Title Page Abstract Introduction Conclusions References Tables Figures J I J I Back Close
Full Screen / Esc
Print Version Interactive Discussion
Baklanov, A. and Mahura, A.: Atmospheric Transport Pathways, Vulnerability and Possible Acci-dental Consequences from Nuclear Risk Studies: Methodology for Probabilistic Atmospheric Studies, Danish Meteorological Institute Scientific Report, 01–09, ISBN: 87-7478-450-1, 43, 2001.
Baklanov, A., Mahura, A., Jaffe, D., Thaning, L., Bergman, R., and Andres, R.: Atmospheric
5
Transport Patterns and Possible Consequences for the European North after a Nuclear Ac-cident, Journal of Environment Radioactivity, 60, 1–2, 1–26, 2002a.
Baklanov, A., Mahura, A., Sørensen, J. H., Rigina, O., and Bergman, R.: Methodology for Risk Analysis based on Atmospheric Dispersion Modelling from Nuclear Risk Sites in Northern Europe, Danish Meteorological Institute Scientific Report, 02–16, ISBN: 87-7478-470-6, 54,
10
2002b.
Baklanov, A. and Mahura, A.: Assessment of Possible Airborne Impact from Nuclear Risk Sites. Part I: Methodology for Probabilistic Risk Studies, Atmospheric Chemistry and Physics, sub-mitted, 2003.
Bergman, R. and Baklanov, A.:Radioactive sources in main radiological concern in the
Kola-15
Barents region, FRN-FOA Publication, Stockholm, 82, 1998.
Mahura, A., Jaffe, D., Andres, R., and Merrill, J.: Atmospheric transport pathways from the Bilibino nuclear power plant to Alaska, Atmospheric Environment, 33/30, 5115–5122, 1999. Mahura, A.: Probabilistic Assessment of Atmospheric Transport Patterns from Nuclear Risk
Sites, Ph.D. Thesis, Russian State Hydrometeorological University/Kola Science Center,
20
172, 2001.
Mahura, A., Andres, R., and Jaffe, D.: Atmospheric transport patterns from the Kola Nuclear Reactors, CERUM Northern Studies No. 24, Ume ˚a University, Sweden, 33, 2001.
Mahura, A. and Baklanov A.: Probabilistic Analysis of Atmospheric Transport Patterns from Nuclear Risk Sites in Euro-Arctic Region, Danish Meteorological Institute Scientific Report,
25
02–15, ISBN: 87-7478-469-2, 87, 2002.
Mahura, A., Baklanov, A., Sørensen, J. H., Parker, F. L., Novikov, V., Brown, K., and Compton, K.: Probabilistic Analysis of Atmospheric Transport and Deposition Patterns from Nuclear Risk Sites in Russian Far East, Danish Meteorological Institute Scientific Report, 02–17, ISBN: 87-7478-471-4, 80, 2002.
30
Merrill, J., Bleck, R., and Boudra, D. B.: Techniques of Lagrangian Trajectory Analysis in Isen-tropic Coordinates, Monthly Weather Review, 114, 571–581, 1995.
ACPD
3, 5319–5356, 2003
Assessment of possible airborne impact from nuclear
risk sites – Part II
A. G. Mahura and A. A. Baklanov Title Page Abstract Introduction Conclusions References Tables Figures J I J I Back Close
Full Screen / Esc
Print Version Interactive Discussion
Table 1. Nuclear risk sites selected for the study
# Site Lat,◦N Lon,◦E Site names Country
1 KNP 67.75 32.75 Kola NPP Russia
2 LNP 59.90 29.00 Leningrad NPP Russia 3 NZS 72.50 54.50 Novaya Zemlya Test Site Russia 4 INP 55.50 26.00 Ignalina NPP Lithuania 5 BBP 54.50 −3.50◦W Block of the British NPPs UK 6 BGP 53.50 9.00 Block of the German NPPs Germany 7 LRS 60.50 26.50 Loviisa NPP Finland 8 TRS 61.50 21.50 Olkiluoto (TVO) NPP Finland 9 ONP 57.25 16.50 Oskarshamn NPP Sweden 10 RNP 57.75 12.00 Ringhals NPP Sweden 11 BNP 55.75 13.00 Barsebaeck NPP Sweden
ACPD
3, 5319–5356, 2003
Assessment of possible airborne impact from nuclear
risk sites – Part II
A. G. Mahura and A. A. Baklanov Title Page Abstract Introduction Conclusions References Tables Figures J I J I Back Close
Full Screen / Esc
Print Version Interactive Discussion
Table 2. Seasonal variability of the maximum possible impact zone indicator Nuclear risk sites NRS Area of MPIZ ·104km2
Maximum Minimum Annual average Novaya Zemlya Test Site NZS 79.7 (Win) 47.1 (Sum) 57.4 Kola NPP KNP 41.9 (Spr) 33.6 (Sum) 42.8 Leningrad NPP LNP 57.4 (Win) 34.4 (Fal) 40.2 Ignalina NPP INP 56.9 (Win) 32.1 (Fal) 42.0 Oskarshamn NPP ONP 62.3 (Win) 37.7 (Sum) 41.8 Ringhals NPP RNP 46.0 (Spr) 27.9 (Sum) 38.3 Barsebaeck NPP BNP 44.9 (Win) 35.8 (Fal) 40.2 Loviisa NPP LRS 43.8 (Fal) 31.4 (Sum) 40.9 Olkiluoto (TVO) NPP TRS 48.1 (Fal) 33.9 (Spr) 44.6 Block of the British NPPs BBP 66.8 (Spr) 32.1 (Sum) 43.7 Block of the German NPPs BGP 45.6 (Win) 30.3 (Sum) 42.1
ACPD
3, 5319–5356, 2003
Assessment of possible airborne impact from nuclear
risk sites – Part II
A. G. Mahura and A. A. Baklanov Title Page Abstract Introduction Conclusions References Tables Figures J I J I Back Close
Full Screen / Esc
Print Version Interactive Discussion
Table 3. Seasonal variability of the maximum reaching distance indicator Nuclear risk sites NRS Area of MRD ·104km2
Maximum Minimum Annual average Novaya Zemlya Test Site NZS 1200.0 (Win) 361.4 (Sum) 903.5 Kola NPP KNP 975.2 (Spr) 427.1 (Win) 596.0 Leningrad NPP LNP 785.5 (Win) 330.9 (Fal) 691.6 Ignalina NPP INP 842.7 (Win) 540.0 (Sum) 703.0 Oskarshamn NPP ONP 1007.4 (Win) 457.1 (Spr) 595.1 Ringhals NPP RNP 1307.2 (Win) 618.1 (Fal) 854.5 Barsebaeck NPP BNP 1296.3 (Win) 547.9 (Fal) 815.6 Loviisa NPP LRS 1039.3 (Win) 475.9 (Sum) 810.3 Olkiluoto (TVO) NPP TRS 1160.4 (Win) 647.9 (Sum) 780.9 Block of the British NPPs BBP 1100.0 (Win) 385.9 (Spr) 817.0 Block of the German NPPs BGP 962.4 (Spr) 568.6 (Sum) 735.6
ACPD
3, 5319–5356, 2003
Assessment of possible airborne impact from nuclear
risk sites – Part II
A. G. Mahura and A. A. Baklanov Title Page Abstract Introduction Conclusions References Tables Figures J I J I Back Close
Full Screen / Esc
Print Version Interactive Discussion
ACPD
3, 5319–5356, 2003
Assessment of possible airborne impact from nuclear
risk sites – Part II
A. G. Mahura and A. A. Baklanov Title Page Abstract Introduction Conclusions References Tables Figures J I J I Back Close
Full Screen / Esc
Print Version Interactive Discussion
© EGU 2003
Figure 2. Characteristics and indicators of the risk site possible impact due to atmospheric
transport.
CHARACTERISTICS AND INDICATORS OF NRS IMPACT
Typical Transport Time
(TTT) Field Simple Characteristics for Selected
Geographical Regions:
- Upper & Lower Boundaries of NRS Impact - Average Transport Time
- Atmospheric Transport by Layers - Fast Transport, etc.
Atmospheric Transport Pathways (ATP)
Other Characteristics and Indicators of NRS Possible Impact
Maximum Reaching Distance (MRD) Airflow (AF) Probability Fields Fast Transport (FT) Probability Fields Precipitation Factor (PF) Maximum Possible Impact Zone (MPIZ)
Fig. 2. Characteristics and indicators of the risk site possible impact due to atmospheric trans-port.
ACPD
3, 5319–5356, 2003
Assessment of possible airborne impact from nuclear
risk sites – Part II
A. G. Mahura and A. A. Baklanov Title Page Abstract Introduction Conclusions References Tables Figures J I J I Back Close
Full Screen / Esc
Print Version Interactive Discussion
ACPD
3, 5319–5356, 2003
Assessment of possible airborne impact from nuclear
risk sites – Part II
A. G. Mahura and A. A. Baklanov Title Page Abstract Introduction Conclusions References Tables Figures J I J I Back Close
Full Screen / Esc
Print Version Interactive Discussion
ACPD
3, 5319–5356, 2003
Assessment of possible airborne impact from nuclear
risk sites – Part II
A. G. Mahura and A. A. Baklanov Title Page Abstract Introduction Conclusions References Tables Figures J I J I Back Close
Full Screen / Esc
Print Version Interactive Discussion
ACPD
3, 5319–5356, 2003
Assessment of possible airborne impact from nuclear
risk sites – Part II
A. G. Mahura and A. A. Baklanov Title Page Abstract Introduction Conclusions References Tables Figures J I J I Back Close
Full Screen / Esc
Print Version Interactive Discussion
Fig. 6. Annual fast transport probability fields after 12 and 24 h of atmospheric transport from the Kola NPP (KNP) and Novaya Zemlya test site (NZS).
ACPD
3, 5319–5356, 2003
Assessment of possible airborne impact from nuclear
risk sites – Part II
A. G. Mahura and A. A. Baklanov Title Page Abstract Introduction Conclusions References Tables Figures J I J I Back Close
Full Screen / Esc
Print Version Interactive Discussion
Fig. 7. Annual fast transport probability fields after 12 and 24 h of atmospheric transport from the blocks of the British NPPs (BBP) and German NPPs (BGP).
ACPD
3, 5319–5356, 2003
Assessment of possible airborne impact from nuclear
risk sites – Part II
A. G. Mahura and A. A. Baklanov Title Page Abstract Introduction Conclusions References Tables Figures J I J I Back Close
Full Screen / Esc
Print Version Interactive Discussion
Fig. 8. Annual fast transport probability fields after 12 and 24 h of atmospheric transport from the Ignalina NPP (INP) and Barsebaeck NPP (BNP).
ACPD
3, 5319–5356, 2003
Assessment of possible airborne impact from nuclear
risk sites – Part II
A. G. Mahura and A. A. Baklanov Title Page Abstract Introduction Conclusions References Tables Figures J I J I Back Close
Full Screen / Esc
Print Version Interactive Discussion
Fig. 9. Seasonal variability of the: (a) airflow probability fields for the blocks of the British (BBP) and German (BGP) NPPs;(b) fast transport probability fields after 24 h of atmospheric transport from the block of the British (BBP) and Loviisa (LRS) NPPs, and(c) fast transport probability fields after 12 h of atmospheric transport from the block of the British (BBP), Loviisa (LRS), and Barsebaeck (BNP) NPPs.
ACPD
3, 5319–5356, 2003
Assessment of possible airborne impact from nuclear
risk sites – Part II
A. G. Mahura and A. A. Baklanov Title Page Abstract Introduction Conclusions References Tables Figures J I J I Back Close
Full Screen / Esc
Print Version Interactive Discussion
Fig. 10. Annual boundaries of the maximum possible impact zone indicators (–HI SiteName–) after 24 h of atmospheric transport for selected NRSs in the Euro-Arctic region.
ACPD
3, 5319–5356, 2003
Assessment of possible airborne impact from nuclear
risk sites – Part II
A. G. Mahura and A. A. Baklanov Title Page Abstract Introduction Conclusions References Tables Figures J I J I Back Close
Full Screen / Esc
Print Version Interactive Discussion
Fig. 11. Annual boundaries of the maximum reaching distance indicators after 24 h of ) atmo-spheric transport for the(a) Block of the British NPPs (MD BBP), Oskarshamn NPP (MD ONP), Ignalina NPP (MD INP), and Kola NPP (MD KNP),(b) Block of the German NPPs (MD BGP), Loviisa NPP (MD LRS), Novaya Zemlya Test Site (MD NZS), and Leningrad NPP (MD LNP); and(c) Barsebaeck NPP (MD BNP), Ringhals NPP (MD RNP), and Olkiluoto NPP (MD TRS).
ACPD
3, 5319–5356, 2003
Assessment of possible airborne impact from nuclear
risk sites – Part II
A. G. Mahura and A. A. Baklanov Title Page Abstract Introduction Conclusions References Tables Figures J I J I Back Close
Full Screen / Esc
Print Version Interactive Discussion
Fig. 12. Annual typical transport time (TTT) fields at 1 (1d) and 2 (–2d–) days of atmospheric transport for the(a) block of the British NPPs (BBP), (b) Kola NPP (KNP), (c) Ringhals NPP (RNP), and(d) Novaya Zemlya test site (NZS).