HAL Id: hal-01215518
https://hal.archives-ouvertes.fr/hal-01215518
Submitted on 28 Jun 2016HAL is a multi-disciplinary open access archive for the deposit and dissemination of sci-entific research documents, whether they are pub-lished or not. The documents may come from teaching and research institutions in France or abroad, or from public or private research centers.
L’archive ouverte pluridisciplinaire HAL, est destinée au dépôt et à la diffusion de documents scientifiques de niveau recherche, publiés ou non, émanant des établissements d’enseignement et de recherche français ou étrangers, des laboratoires publics ou privés.
Digital image ratio: a new radiographic method for
quantifying changes in alveolar bone. Part II: Clinical
application
Alain Jean, Alain Soyer, Yves Epelboin, Jean-Pierre Ouhayoun
To cite this version:
Alain Jean, Alain Soyer, Yves Epelboin, Jean-Pierre Ouhayoun. Digital image ratio: a new radio-graphic method for quantifying changes in alveolar bone. Part II: Clinical application. Journal of Periodontal Research, Wiley, 1996, 31 (8), pp.533-539. �10.1111/j.1600-0765.1996.tb00517.x�. �hal-01215518�
Digital image ratio : a new radiographic method for quantifying changes in alveolar bone. Part II: Clinical application.
A. Jean+, A. Soyer++,Y. Epelboin++, and J.P. Ouhayoun+
+Département de Parodontologie, Faculté de Chirurgie Dentaire, Université Paris VII, 5 rue Garancière, 75006 Paris, France
++Laboratoire de Minéralogie-Cristallographie, CNRS UA 009, Universités P.M. Curie et Paris VII, Case 115, 4 place Jussieu, 75252 Paris Cedex 05, France
Running title: Digital image ratio technique. Clinical application.
Address for reprints : J.P. Ouhayoun, Département de Parodontologie, Faculté de Chirurgie Dentaire, Université Paris VII, 5 rue Garancière, 75006 Paris, France
ABSTRACT
In a previous paper (1) we have described a new technique, Digital Image Ratio (DIR), which theoretically avoids some of the drawbacks of quantitative digital subtraction radiography. DIR allows one to directly compute and visualize bone-mass-ratio changes. In this second part, DIR analysis was used to examine 20 sites in 8 patients undergoing regenerative periodontal therapy. Standardized reproducible radiographs of these 20 sites were taken before and 12 months after surgery. Ten experimental sites were treated with two types of bone graft substitute (Natural Coral and Natural Coral + Collagen), and ten control sites by debridement alone.
None of the experimental sites had a density ratio below 1, with 1 indicating no change. The range of error was evaluated to be ± 0.07 (0.93 - 1.07). The experimental sites showed a mean increase in bone density of 18% (1.18), which increased to 23% (1.23) for sites filled with natural coral alone. All the control sites had values close to 1.00 (1.00 ± 0.07) except for three sites, which showed a loss of bone density ranging from 9 to 15%. It is thus possible to compare and quantify the changes in experimental and control sites in the same patient using the percent gain or loss of bone density. This demonstrates that DIR may be suitable for clinical applications and can be used in clinical analysis, where bone changes are expected.
Key words: Image filtering; Image analysis; Image ratio technique; Dental radiography; Quantitative digital radiography; Periodontal disease.
INTRODUCTION
The detection of subtle bone changes may be of great value in evaluating progressive periodontal disease or bone gain after therapy. Conventional radiographs are routinely used by periodontists in spite of their limitations. These include the subjective interpretation of the radiographic image, lack of sensitivity, and no quantification of bone mass.
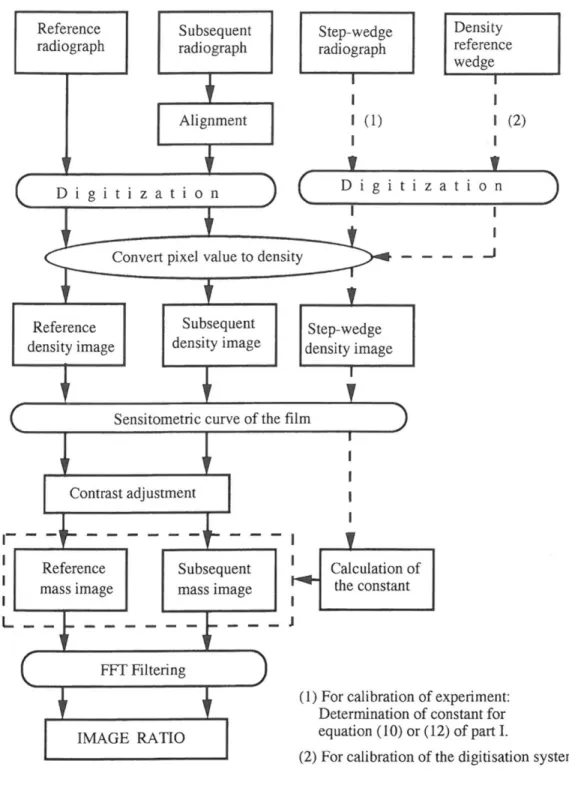
In a previous paper (1) we described a new technique, Digital Image Ratio (DIR), which theoretically avoids some of the drawbacks of other techniques (2-7). This technique was validated using standards. This second paper describes the clinical application of DIR. We used DIR to examine 20 sites in 8 patients undergoing regenerative periodontal therapy. The patients were enrolled in a clinical trial testing a bone graft substitute versus conventional debridement. The principles of DIR are summarized in figure 1. Radiographs which are to be compared are digitized. The densitometric response of the film is taken into account, as well as the non-linearity of the digitization system by a preliminary calibration using a stepwedge. Contrast adjustment is only used when the illumination conditions have been changed. The images are filtered by means of Fourier transforms to eliminate background noise. Finally, the image ratio is computed.
MATERIALS AND METHODS
Clinical experiment.
This study involves 8 patients (numbered 1 through 8) with 20 defects (table 1). Ten sites (labeled 1C1, 1C2, 2C, 3C1, 3C2, 4C, 5C, 6C, 7C and 8C) underwent debridement alone. Among the experimental sites, six sites (labeled 1E, 2E, 3E1, 3E2, 4E, 5E, 6E1, and 6E2) were treated with natural coral, and two sites were treated with natural coral + collagen (7E and 8E). Natural coral is a resorbable alloplastic porous biomaterial made of 95% of calcium carbonate (8). The digit in front of a label refers to the patient, the
digit at the end refers to the site in the case of multiple sites for the same patient. Thus one experimental site (1E) and two control sites (1C1 - 1C2) were from patient 1, two experimental sites (6E1 - 6E2) and one control site (6C) were from patient 6 and two experimental sites (3E1 - 3E2) and two control sites (3C1 - 3C2) from patient 3. One experimental and one control site from each of the remaining five patients were examined.
Radiograph recording.
Standardized reproducible radiographs of the 20 sites were taken before and 12 months after surgery. They are referred as T1 and T2. A Rinn XCP® film holder was modified by placing registration material (Impregum®) on the bite block to index the dentition (9). This device was coupled to a General Electric 1000 dental X-ray unit operating at 50 KV, 15mA. The focus-to-film distance was 20 cm. Radiographs were taken on Kodak Ultraspeed film (Eastman Kodak Co., Rochester, USA) for premolar and molar regions and on Kodak Ektaspeed for cuspid and incisor sites. Films were processed manually in a Kodak developer at 20°C for 4.5 min, in Kodak fixer for 10 min, then washed in running water for 20 min.
A step wedge made of ten superimposed layers of metal (from 0.045 to 0.45 millimeter thick) was exposed to the X-rays under the same conditions as those used for the patients (kilo-voltage, exposure time, focus-film distance, and Kodak film). This radiograph was processed at the same time and under the same conditions as the clinical radiographs. This calibration was made only once, and is one of the main advantages of DIR as explained in our previous paper (1).
Digitization of the images.
The standardized radiographs were placed in a view box fitted to a conventional microscope base that allowed X and Y translations and rotation of the film.
The images were digitized using a CCD high resolution Pulnix TM6 camera (Basingstoke, Hampshire, United Kingdom) coupled to a PC computer equipped with a Matrox® IP8 digitization card. The first radiograph was used as a reference for the geometric alignment of the second. The digitization program, Imagina (Biocom, Les Ulis, France), allows the contour of a tooth to be drawn on the first radiographic image and for this contour to be shown on the second radiographic image. The second radiographic image was only saved in a file when it was correctly aligned. Up to 32 frames were added together to enhance the signal-to-noise ratio (10). The information content of the digitized image was carefully checked: ideally, the pixel values should be within the range 0 - 255, and the mean value should be about half the maximum, so that the pertinent information is distributed over the maximum number of distinguishable grey levels. This was done by computing the histogram of the digitized image. The recording conditions were adjusted to obtain the best possible precision in the investigated area. These conditions may vary depending on these areas. Contrast adjustment is not the same when dealing with light or dark radiographs, where the grey range covers different values.
RESULTS
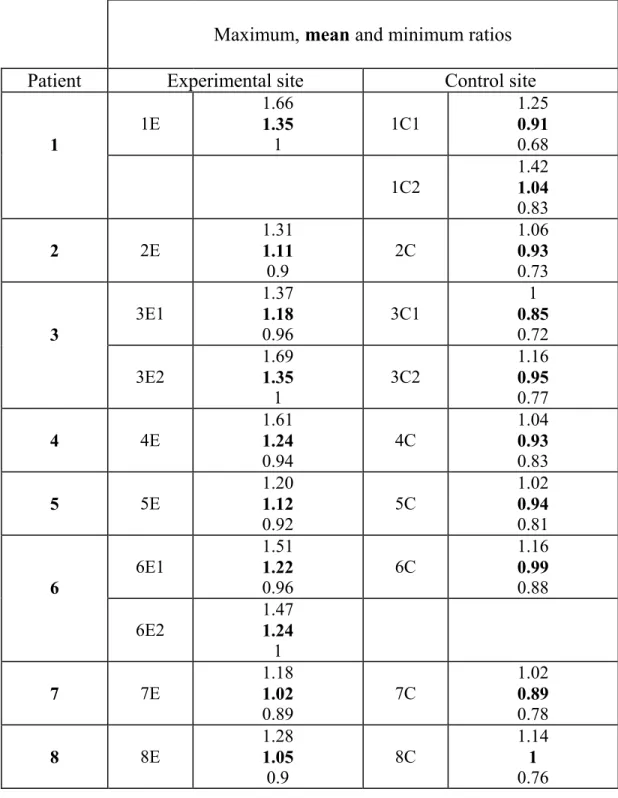
20 pairs of radiographs, for 20 sites in 8 patients, were treated according to this protocol. Table 1 shows the results of DIR analysis of these 20 sites. To illustrate the method we will discuss in detail the case of patient 1. However in table 1 we present the results for all sites and all patients.
Example of clinical application
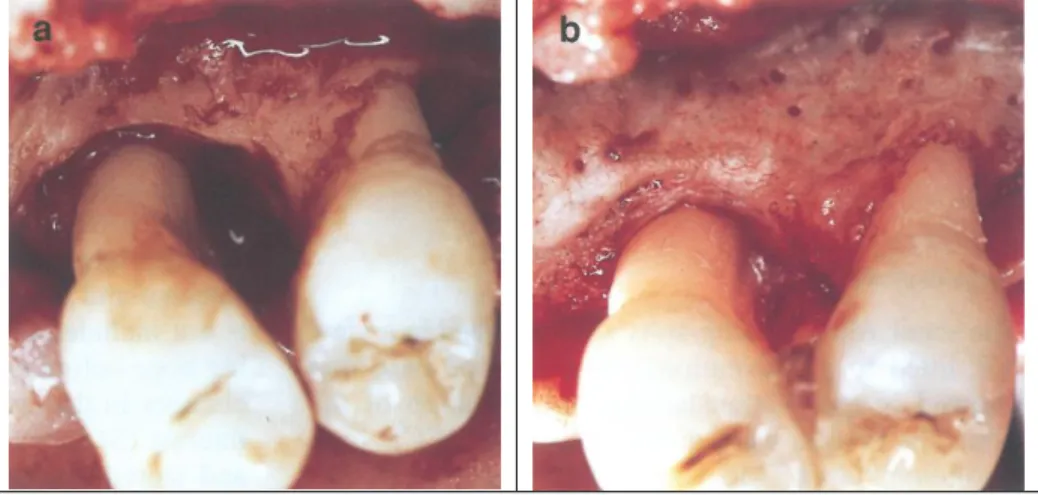
The maxillary left first and second premolars of patient 1 are used to illustrate the results of DIR analysis (Fig. 2). The distal of the left first maxillary premolar, was grafted with natural coral biomaterial (Biocoral® Inoteb France), and the distal of the left second premolar was used as control, after debridement alone. This example,
illustrated by the clinical views and radiographs of figure 2 (a, b, c and d), focuses on initial and 12-months post-operative changes in bone density (figure 2, e and f). Two Sites of Interest were selected based on clinical and radiographic parameters: 1E and 1C1. A third Site of Interest, located beneath site 1E and designating an area of existing marginal bone lining the defect, was also selected and labeled 1E* (fig. 2, f and h). This site is not listed in table 1, since it represents existing bone before grafting. It has however been selected because the changes in this area appeared unusual. Each Site of Interest (SOI) was outlined manually on the screen and stored for further use when comparing radiographs of treated teeth taken at different times.
The first SOI (labeled 1E) is the grafted osseous defect. Visual examination showed increasing density from the periphery to the center of the defect (fig. 2, e). The DIR ratios ranged from 1 to 1.66, with a mean value of 1.35. Since a value of 1 indicates sites without any change, 1.35 indicates a 35% gain in bone density, or bone mass in the SOI. The value 1.66 is the density in the center of the grafted site (Table 1). The second SOI (labeled 1E*) was located immediately beneath the graft, and showed a slight loss of density (figure 2 f and h). The ratios ranged from 0.77 to 1.09, with a mean of 0.89. This means a loss of bone mass (bone density) of 11%, with extremes at 23% loss and 9% gain.The third SOI (labeled 1C1) was a control site that included superficial and deep areas of bone. The ratios ranged 0.68 to 1.25, with a mean of 0.91.
Table 1 shows local variations within SOIs and so allows the sites to be classified according to the amount of change.
The mean ratio, written in bold characters, is defined as
PiN , where Pi is the sum of all the ratios values in all pixels and N is the number of pixels in the SOI. We recall from (1) that the image ratio is a pseudo-image where each pixel is the value of the bone mass ratio before and 12 months after surgery at the corresponding localization in the standardized radiographs. Minimum and maximum values must be analyzed very carefully: they may either correspond to a large area where all pixel values are maximum or to single points which may be artefacts due to a slight misalignement or a
local error in the digitization. We therefore prefer to compare the mean ratios (MR) which are the means of all the ratio values for the SOI. The range of error of the measurements was evaluated by measuring in all 20 cases an area, such as root dentin, where there was no variation, which means that the value should be 1. We found that the range of measurements for all these areas was 0.93 to 1.07. We thus evaluated the range of error to be ± 0.07. A deviation from 1 larger than 0.07 was never found, thus this is a conservative estimation. Assuming a Gaussian distribution for the errors, this represents the full width of the distribution curve of the errors, i.e.about twice the standard deviation. A variation larger than 0.07 indicates a change.
Several groups can be distinguished according to the extent of change, as evaluated by the mean values.
In experimental sites, the values ranged from 1.02 to 1.35. Three groups were identified:
- Zones free of significant change, ie. less than 7%: sites 7E and 8E. - Zones with a small density gain, from 8 up to 20%: sites 2E, 3E1 and 5E. - Zones with a significant gain, larger than 20%: sites 1E, 3E2, 4E, 6E1 and 6E2.
None of the experimental sites had a density ratio below 1.
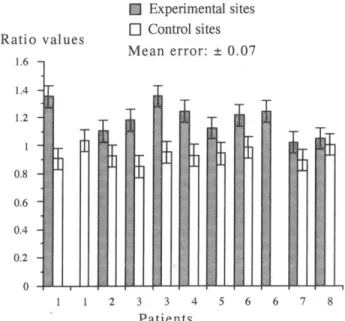
The Mean Ratios for the control sites (0.85 - 1.04) were divided into two groups. Sites 1C2, 2C, 3C2, 4C, 5C, 6C, and 8C showed no significant change with ratios ranging from 0.93 to 1.07 (1.0 ± 0.07). Sites 2C and 4C were at the lower limit. The second group included sites 1C1, 3C1 and 7C, where there was more than 7% loss of density. It is thus possible to compare and quantify the changes in experimental and control sites in the same patient using the percent gain or loss of bone density (Figure 3).
The Mean Ratios for the experimental sites were 1.02 - 1.35 (bold type). The values for sites 7E and 8E were lower than for the others. These sites were filled with coral-collagen, while the remaining 8 sites were filled with natural coral alone (Mean Ratios: 1.11 - 1.35). Thus the 10 Mean Ratios for the experimental sites showed a mean increase in bone density of 18% (1.18 ± 0.07), which increased to 23% (1.23 ± 0.07) for sites filled with natural coral alone.
DISCUSSION.
The digital image ratio (DIR) can be thought of as a map of mass variations which are shown in pseudo-colors to provide a direct image of the density variations throughout the image.
The Mean ratios for the control sites were all close to 1.00 (1.00 ± 0.07), except for site 1C1, 3C1 and 7C, which showed a loss of bone density. On the other hand grafting the sites with a resorbable material resulted in a gain in bone density of 18% (1.18) for all sites taken together, and if we delete the sites grafted with Coral-Collagen and consider only the sites filled with natural coral, the gain was 23%. Statistical analyses can be performed to evaluate the significance of the results, but this was not the purpose of this paper. However, the data do show the applicability of the DIR method. The data for the control sites indicate that they recovered almost all their original bone density in 12 months. This is in agreement with studies on post-surgical changes in bone density after treatment of periodontal disease (11-13).
In our example we found in SOI 1E*, subjacent to an area with a bone density gain 12 months after grafting, a loss of bone mass of 11%. This estimation is near the limit of accuracy of the method, and is clearly visible in the corresponding area in figure 2 f. This was not however an isolated case, but occured in many other grafts. The biological significance of this phenomenon cannot be explained at this stage of our experiment, but it warrants further consideration with more cases and other biomaterials. SOI 1C1 was a control site that included superficial and deep areas of bone. The ratios ranged from 0.68 to 1.25, with a mean of 0.91. This indicates a mean bone loss of 9%. The changes in density follow a clear pattern, with density gains of 25% ± 7% close to the root, and losses of 32% ± 7% in a more distal zone, which is superficial of cortical bone. The mean value has no real meaning since SOI 1C1 can be divided into two smaller areas where a bone gain occurs in the first one, a bone loss in the second one. Site 1E, grafted with natural coral, showed a significant bone gain of 35%. This is in agreement with clinical experiments showing a significant bone gain in periodontal infrabony defects, grafted with coral, versus debridement alone (14).
The Sites of Interest selected in our work, were always sites where bone density changed over the experimental period. Our results give the changes in bone density but not the percentage of defect filling. This may be measured by delineating the outlines of the defect on the initial radiograph (T1) and by superimposing it on the final radiograph (T2). This was not our main objective, but it may be done if necessary.
We will now compare DIR to quantitative subtraction methods: DIR as well Digital Image Subtraction (DIS) is sensitive to differences in image geometry of radiographs expressed by the deviation in angulation of the X-ray beam. This leads to artefacts and the resulting image may be difficult to interpret (15). DIS can only be used to provide differences in bone mass if a region of interest (ROI) is defined before and after changes. DIS uses an aluminium or bone wedge of known dimension for calibration, the digitized images are converted into densities (mm equivalents of aluminium or equivalent bone thickness) for quantitative subtraction (16-20). On the other hand, the Cadia method, as described by Brägger et al (5) measures changes with a relative volume unit, and a threshold value has to be defined according to conditions depending in each case analyzed (21).
The DIR method is much simpler, since it uses image ratios that do not require a difficult calibration. Results are read off directly, as explained in the following example: assume that in a selected area, just after surgery, the measured bone mass is 4 grams as measured using an Al or bone wedge. After 12 months post-treatment it becomes 5 grams. Consider now another area of interest where the measurements give 1 gram and 2 grams respectively. The quantitative difference, as measured by Digital Image Subtraction, is 1gram in both areas. But if these data are converted into mass ratios, the ratio is 1.25 in the first area and 2.00 in the second one, indicating changes in density of 25% and 100% respectively. It is this ratio which is measured directly by DIR which is of interest for the practitioner. Quantitative digital subtraction depends on a unit of measurement provided by a reference, while the imaging ratio requires no reference and gives access directly to the only interesting information. This flexibility makes the method more attractive.
CONCLUSION
We have reported a clinical application in which a resorbable biomaterial was used as a bone graft substitute to treat infra-bony defects. The DIR analysis, as a non-invasive method, was intended to evaluate the density of new bone formation. It may be used to detect early bone changes such as active sites (frequent pocket probing would likely interfere with the sub gingival microbial flora). To avoid large X-ray doses when frequent radiographs are recorded, we suggest to underexpose the films (22-24).
One of the advantage of DIR is that it uses Fourier filtering to reduce the effects of diffuse scattering which can be a non-negligible source of error in quantitative studies (1). This filtering enhances the sensibility compared to other methods where no filtering is made. The DIR method is directly quantitative; measurements are made on the resulting image without the need for a standard, and they reflect relative changes in density at a specific point or zone. These changes are expressed as percentages of bone change.
This work demonstrates that DIR may be suitable for clinical applications and may be used in clinical trials, where bone changes are expected. No attempt has been made at this stage to evaluate the benefits of biomaterial grafting in periodontal infra bony defects. This topic will be covered in a subsequent paper.
Acknowledgements
We thankM. Pilard for his help in image acquisition and filtering. Part of this work was supported by a grant from Scientific Board, Faculty of Dental Surgery, Paris 7 Denis Diderot.
References
1. Jean A., Epelboin Y., Rimsky A., Soyer A., Ouhayoun JP. Digital image ratio: a new radiographic method for quantifying changes in alveolar bone. Part I: theory and methodology. J. Periodont. Res. (accepted)
2. Ruttimann UE, Okano T, Grondahl H-G, Grondahl K, Webber RL. Exposure geometry and film contrast differences as bases for incomplete cancellation of irrelevant structures in dental subtraction radiography. 1981; Proceedings of SPIE. 314: 372-377.
3. Gröndahl HG, Gröndahl K. Subtraction radiography for the diagnosis of periodontal bone lesions. Oral Surg1983; 55: 208-213
4. Hausmann E, Christersson L, Dunford R, Wikesjö U, Phyo J, Genco RJ. Usefulness of subtraction radiography in the evaluation of periodontal therapy.J PeriodontRes 1986; 21: 716-721.
5. Brägger D, Pasquali L, Rylander H, Carnes D, Kornman KS. Computer assisted densitometric image analysis in periodontal therapy. A methodologicalstudy. J Clin Periodontol1988; 15: 27-37.
6. H-G Gröndahl. Digital radiology in dental diagnosis: a critical view. Dentomaxillofac.Radiol., 1992, 21: 198-202.
7. Payot P, Haroutunian B, Pochon Y, Herr P, Bickel M, Cimasoni G. Densitometric analysis of lower molar interradicular areas in superposable radiographs. J Clin Periodontol1987; 14: 1-7.
8. Ouhayoun J.P., Shabana AHM., Issahakian S., Patat J.L., Guillemin G., Sawaf M.H., & Forest N. Histological evaluation of natural coral skeleton as a grafting material in miniature swine mandible. Journal of Materials Science: Materials in Medicine 1992; 3: 222-228.
9. Rudolph D J, and White S C. Film holding instruments for intraoral subtraction radiography.Oral surgery, Oral Medicine, Oral Path.1988; 65: 767-772.
10. Tanner B.K., Cringean J.K. Real Time and Stroboscopic Topography. Prog.Cryst. Growth 1987; 14: 403-424
11. Henrikson CO, Bergström J. Quantitative long-term determinations of the alveolar bone mineral mass in man by 125I absorptiometry. Actaradiologica1974 ;13:
377-392.
12. Payot.P.,Bickel. M., and Cimasoni. G. Longitudinal quantitative radiodensitometric study of treated and untreated lower molar furcation involvements. J ClinPeriodontol 1987; 14: 8-18.
13. Brägger D, Pasquali L, and Kornman KS. Remodelling of interdental alveolar bone after periodontal flap procedures assessed by means of computer-assisted densitometric image analysis CADIA). J ClinPeriodontol1988; 15: 558-564.
14. Mora F. and Ouhayoun J.P. Clinical evaluation of natural coral and porous hydroxyapatite implants in periodontal bone lesions: Results of a 1-year follow up. J ClinPeriodontol 1995; 22: 877-884
15. Grondahl K, Grondahl H-G, Webber R L. Influence of variations in projection geometry on the detectability of periodontal bone lesions. A comparaison between subtraction radiography and conventional radiographic technique.J Clin Periodontology 1984; 11: 411-420.
16. Vos MH, Janssen PT, van Aken J, Heethaar RM. Quantitative measurement of periodontal bone changes by digital subtraction. J Periodont Res 1986; 21: 583-591.
17. Jeffcoat M.K., Reddy M.S., Van den Berg H.R., Bertens E. Quantitative digital subsraction radiography for the assessment of peri-implant bone change.Clin Oral Impl Res 1992; 3: 22-27.
18. Janssen, P. T. M. and van Aken, J. Problems around the in vitro and in vivo application of quantitative digital subtraction radiography. J ClinPeriodontol1989; 16: 323-330.
19. Dubrez B, Jacot-Descombes A., Pun T. and Cimasoni G. Comparison of photodensitometric with high-resolution digital analysis of bone density from serial dental radiographs. Dentomaxillofac. radiol. 1992; 21: 40-44..
20. Webber RL, Ruttimann UE, Heaven TJ. Calibration errors in digital subtraction radiography.J Periodont Res 1990; 25: 268-275.
21. Steffensen B., Pasquali L.A., Yuan C., Wood R.C., Scoolfield J.D. &Kornman K.S. Correction of density changes caused by methodological errors in CADIA. Journal of Periodontal Research 1989; 24: 402-408.
22. Epelboin Y, Jeanne-Michaud A, Zarka A. The Use of Nuclear Emulsions in X-ray Topography: Improvement of the Development Methods. J. Applied Cryst.1979; 12: 201-204.
23. Wenzel A. Effect of image enhancement for detectability of bone lesions in digitised intraoral radiographs. Scand J Dent Res 1988; 96: 149-160.
24. Fourmousis I., Brägger U., Bürgin W., Tonetti M., Lang N.P. Digital image processing. II. In vitro quantitative evaluation of soft and hard peri-implant tissue changes. Clin Oral ImplRes 1994; 5: 105-114.
Maximum, mean and minimum ratios
Patient Experimental site Control site
1 1E 1.66 1.35 1 1C1 1.25 0.91 0.68 1C2 1.42 1.04 0.83 2 2E 1.31 1.11 0.9 2C 1.06 0.93 0.73 3 3E1 1.37 1.18 0.96 3C1 1 0.85 0.72 3E2 1.69 1.35 1 3C2 1.16 0.95 0.77 4 4E 1.61 1.24 0.94 4C 1.04 0.93 0.83 5 5E 1.20 1.12 0.92 5C 1.02 0.94 0.81 6 6E1 1.51 1.22 0.96 6C 1.16 0.99 0.88 6E2 1.47 1.24 1 7 7E 1.18 1.02 0.89 7C 1.02 0.89 0.78 8 8E 1.28 1.05 0.9 8C 1.14 1 0.76
Table 1. Bone mass changes for each control and experimental site. A value lower than 0.93 indicates a density loss, a value higher than 1.07 a gain in bone density.
Fig. 1.Experimental methodology.
Fig. 2.Clinical application.
Teeth of patient 1 are shown as examples of digital image ratioing:
aand b: Initial and 1 year post-operative views of the bony defect.
Fig.2 e: Mean ratio in pseudo-colors for before surgery (T1) / recall (T2) digitized radiographs. Green, yellow and red areas indicate density gain. Areas without change are in blue. Density loss is shown in dark blue and violet. However, it should be mentioned that the clinical crowns of the two premolars were at the maximum range of saturation, thus giving an erroneous image of some loss of density. The recording conditions were adjusted so that the ideal values were at the sites of pertinent information: the bone areas grafted or controls.
Fig.2g: Density scale. From 0 (violet) to 255 (red).
Fig.2.f and h: SOI 1E is the grafted osseous defect. SOI 1E* is located beneath the graft, and SOI 1C1 is the control site.
Fig. 3.Comparison of the mean ratios for 20 control and experimental sites in the 8 patients.