HAL Id: hal-03123003
https://hal.archives-ouvertes.fr/hal-03123003
Submitted on 27 Jan 2021
HAL is a multi-disciplinary open access
archive for the deposit and dissemination of
sci-entific research documents, whether they are
pub-lished or not. The documents may come from
teaching and research institutions in France or
abroad, or from public or private research centers.
L’archive ouverte pluridisciplinaire HAL, est
destinée au dépôt et à la diffusion de documents
scientifiques de niveau recherche, publiés ou non,
émanant des établissements d’enseignement et de
recherche français ou étrangers, des laboratoires
publics ou privés.
Modeling of carbonaceous particles emitted by boreal
and temperate wildfires at northern latitudes
David Lavoué, Catherine Liousse, Hélène Cachier, Brian Stocks, Johann
Goldammer
To cite this version:
David Lavoué, Catherine Liousse, Hélène Cachier, Brian Stocks, Johann Goldammer. Modeling of
carbonaceous particles emitted by boreal and temperate wildfires at northern latitudes. Journal of
Geophysical Research: Atmospheres, American Geophysical Union, 2000, 105 (D22), pp.26871-26890.
�10.1029/2000JD900180�. �hal-03123003�
JOURNAL OF GEOPHYSICAL RESEARCH, VOL. 105. NO. D22. PAGES 26.871-26,890. NOVEMBER 27. 2000
Modeling of carbonaceous
particles emitted by boreal
and temperate wildfires at northern latitudes
David
Lavour,
1 Catherine
Liousse,
and
H616ne
Cachier
Laboratoire des Sciences du Climat et de l'Environnement, Centre National de la Recherche Scientifique-Commissariat h l'Energie Atomique, Gif sur Yvette, France
Brian J. Stocks
Canadian Forest Service, Forest Fire and Global Change, Sault Ste. Marie, Ontario Johann G. Goldammer
Max Planck Institute for Chemistry, Fire Ecology Research Group, Freiburg University, Germany
Abstract. For the first time, a spatial and monthly inventory has been constructed for
carbonaceous
particles
emitted
by boreal and temperate
wildfires in forests,
shrublands,
and
grasslands,
with burned area data statistics,
fuel load maps, fire characteristics,
and particle
emission factors. The time period considered is 1960-1997, and an important year-to-year variability was observed. On average, boreal and temperate vegetation fires represent 4% of global biomass burning, but during extreme years, their contribution may reach 12%, producing 9% and 20% of black carbon (BC) and particulate organic matter (POM),
respectively, emitted by worldwide fires. The North American component of the boreal forest
fires (Canada and Alaska) represents
4 to 122 Gg C yr-1 of BC and 0.07 to 2.4 Tg yr-1 of
POM emitted, whereas the Eurasiatic component (Russia and northern Mongolia) may vary in the 16 to 474 Gg C yr-1 range for BC and between 0.3 and 9.4 Tg yr-1 for POM, with however great uncertainty. Temperate forests in conterminous United States and Europe have a much lower contribution with an average of 1 1 Gg C yr-1 of BC and 0.2 T g yr-1 of POM. Grassland fires in Mongolia represent significant BC and POM sources which may reach 62
Gg C and 0.4 Tg, respectively.
Finally, an annual average
of BC emissions
for shrubland
fires
in both the Mediterranean region and California is 20 Gg C yr-1, with average POM
emissions of 0.1 Tg yr- 1. These source maps obtained with a high spatial resolution (1 ox 1 o) can now be added to previous ones developed for other global carbonaceous aerosol sources
(fossil fuel combustion,
tropical
biomass
burning, agricultural
and domestic
fires) in order to
provide global maps of particulate carbon emissions. Taking into account particle injection height in relation with each type of fire, our source map is a useful tool for studying the atmospheric transport and the impact of carbonaceous aerosols in three-dimensional transport and climate models.
1. Introduction
Incomplete combustion of wood and fossil fuel produces gases and particles (also referred to as total particulate matter (TPM)) in addition to CO2 and H20 [Cachier, 1992; Crutzen and Andreae, 1990; Levine et al., 1995; Cofer et al., 1997]. An important component of combustion aerosols is the total carbon (TC), composed of black carbon (BC) and particulate organic carbon (POC) or particulate organic matter (POM) if oxygen and hydrogen functions are included (a mass conversion POM = 1.3 x POC is used here). Both carbonaceous particle types display different radiative and chemical properties. Absorption properties characterize BC
•Now at Meteorological Service of Canada, Downsview, Ontario, Canada.
Copyright 2000 by the American Geophysical Union. Paper number 2000JD900180.
0148-0227/00/2000JD900180509.00
radiative behavior, whereas POC has light scattering
properties similar to sulfates [Sloane, 1983; Cachier, 1998; Liousse et al., 1995, 1996a].
Since biomass burning is a strong source of greenhouse gases, a first global estimation of burned biomass budget was calculated by Seiler and Crutzen [1980]. To provide biomass
burning BC and POC emission inventories, Liousse e! al.
[1996a] took into account the tropical biomass burning
scheme given by Hao et al. [1991] with few modifications and added global estimates of agricultural and domestic fires. They also included the main fossil fuel combustions (diesel
and coal). Contrary to biomass burning which is dependent on
meteorological conditions, seasonality and location of fossil fuel combustions are almost similar every year. However, on a global scale for an average year, both types of combustion emit equivalent amounts of particles. In both cases, POC is the major aerosol in the emissions.
The global climate impact estimation of carbonaceous aerosols by Penner et al. [1992] and Penner [1995] shows that added to sulfate particle impact they could offset the
26,872
LAVOUI2 ET AL.' CARBONACEOUS
PARTICLES
IN NORTHERN
WILDFIRES
increase of surface temperature by anthropogenic gases. However, with much shorter lifetime than gases [Ogren and Charlson, 1983], aerosol distribution is very patchy and
highly dependent on source location. This is one important
reason for developing or improving particle emission inventories at the regional scale.
Until now, boreal and temperate wildfires have not been
detailed in global emission inventories, since their
characteristics were not well known and they were thought to be negligible at the global scale. The first assessments
presented by Stocks [1991] emphasize a great interannual variability of burned area in boreal regions. Furthermore, the Arctic atmosphere has been shown to be polluted by
combustion products not only during the winter-spring seasonal Arctic haze [Bodhaine, 1995; Barrie, 1996; Hopper, 1991], but also during summer when atmospheric chemical
compound peaks may be unambiguously attributed to forest fires [Legrand et al., 1992; Dibb et al., 1996]. Chemical
studies of snow pits and ice cores from Greenland have confirmed the overwhelming impact of biomass burning in
summer over the Greenland ice sheet and shown its historical
variability [Cachier, 1995; Pertuisot, 1997; Legrand and De
Angelis, 1996; Chylek et al., 1992, 1995; Legrand et al., 1995;
Savarino and Legrand, 1998]. Moreover, Liousse et al. [1998] suggest that present-day levels of carbonaceous particles
would have a heating effect in Greenland due to the high snow surface albedo. This result should be taken into account in global warming scenarios: assuming a CO2 doubling for the next century, the boreal forest would then extend northward [Sargent, 1988], and this shift would result in increasing fire
risk and more fire activity over a longer fire season [Flannigan and Van Wagtier, 1991; Wotton and Flannigan,
1993; Fosberg et al., 1996; Flannigan et al., 1998; Stocks et
al., 1998]: boreal fires would then produce more particles and
closer to the Arctic region. Thus the heating effect of biomass burning particles in this region would even be enhanced.
The purpose of this paper is to present maps of boreal and temperate vegetation fires, taking into account their spatial distribution, seasonality, and interannual variability. It is the first time to our knowledge that such an exhaustive study has been conducted for these ecosystems. The products obtained in this work are maps and budgets of burned biomass and subsequent budgets of BC and POC emissions. The considered period is 1960 to 1997. Most burned areas were obtained from a compilation of statistics for countries and their administrative divisions when available in the literature. Monthly maps were developed at a 1 ø x 1 ø resolution. In addition, as injection height is a crucial parameter for the atmospheric lifetime and dispersal of particles, a scheme to estimate particle injection height in relation to fire intensity is
proposed.
2. Methodology for Emission Modeling
2.1. Boreal and Temperate Vegetation Types
Terrestrial ecosystems result from the conjunction of
climate and topography. Although a zonal variation of
vegetation obviously exists, the amounts of associated biomass depend on the location. We consider here three
different ecosystems subjected to fires at latitudes above
25øN: the boreal and temperate forests and woodlands, the
temperate shrublands, and the temperate grasslands. Fires
occurring in boreal and temperate vegetation zones are either
ignited by lightning (natural fires) or are of anthropogenic
origin. Fires may be characterized by their frequency and intensity [ Wein, 1993; Kasischke et al., 1995a].
2.1.1. Forests. High and middle latitude regions are covered by very important areas of forests and woodlands. The largest forest belt is the unaltered boreal forest coveting
10% of the Earth's land surface and located in North America
(Canada, Alaska) and Eurasia (Russia, Scandinavia) [Stocks, 1991; Goldamrner and Furyaev, 1996; Weber and Stocks, 1998]. The next forested area is the discontinuous temperate forest between 25øN and 50øN beneath the boreal region.
In this study, ground, surface, and aerial fuels are considered for forest fires, assuming that tree boles do not bum appreciably. For each fuel layer, the combustion efficiency depends on numerous parameters and characteristics (canopy height, branch dimensions, undergrowth vegetation), climate, meteorological conditions (wind velocity, air moisture), soil type, and topography. On- site observations point out two main types of fire propagation: surface fires, which spread horizontally consuming portions of ground and surface fuels, and crown fires,which consume crown or aerial fuels as well [Johnson, 1992; Bonan and Shugart, 1989; Stocks and Kauffman, 1997].
2.1.2. Shrublands. Shrublands are mainly composed of sclerophyllous plants, called by specific names according to their locations, as maquis or garrigue along the Mediterranean Basin coast or chaparral in California [Huetz de Letups, 1994]. The accumulation of fuels on the ground is very limited, since the dry Mediterranean climate type favors the fast decomposition of dead vegetation. During summer the strong winds usually prevailing drive vigorous fires in these dry well-arrayed standing fuels as illustrated by the southern California fires in 1993 [Food and Agriculture Organization (FA O), 1994].
2.1.3. Grasslands. Grasslands cover almost 80% of the
Mongolian territory, mostly in its eastern regions as steppes [FAO, 1996b] and large areas in central North America as prairies [Huetz de Letups, 1994]. They consist of a single main fuel layer. If grasslands are not fragmented by roads and agricultural systems, fuel uniformity allows fire to spread over large areas, as shown during the 1996 and 1997 fires in Mongolia [FA O, 1996b, 1998b].
2.2. Quantifieation and Mapping of Emissions
Our purpose is the construction of 1 ø x 1 ø emission maps. The initial relationship (1) of Seiler and Crutzen [1980] involving the burned area A (per year), the fuel load B, the aboveground fraction of vegetation o•, and the consumption efficiency [• gives the biomass Mc consumed annually:
Mc = A . B .ot
. [• .
(1)
As each 1
ø x 1
ø cell is a mosaic
of different
vegetation
types with different burning characteristics and as each
vegetation itself has different fuel layers, it is thus mandatory
to adapt relationship (1) to take into account this diversity.
For each 1 o x 1 ø cell we consider that vegetation type (k) can be boreal forest, temperate forest, grassland, and shrubland.
For each vegetation type, fuel layer (i) to be considered is either the canopy, the surface, or the ground (maximum 3).
The consumed biomass Mc (in metric tons) for each grid cell
LAVOUI2 ET AL.: CARBONACEOUS
PARTICLES
IN NORTHERN WILDFIRES
26,873 wherem[
Mc
= Z (%Sk
' A)'
• •k,i
' Bk,
i ,
k=l i=1 (2)k number of vegetation types (m); i number of fuel layers (n, 3 maximum); A area affected by fires (in hectares);
St, percentage of box area covered by the vegetation k; Bgi biomass load (in tons per hectare) of the fuel layer i for
the vegetation k;
[•gi combustion
efficiency
(in percent)
of the fuel i for the
vegetation k.
The fuel consumption values (B&i '[•k,•) chosen for different
ecosystem types will be discussed later.
Then for each 1 ø x 1 ø cell, equation (3) determines the total mass Q(X) of particle (X) emissions, providing the emission factor EF(X) value for particles:
Q(X) = Mc . EF(X) . (3) EF(X) is obtained in grams per kilogram of dry matter (g.
(kg dm)
'•) and
corresponds
to the
mass
ratio
of X emissions
to
the burned dry matter. EF(X) is highly and mostly dependent on the combustion mode. During prescribed or controlled burnings in various ecosystem types, CO/CO2 ratio values measured in the plumes allow definition of combustion modes. The two extreme cases usually considered are the flaming phase versus the smoldering phase: smoldering phases are characterized by much higher CO/CO2 and particle emission factors than those observed during flaming phases. Furthermore BC/POC ratios may give some information about combustion quality; lower BC/POC ratios would correspond to smoldering phase emissions [Mazurek et al., 1991; Cachier et al., 1996; Cofer et al., 1996a, b].
2.2.1. Construction of the vegetation map. Up to now, vegetation map construction consisted of associating the same fuel loads and consumption efficiencies to a given ecosystem when affected by fires, whatever its location [Cooke and Wilson, 1996]. Since the response of any ecosystem depends on its location, the purpose in this work was to adapt an existing vegetation map to regional fire characteristics.
Furthermore, we had to find a compromise for the spatial resolution of the vegetation map: a too coarse spatial
resolution does not include any details of vegetation, whereas
a too high resolution
gives too many details, requiring
assumptions in terms of fuel loads since accurate biomass
data are actually missing in the literature. We used the 1 km x 1 km International Geosphere-Biosphere Programme
land cover map decreased to 0.5øx 0.5 ø with 20 land cover
types obtained from the Biosphere-Atmosphere Transfer Scheme (BATS) [Dickinson et al., 1986]. The different cover
types are listed in Table 1. Then data have been fitted to a løx 1 ø map keeping the resolution at 0.5øx 0.5 ø for land
cover data.
Finally, the method chosen here was to convert the area
burned annually over a region to a percent of land. This method avoids artifacts such as emissions in the ocean and
allows taking into account the border between two countries. In addition, the seasonality of burned areas was obtained as a monthly percentage of the annual value.
Table 1. The 20 Land Cover Classes of
the Biosphere-Atmosphere Transfer
Scheme (BATS) [Dickinson et al., 1986] Code Land Cover Class
1 crops, mixed farming 2 short grass
3 evergreen needleleaf trees
4 deciduous needleleaf trees 5 deciduous broadleaf trees
6 evergreen broadleaf trees 7 tall grass
8 desert 9 tundra
10 irrigated crops
11 semidesert
12 ice caps and glacier 13 bogs and marshes
14 inland water 15 ocean 16 evergreen shrubs 17 deciduous shrubs 18 mixed woodland 19 interrupted forest
20 water and land mixture
2.2.2. BC and POC emission factors. Available data
may be BC and/or TPM emission factors, BC/TPM ratios and POC/TPM ratios. However, when data were not available for
the ecosystem considered, experimental values for the ecosystem with the closest properties were applied. The estimation of BC and POM emission factors for the three
ecosystem types, previously described in section 2.1, are
presented below. Their values are summarized in Table 2.
Fire phases were taken into account for the calculations. For every vegetation type, the same emission factors of BC and
POM were applied to all fuel layers, as the fire stage (flaming
versus smoldering) is the main driver for emissions and since
no specific data for each layer are at present available in the
literature.
2.2.2.1. Forests: During boreal stand-replacing forest
fires in Canada
and Siberia,
the flaming phase is always
followed by a smoldering phase, mainly resulting from the combustion of the ground humus layer, which is particularly compact in boreal regions [Corer et al., 1998]. In this study we assumed that 50% of biomass is consumed during flaming and 50% during smoldering. The choice for BC and POM emission factors shown in Table 2 was realized by using the
following different set of data.
Only one experimental value for the BC emission factor for
the smoldering phase of a temperate wildfire is provided in
the literature
[Hobbs
et al., 1996]; EF(BC,)= 0.78 g C (kg
dm)
'•. And no other
particle
emission
factor
nor BC/TPM
ratios are available for boreal and temperate forest wildfires. Logging slash burning and fireplace combustion results
[Patterson and McMahon, 1984; Turco et al., 1983; Crutzen
et al., 1984; Radke et al., 1988; Mazurek et al., 1991; Susott et
al., 1991] were also used in our calculations since results are
consistent with boreal stand-replacing fires. For instance, Patterson and McMahon [1984] indicate strong BC emissions
during
a flaming
phase
with EF(BC)= 2.55 g (kg dm)
'•
whereas Susott et al. [1991] determined low BC emissions
26,874 LAVOUI2 ET AL.: CARBONACEOUS PARTICI,ES IN NORTHERN WILDFIRES Table 2. BC Emission Factors (EF(BC)), Particulate Organic Matter to Black Carbon Ratios
(POM/BC),
and
Main Fire
Phase
for Fires
in Forests,
Shrublands,
and
Grasslands
Ecosystems Fire Phases EF(BC), POM/BC
g C (kg dm) -• Boreal and temperate forests 50% flaming, 50% smoldering 0.75
Shrublands flaming 1.60 a
Grasslands
flaming
0.8
b
a Radke et al. [ 1991 ] and Liousse e! al. [ 1996a, b]. • Liousse et al. [ 1996a].
19.9
7.15 a
7.15 •
In addition, the POC emission factor was derived from the mean ratio POC/BC = 15.3 calculated with data from one
wildfire and some logging slash fires [Mazurek et al., 1991; Hobbs et al., 1996], and so we adopted a POM/BC ratio value
of 19.9.
Values were applied indifferently to both coniferous and broadleaf tree burnings. In the future these estimations will need to be compared with field values.
2.2.2.2. Shrublands- As far as we know, no measurement
of the carbonaceous particle emission factor for the Mediterranean vegetation-type fires has yet been performed. However EF(TPM) and C0/C02 ratios were measured during prescribed California chaparral fires by Radke et al. [1991] and Cofer et al. [1989], respectively. The relatively low ratio (around 6.5%) characterizes a combustion with a prevalent flaming phase. But the relatively high TPM emission factor of
15 g (kg dm)
-1 may
indicate
special
burning
conditions
due
to
the chemical composition of the vegetation. In order to calculate EF(BC), we then used the previous TPM emission factor given by Radke et al. [1991] and the POM/BC ratio measured in the flaming phase of grass fires [Liousse et al., 1996b], and we assumed_that POM is 85% of (TPM-BC) according to Liousse et al. [1996a] (Table 2).
2.2.2.3. Grasslands: In both Mongolian and American grassland ecosystems, two types of fires may occur. The large spring fires in the wide Mongolian steppe consume primarily the fine dead grass which still has a high moisture level after winter snowpack melting (A. Sukhinin, personal communication, 1998)' the resulting fire is then a flaming combustion of moderate intensity. On the contrary, most of the fires in American prairies occur in summer in drier vegetation, with a higher-intensity flaming phase. In addition, strong warm winds may accelerate and improve the
combustion. As no BC emission factor was available for
grasslands, we have decided to use the value applied to African dry and humid savannas by Liousse et al. [1996a],
since both cases show similar results. Values for BC and
POM emission factors are given in Table 2.
3. Results' Boreal and Temperate Emissions of
Carbonaceous Particles
In order to estimate emissions by vegetation fires at boreal and temperate latitudes, North America was divided into
Canada and the United States, and Eurasia was divided into
Russia, Mongolia and Europe, North Africa, and the Middle East, according to available burned area statistics and ecosystem patterns. Our goal was to characterize a group of
countries (e.g., Scandinavia), a country (e.g., France), a region
(e.g., the Mediterranean Basin), or an administrative division
(e.g., Canadian jurisdictions) by a level of BC emission.
Burned areas, fuel consumption, and BC emission factors were combined to produce emission maps. It must be noted that fires over a great portion of China were not included here, since subtropical regions are already included in the previous inventory of Liousse et al. [1996a]. However, fires in the northern part of the country were considered for the extreme
fire case of 1987 [Cahoon et al., 1991].
3.1. Canada
We decided to build BC emission maps on a national basis. Indeed, statistical data of areas burned by forest fires at the national scale or for the provincial/territorial divisions and
federal parks are available
for the 1918-1997
period in
different works of Harrington [ 1982], Canadian Forest Service [1996, 1997], Stocks' and Barney [1981], and Ramsay and Higgins [1991]; burned areas in federal parks are not included in statistics for provinces and territories. The 12 Canadian provincial/territorial jurisdictions are Alberta (AB), British Columbia (BC), Manitoba (MB), New Brunswick (NB), Northwest Territories (NWT), Newfoundland (NF), Nova Scotia (NS), Ontario (ON), Prince Edward Island (PEI), Quebec (QC), Saskatchewan (SK), and Yukon Territory (YT)
(Figure 1).
3.1.1. Burned areas. The total burned area shows a great year-to-year variability [Stocks', 1991]. According to M.D. Flannigan (personal communication, 1998), Canadian burned
areas can be considered reliable since 1960 only, as some
large fires, especially in the northern regions of the country, may not have been recorded before; the last 35 years of
statistics show that in these remote boreal areas huge fires
may occur.
Over this period the average contribution of the Atlantic
provinces
(NB, PEI, and NS) represents
only 0.8% of the
total. Moreover, although since 1970 burned areas in federal parks show a great interannual variability, they are low as well (1.7%). Burned areas in both the Atlantic provinces and federal parks were then assumed to be negligible in
comparison
with the nine other
provinces
and territories,
and
they were not taken into account
in the following
emission
calculation.
3.1.2. Fuel consumption map. The Canadian territory is covered by 418 million hectares of forests, and boreal forest occupies 75% of the total forested area [Canadian Forest
Service, 1996; Weber and Flannigan, 1997]. The country was divided in seven distinct forested regions coding from I to VII
(as shown in Figure 1). Each one of these forested regions may be roughly characterized by main tree species given by
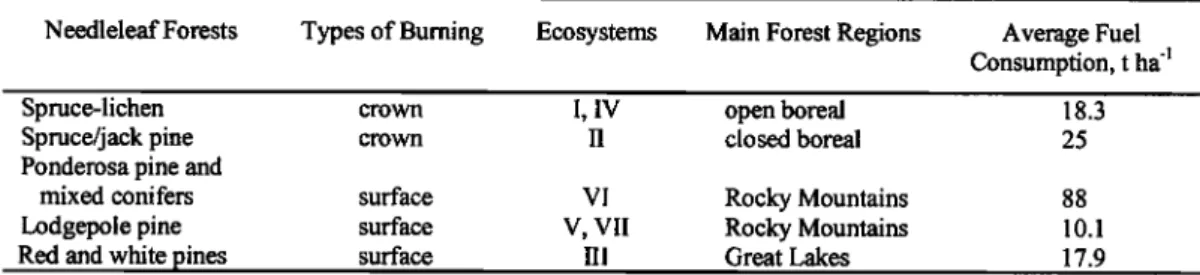
the Canadian Forest Service [1996]. Table 3 presents the five
Canadian needleleaf trees mostly associated with forest fires and their characteristic fire types (crown versus surface burning). These five tree species were then associated with
LAVOUE ET AL.: CARBONACEOUS PARTICLES IN NORTHERN WILDFIRES 26,875
Arctic
Subarctic
Cordilleran
(IV)
•
•':':"::"•
"•'""••••••
•ø•
•=•••'"
':•••'--••••'
"•'••
-"'
'"
'
Subarctic(I,
ß
•.
" ... •':'"":
':
•:'•.:.:•
....
•:•'1•:•
;'•::::::::
...
•-•'•••••.•.•••
...
"/="'•"•'•:.:.-.•
•:'•::•••:•••••
Boreal
(II)
=======================
' .
Pacific Cordilleran (•II)
. ::.
:}':'
::•
========================================================================
...
=,
Interior
Cordilleran
(VI)
/ • •: •_...:•.•••••/?.•?.:.:::::?.:•:•::::::gg?:::::
,- ========================================================== ======================================================================================================================....
.../ ...
ß ...• ...•...•...•..•..•:••..•.••••••••••
•rasslands
•
•"-'"'•••':••"••'••••••.•
..•
'"•'•' I
NS
Temperate
(HI)
•••
NB
Limits of forest regions
Administrative divisions
Figure 1. The seven Canadian forest regions considered in this study [from Stocks et al., 1996a] with AB,
Alberta; BC, British Columbia; MB, Manitoba; NB, New Brunswick; NWT, Northwest Territories; NF, Newfoundland; NS, Nova Scotia; ON, Ontario; PEI, Prince Edward Island; QC, Quebec; SK, Saskatchewan; and YT, Yukon Territory.
the seven previous forest areas in order to define five different
main fuel consumption regions (I and IV, II, VI, V and VII,
III). Fuel consumption values were obtained from Stocks and
Kauffman [ 1997].
Crown fires are common in Canada and particularly in the boreal zone. Since Stocks and Kauffman [ 1997] showed that
25 t ha
'] is the average
consumption
value
for the main
boreal
forest (closed forest), this type of fire accounts for most of the biomass burned. However, in the case of longneedle coniferous species ecosystems such as the Ponderosa pine, the amount of fuel burned by surface fire may also be significant. Furthermore, consumption data, given in Table 3, were utilized according to the nonuniformity of vegetation revealed
by the 0.5 ø x 0.5 ø BATS ecosystems (section 2.1.1). Specific fuel consumption was attributed to each patch of different
forest types:
1. The minimum fuel consumption level found in the
Canadian
forest,
10t ha
'•, was applied
to the deciduous
broadleaf forest (BATS class 5).
2. The value for the mixed forest (BATS class 18) close to the closed boreal forest has been assumed to be the average
between
broadleaf
(10 t ha
']) and spruce-lichen
(25 t ha
-])
forests.3. Shrubs (BATS classes 16 and 17), bogs and marshes
(BATS class 13) are mainly located in the open forest where
spruce-lichen
dominates
(25 t ha-I).
4. The amount burned for the interrupted forest (BATS
class
19) depends
on its location
(from
10 t ha
'• to 25 t ha-I).
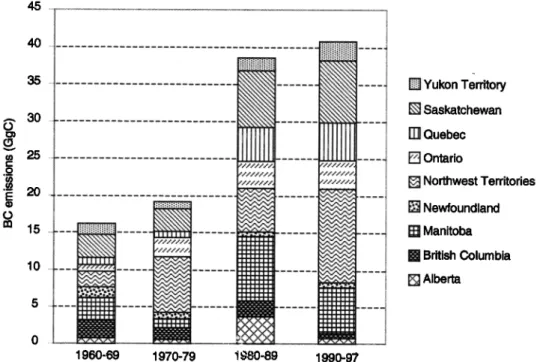
3.1.3. Emission trends. Burned areas were combined
with the fuel consumption map, and BC emissions were calculated with the BC emission factor of forest fires. Figure
2 shows decadal BC emissions for the nine Canadian provinces and territories. It clearly points out a strong increase
of th• total emissions since 1960, with a clear acceleration
(19.3 Gg C to 38.6 Gg C) between the 1970s and the 1980s, mainly in Saskatchewan, Manitoba, and Alberta (4.8 Gg C to
20.0 Gg C) and in Quebec (0.8 Gg C to 4.6 Gg C). In the Northwest Territories, 2.1 Gg C of BC were emitted in the 1960s but reached 12.6 Gg C in the 1990s. This tremendous
increase may be attributed to an evolution in the fire suppression policy (improved detection and monitoring capability) during the last four decades and to favorable
climatic conditions, the 1980s being the warmest decade in Canada since 1891, when temperatures were first recorded [Gullet! and Skinner, 1992]. This trend continued in the 1990-
1997 period with a calculated mean of 41 Gg C, and the
Table 3. Main Composition
of Canadian
Vegetation
with Burning
Characteristics
Including
Prevalent
Fire Phases
and Chosen
Fuel Consumptions
Needleleaf Forests Types of Burning Ecosystems Main Forest Regions Average Fuel
Consumption, t ha Spruce-lichen crown I, IV open boreal 18.3 Spruce/jack pine crown II closed boreal 25 Ponderosa pine and
mixed conifers surface V! Rocky Mountains 88
Lodgepole pine surface V, VII Rocky Mountains 10.1
26,876
LAVOUI• ET AL.: CARBONACEOUS
PARTICLES IN NORTHERN WILDFIRES
45 4035
• Yukon
Territory
30
•! Saskatchewan
• rr11 Quebec • 25 E• Ontario o o•o• 1• Northwest Territories
.o•
E 20
• • Newfoundland
rn 15
I:B
Manitoba
10
Bil
British
Columbia
[• Alberta
.
1960-69 1970-79 i 980-89 1990-97
Figure 2. Estimations of black carbon emitted by forest fires in main Canadian jurisdictions by decade since
1960.
statistic for the 1998 year leads to a peak value of 67 Gg C emitted (the burned area data available on the Canadian Forest Service internet web site was used for estimating this value).
Most of the time, 50% or more of the annual emissions are
due to the contribution of two or three provinces/territories only. As is shown by the mean annual pattern obtained for the
1960-1997 period (Figure 3), emissions originate essentially from central Canada (northern Saskatchewan, Manitoba, and western Ontario) and the Northwest Territories. Lightning is particularly efficient in the northern regions, where the level of protection against fires is the lowest. The Canadian Forest Service [ 1997] indicates that 42% of total fires are ignited by lightning and represent 85% of the total burned area. Also,
since these regions have a strong continental climate and are wide forested plains permitting fires to propagate on very large areas, this spatial distribution of fires and BC emissions is not unexpected.
Nevertheless, main uncertainty on emission maps is due to our way of distributing the burned area statistics data for each jurisdiction. Indeed, in areas where large fires dominate such as in the central boreal region of Canada, total emissions are stretched across an area larger than the fire region. As was indicated by Stocks et al. [ 1996a], only 3% of the fires, larger than 200 ha, which geographical pattern is very similar to the emissions shown in Figure 3, are responsible of 95% of the annual Canadian burned area. This scaling problem, which is not important for transport models with spatial resolution
0 2 4 6 8 10 12 14
Figure
3. Annual
average
map
of black
carbon
emitted
by Canadian
forest
fires
for the 1960-1997
period
(in
LAVOU]2
ET AL.' CARBONACEOUS
PARTICLES
IN NORTHERN
WILDFIRES
lOO% 90% 8O% 70% 60% 5O% 40% 30% 20% lO% 0%West Central East Northwest
• Sep
•
Aug
• Jul
:'".':C•
Jun
•
May
Figure 4. Seasonality of the 1960-1995 fires in western, central, eastern, and northwestern Canadian regions. The average Canadian fire season is from May to September, with main burned areas during the May to August period.
26,877
lower than 1 o x 1 o, has to be improved in the future for higher resolution. It is interesting to note that our geographical distribution is likely to be correct for extreme western and
eastern regions of Canada, as large fires are not common in
these areas.
3.1.4. Seasonality. Johnson [1992] and Flannigan and
Harrington [1988] showed that extreme fire periods are
usually associated with the existence of an upper high-
pressure ridge blocking westerly flows and creating dry, precipitation-free weather favorable to large fire ignition and propagation. A detailed analysis of upper level ridging and area burned in Canada, carried out by Skinner et al. [1999] for the 1953-1995 period, supports this hypothesis, determining
four regions ("western", Alberta and British Columbia; "central", Saskatchewan, Manitoba, and northwest Ontario;
"eastern", northeast Ontario, and Quebec; "northwestern", Northwest Territories and Yukon Territory) where burned areas are strongly correlated with the strength and frequency of anomalous tropospheric ridging.
Although fires do occur throughout the spring, summer and fall seasons in Canada, the vast majority of fires occur during the May-September period [Canadian Forest Service, 1997].
Figure 4 presents the seasonality of burned areas for each of
these four main regions. Only the western region has sizeable
fires late in the season in September. In the northwestern
region, 85% of the burned area appears in June and July, as
longer summer days dry out ground fuels [Wein and
MacLean, 1983] and allow fires to propagate over larger
areas. Fire temporal patterns for eastern and central regions
are similar to each other.
45 40 35 • 30 • 25 .• 20 o'*- 15 10 5 0
Jan Feb Mar Apr May Jun Jul Aug Sep Oct Nov Dec
Months
Figure 5. Average seasonality of Alaskan burned areas. The fire season peak is in July, which corresponds to 40% of the annual burned area.
26,878 LAVOUI• ET AL.' CARBONACEOUS PARTICLES IN NORTHERN WILDFIRES
3.2. United States
Vegetation fires in the whole United States are observed
and controlled by numerous federal and state agencies. The National Interagency Fire Center (NIFC) compiles data for 11 geographic regions: Alaska, eastern, eastern Great Basin, northwest, northern California, northern Rockies, Rocky
Mountains, southern, southern California, southwest, and western Great Basin. Our aim was to characterize each NIFC
region by a level of BC emission as we previously did for Canada at provincial and territorial scales.
3.2.1. Burned area and fuel consumption data. The
conterminous United States and Alaska were studied separately. National burned area statistics for the United
States are available for 1977-1994 and 1997 and for only a few years for each NIFC region (FAO [1989, 1990a, 1993a, 1995a] and NIFC). In order to define a fire seasonality for the conterminous United States, we used the 1 ø x 1 ø temporal and spatial distribution of large burned areas (200 ha minimum) for 1987 and 1989 given by two U.S. agencies, the Bureau of
Land Management and the U.S. Forest Service. Annual
burned areas in Alaska for the 1960-1997 period were
provided by E. Kasischke (personal communication, 1998):
although they show an important interannual variability
typical of the boreal ecosystem, we note a net decreasing
trend likely due to a more successful fire suppression policy [Stocks, 1991 ].
3.2.1.1. Conterminous United States: In the contermi-
nous United States, three main regions wn'h different fuels were distinguished: (1) forests in the east and northwest, (2)
Mediterranean vegetation-type shrublands as chaparral in the
Californian area and as sagebrush in the Great Basin, and (3)
prairies in the central plains. Since few data exist on fuel load
and fuel consumption [Stocks and Kauffman, 1997; Trabaud
et al., 1993], numerous assumptions on fuel consumption values were taken. Finally we applied the Table 2 EFs.
3.2.1.2. Alaska: The Alaskan peninsula contains 4.5% of the global boreal forest [EUROFOR, 1994]. Mean seasonality
for burned areas from the 1960s to the 1990s was provided by
E. Kasischke (personal communication, 1998). As shown by Figure 5, the fire season peaks in July and August with a total of •-70% of the annual burned area. It is consistent with the 1987 and 1989 data. This pattern is more pronounced than
that for northern Canadian territories (NWT, YT) previously
studied, probably because the climate is more continental in
interior Alaska [Bonan and Shugart, 1989], where most fires occur. Furthermore, Alaska is characterized by a higher level
of fuel consumption
with 75 t ha
'1 because
of a greater
accumulation of ground fuel [Kasischke et al., 1995b].
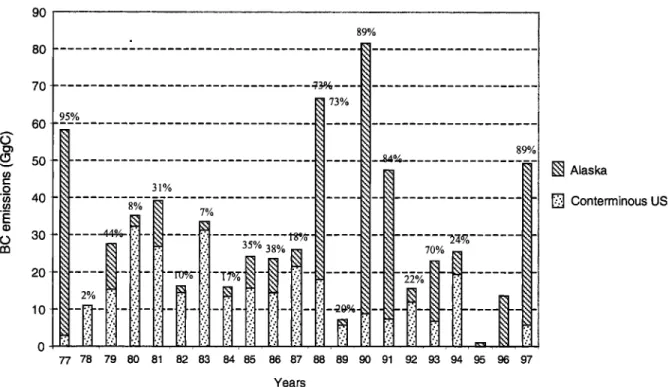
3.2.2. Emissions. Calculated annual BC emissions for
both the conterminous United States and Alaska, presented in Figure 6, vary from 1 Gg C (1995) to 82 Gg C (1990). Such a high range is mainly explained by fire variability in Alaska.
Indeed, the mean emission of the conterminous United States
for the whole period is 15 Gg C with a standard deviation of
8.4, showing a relatively more important stability than boreal U.S. regions, which are responsible for 41% of the total U.S.
emissions with a huge year-to-year variability. In 1990, 89%
of the U.S. emissions were situated in Alaska.
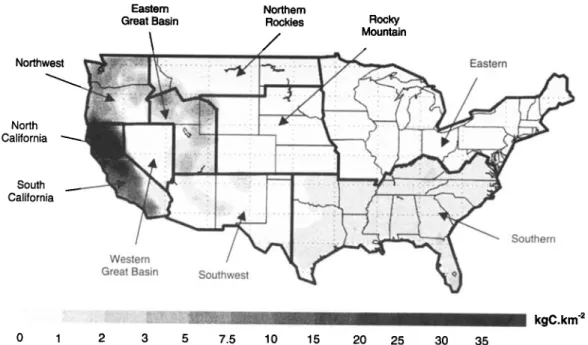
To complement the study, Figure 7 presents a map of BC average emissions. Main emissions are located along the West Coast, from Washington State to southern California. A huge emission peak is obvious in northern California owing to forest and chaparral fires, 3000 times larger than emissions estimated for the eastern region. However extensive fires are known to occur frequently in Florida (e.g., 1998) and do not
show up on the map owing to its resolution
and the NIFC
90 80 60 • 50 o '• 40 o •0 20 95% 31% 8% - 7% 35% 38% 89% 89%1
'i • Alaska
'..• Conterminous US 10 0 77 78 79 80 81 82 83 84 85 86 87 88 89 90 91 92 93 94 95 96 97 YearsFigure 6. Interannual
variability
of black
carbon
emissions
by U.S. fires.
Boreal
contributions
by Alaskan
fires are indicated in percent (note that no burned area data are available for the conterminous United States in
LAVOU• ET AL.' CARBONACEOUS
PARTICLES
IN NORTHERN
WILDFIRES
26,879
Eastern Northern
Great Basin Rockies Rocky
ß
.
Mountain
Eastern
Great
•asm Sauthwest
0 1 2 3 5 7.5 10 15 20 25 30 35
Figure
7. Spatial
distribution
of average
annual
emissions
of black
carbon
for the conterminous
United
States (in kilograms of carbon per square kilometer).
subdivision sizes. As for Canada, the geographical distribution of emissions on NIFC subdivisions has to be
improved in the future.
3.3. Russia and Mongolia
Two thirds
of the global
boreal
forest
is situated
in Russia.
The Russian boreal zone stretches from northern Siberia to
northern
Mongolia,
limited in its southern
part by wide
grassland
areas
and far south
by the Gobi Desert.
The three
Siberian
boreal
regions,
west
Siberia,
east
Siberia,
and far east
are characterized
by different topographies:
marshlands,
plateaus,
and mountains,
respectively.
In addition,
they
display
strong
longitudinal
and latitudinal
variability
of
weather
patterns
[Elhai• 1968; EUROFOR,
1994]. These
different factors create a great variability of fuel loads and combustion efficiencies, whose respective values are difficult
to assess.
At present,
very few fuel consumption
and fuel load data
are available:
1. The 1993 Bor Forest Island Fire Experiment took place
in the taiga of Western
Siberia
[FIRESCAN
Science
Team,
1996]. The combustion
efficiencies
of the floor woody
material and surface layer/litter were around 50% and 100%,
respectively. Moreover, 50% of the compact duff layer was burned. As is indicated in Table 4, both surface and crown fires may potentially occur and would burn respectively 32.5 t
ha
-• and 37.1 t ha
-l, respectively.
But since
75% of Russian
fires are surface fires, we applied surface fire data to all of
Russia [Sannikov and Goldammer, 1996].
2. Some fuel loads are provided by Danilin [ 1995] for the northern taiga region in central Siberia. By applying the combustion efficiencies of the Bor experiment to these fuel
loads,
surface
fires
would
consume
around
19.1
t ha
-] (Table
4).
3. Raw data for fuel loads and fuel consumptions fbr the
fire-prone
Magadan
Region
(extreme
far east) are given by
o ... ,_:__ [,•,•,• •, .... a •: ... .• .... •. ... • .... range of
values
at regional
scale,
from
8.5
t ha
-] to 25.3
t ha
'].
Moreover, we have previously seen that in Canada, fuel
consumption
values
may
vary
in the
range
10 to 25 t ha
-]. In
Siberia we would expect more ground fuel accumulation, since the central Siberia climate is more continental [Bonan and Shugart, 1989]. The same applies for the western Siberia marshlands, which can burn during strong severe drought.
Table 4. Average Fuel Consumptions for Siberia in the Main Vegetation Layers Subjected to Surface
Fires or Crown Fires
Average Fuel Consumption, t ha 4
West Siberia, Bor Forest Island Experiment [FIRESCAN Science Team, 1996]
Northern Central Siberia
[Danilin, 1995] (1) Litter and surface cover
(2) Duff layer (3) Downed wood (4) Surface fires = ( 1 )+(2)+(3 ) (5) Crown fuels (6) Crown fires = (4)+(5) 13.9 10.5 8.1 32.5 4.6 37.1 8.2 6.0 4.9 19.1
26,880 LAVOU• ET AL.' CARBONACEOUS PARTICLES IN NORTHERN WILDFIRES
(a)
':i:i:i:i::. 30 25 15 lO 5 0 Jan Feb Mar AprMay Jun
Months
Jul
Aug
Sep
Oct
Nov
Dec64-72øN 56-64øN 48.56øN Latitude 40.48ON zones
(b)
25 2O 15 10Jan Feb Mar Apr Ma Jun Jul Aug Sep Oct Nov Dec
Months
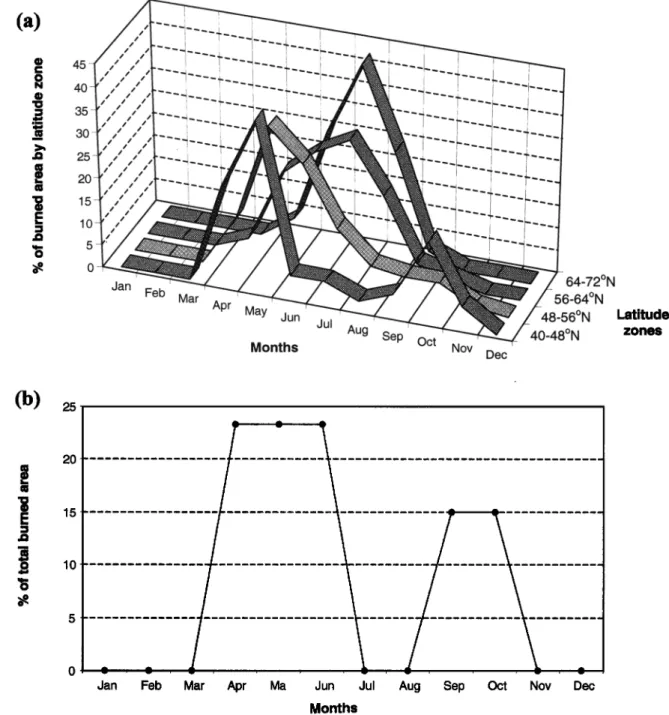
Figure 8. Temporal distribution of (a) Russian and •) Mongolian fires. A latitudinal variability may be
observed for Russian fires.
Because of a lack of experimental data and in light of these considerations, we assumed the fuel consumptions in the
Russian
forest
to vary
in the 15 to 30 t ha
4 range,
although
we
are aware of the important variability of the amount of
biomass consumed at regional scale. For Mongolia, we decided to take the Russian minimum value of 15 t ha -1 for the forests, which are mainly composed of forest steppe, and 10 t
ha
4 for the grasslands.
These values must be tested and revised in the future.
3.3.1. Assessment of the Russian emissions. Large Siberian forest fires can occur anywhere from spring to summer almost every year because of the highly continental climate [Stocks and Lynham, 1996]. A seasonal distribution of Russian fires in four zonal belts, shown in Figure 8a, is proposed by Korovin [ 1996]. It may be noticed that the fire
season shifts northward at the end of spring and southward at
the end of summer.
Fire monitoring in all of these very remote regions is very difficult and especially in northeastern Siberia, where numerous fires may occur [Stocks et al., 1996b]. Available data from published Russian burned area statistics are incomplete for our purpose, since they just reflect the state of
the Russian Forest Fund or the monitored forests, which both
are-part of Russian forested areas [FAO, 1992b, 1997; Korovin, 1996; Valendik, 1996]. In addition, they are not often reliable because of deliberate underestimation during the former Soviet Union period [Stocks, 1991]. Therefore assessment of total burned areas presented herewith contains numerous assumptions.
LAVOUI2
ET AL.' CARBONACEOUS
PARTICLES
IN NORTHERN
WILDFIRES
26,881
5OO 45O 4OO350
300200
150 IO0 1971-75 1976-80 1981-85 1986 1987 1988 1989 1990 1991 1992Monitored
and
unmonitored
areas
[Dixon
and
Krankina,
1993]
AVHRR
detection
[Cahoon
et al.,
1994,
1996-Cofer
et al.,
1996b'
Stocks
et al.,
1996b,
1996c]
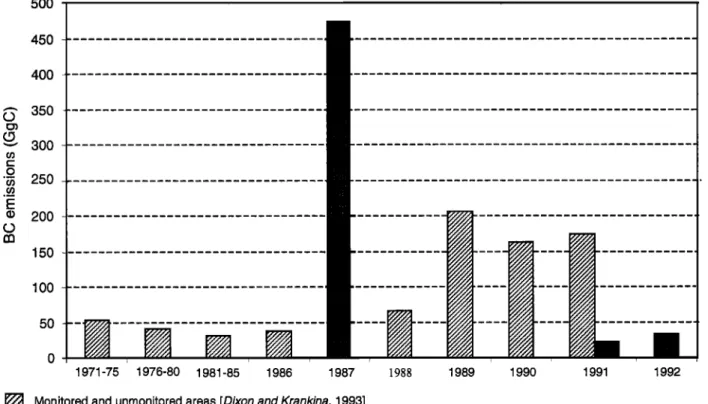
Figure 9. Estimation of black carbon emissions by Russian fires for the 1971-1992 period obtained by
considering
a fuel consumption
of 30 t ha
-•. Burned
areas
are given
from statistical
data
for 1971-1991.
Satellite data exist only for 1987, 1991, and 1992. give estimations of total burned areas for 1972-1991. They point out that the contribution of the three Siberian components represents 95% of the cumulative Russian burned area over the 1972-1988 period. With the results of the advanced very high resolution radiometer (AVHRR) imagery analysis, we improved this inventory for 1987 and 1991 and completed it with the 1992 year.
1. Instead of the 10 million hectares initially estimated by Dixon and Krankina [1993], the 1987 historical fire year consumed 21 million hectares in boreal Eurasia according to Cofer et al. [1996b] with 15 million hectares in Russia/ China/Mongolia, among which 1.1 million hectares were in the Chinese Heilong•ang province [Cahoon et al., 1991, 1994]. Other numerous large fires were located at the border
between west Siberia and east Siberia and in the far east
[Korovin, 1996].
2. Conversely, 1991 was a moderate fire year, with 8 millions hectares according to Dixon and Krankina [1993]. Stocks et al. [1996b, c] show that the large fires were essentially located in northeastern Siberia.
3. Finally, 1992 was a low fire year, with an area of only 1.5 million hectares shared between three main regions of Siberia [Cahoon et al., 1996; Stocks et al., 1996c].
The two fuel consumption
values
(15 t ha
-] and
30 t ha
-1)
were applied to the burned areas, allowing us to obtain the range of burned biomass and emission for each year. Figure 9 presents BC emissions from both inventories (Dixon and Krankina [1993] and AVHRR imagery) using a maximum
fuel load
value
of 30 t ha
-]. This figure
underlines
the great
fire interannual variability. The minimum and maximum calculated burned biomass values are 16 Gg C and 473 Gg C (in 1987), respectively.
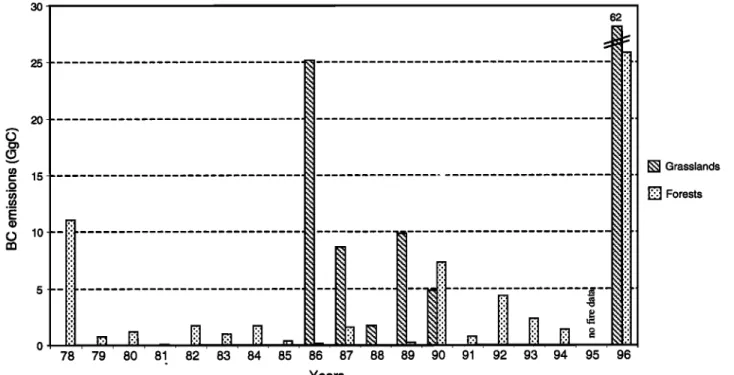
3.3.2. Mongolian fires. Fire data on Mongolian forest, forest steppe, and grasslands are better known than the Russian fires [FAO, 1996b, 1997]. Large fires are very common in Mongolia and may be detected by remote sensing. They occur especially in spring and are associated with very strong winds. The seasonality presented in Figure 8b shows
that fires are very unlikely in July and August owing to the
heavy summer rains. We estimated the emissions by fires in forests/forest steppes and grasslands (Figure 10). Grasslands form a sensitive ecosystem which may undergo extreme fire weather as in 1996 with 62 Gg C of BC emitted, 3 times the average value obtained for both Mongolian forests and grasslands over the whole period. Conversely, for some other years, fires are almost absent in the Mongolian territory (for example, 1981 and 1985).
3.4. Europe, North Africa, and Middle East
3.4.1. Divisions according to !and cover types. Europe was divided into four parts characterized by different ecological patterns: northern, western, central, and southern Europe. We considered North Africa and the Middle East as well. For the six regions, Table 5 presents the relative importance of forested and subforested areas compared with land areas. Around 50% of Scandinavia is covered by boreal forest, which is mainly composed of mixed and coniferous forests. On the other hand, the Mediterranean vegetation, made of forests with a major component of shrublands such as maquis or garrigue, covers only 25% of southern Europe and 9% of North Africa along the sea coast.
Furthermore Table 5 shows the average fuel consumptions
26,882 LAVOUI• ET AL.' CARBONACEOUS PARTICLES IN NORTHERN WILDFIRES 30 25 20 15 10 62 Grasslands Forests 78 79 80 81 82 83 84 85 86 87 88 89 90 91 92 93 94 95 96 Years
Figure 10. Annual
black
carbon
emissions
by forest
and
grassland
fires
in Mongolia
between
1978
and 1996.
fires in northern Europe from a fire ecology study in a Swedish forest [Schimmel and Granstroem, 1997]. For western and central Europe, Trabaud et al. [1993] provide a
fuel consumption
of 13 t ha
-• for litter
fuels,
since
only
this
vegetation
layer
is assumed
to .be
burned
by surface
fires.
A
much higher value of 22 t ha-' has been attributed to fire-
prone Mediterranean vegeta-tion of southern Europe. The
North
African
value
of 28 t ha
4 given
by Suman
[ 1996]
was
taken for the Middle East, assuming that both Mediterranean
vegetations behave the same way when subjected to fire.
Table 5. Fuel Consumptions for Northern, Central, Western, and Southern Europe, North Africa, and the Middle East, Taking Into Account the Relative Importance of Forest and Woodland Areas
Regions Countries Forest and Fuel
Woodland Consumptions,
Areas, % t ha 4
Burned Areas for 1960-1995
References
Northern Europe Finland, Norway, Sweden, Estonia, Lithuania
50 a 15 b Det Norske Skogselskap [ 1964], FAO [ 1990a, 1993a, 1995b, 1998a], Finnish Forest Research Institute [1998], Pyne [ 1997], Stocks and Barney [1981]
Central Europe Bulgaria, Hungary, Poland, Romania, former Czechoslovakia, former Yugoslavia
29 a 13 c FAO [ 1990a, c, 1993a, 1994]
Western Europe Austria, Belgium, France, Germany, Ireland, Luxembourg,
Netherlands, Swizerland, United Kingdom
29 a 13 c Revue Forestigre Francaisc [ 1974], FAO [ 1989,
1990a, c, 1992b, 1993a, 1995a, b, 1996a, b, 1998a], Gaudin [ 1980], La Recherche [ 1991 ], rrabaud [ 1980], Pyne [ 1997]
Southern Europe Albania, Croatia, Greece, Italy, Portugal, Spain North Africa Algeria, Libya, Morroco,
Tunisia
25 a 22 c
9 c 28 a
FAO [ 1989, 1990a, c, 1992a, b, 1993b, 1995a,
1996a, 1997], Gaudin [1980], Pyne [1997] FAO [ 1993a, 1995a], Suman [ 1996]
Middle East Cyprus, Israel, Turkey
FAO, Food and Agriculture Organization. a FAO [ 1999].
b Adapted
from
Schimmel
and
Granstroem
[1997].
c Trabaud et al. [1993]. d Suman [ 1996].
LAVOUI2 ET AL.: CARBONACEOUS PARTICLES IN NORTHERN WILDFIRES 26,883
(a)
4o[
30 0.• 2{3
S 75 76 77 78 79 80 81 82 83 84 85 86 87 88 89 90 91 92 93 94 95 Years(b) 14
Southern EuropeCentral
Europe
Western
Europe
12 (.) 10 • 8 0 ß • 6 E rf"l 4 63 64 65 66 67 68 69 70 71 72 73 74 75 76 77 78 79 80 81 82 83 84 85 86 87 88 89 90 91 92 93 94 95 YearsFigure 11. T., ... • .... ;.k;1;,.,
,.,r
k'•o,.t.
carbon
emissions
by fires
ta• in Europe
t•,r 1 o?q-loOq
(details
are
for southern, central, and western Europe) and (b) in the Middle East and North Africa for 1963-1995.
r• Middle East
• North Africa
However,
the difference
of 6 t ha
'• with southern
Europe
may
be explained
by a larger
shrubland
component
in North Africa
and the Middle East, which makes the vegetation more
inflammable.
3.4.2. Burned area and emission history. A history of
BC emissions since 1960 was determined for the six previous
regions.
Nevertheless,
burned
area data for Latvia, Belarus,
and Ukraine (three countries in central Europe) were not available. Their forested areas account for 11% of the
European forests and woodlands [FAO, 1999].
BC emissions from northern Europe which are not
presented in this study are very low. Despite its very wide
forested area, Sweden does not encounter important forest fire
problems, thanks to a successful fire suppression policy
[Stocks,
1991]. In Finland,
according
to Pyne [ 1997], the
wildfire contribution
appears
to be minor in comparison
with
that of controlled fires for the 1946-1969 period. And in
Norway, FAO [1998a] underlines
the presence
of natural
breaks (such as high mountains) between forested areas; Det
Norske Skogselskap
[1964] indicates
a majority of fires
smaller than 0.5 hectare.
As is shown
by Figure 1 la, southern
Europe
accounts
for
93% of the average
European
annual
BC emission,
even
if its
forest/subforest area is half the size of the Scandinavian one.
Indeed,
not only the fire-prone
Mediterranean
vegetation,
but
also the whole sensitive Mediterranean Basin is actually
subjected
to very strong
anthropogenic
pressure:
in some
of
26,884
(a)
6O
LAVOUI• ET AL.' CARBONACEOUS
PARTICLES
IN NORTHERN
WILDFIRES
(b)
5O 4O 3O 2O 10Jan Feb Mar Apr May Jun Jul Aug Sep Oct Nov Dec
Months
• Northern Europe
--!-- Western and Central Europe -' Southern Europe
301
25 2O 15 10Jan Feb Mar Apr May Jun Jul Aug Sep Oct Nov Dec
North Africa
Middle East
Months
Figure
12. Monthly
distribution
of burned
areas
(a) in Europe
(details
are
for northern,
western/central,
and
southern Europe) and (b) in the Middle East and North Africa.
summer
burned
areas
may reflect political instability
as in
Cyprus in 1974 [FAO, 1995a] or may show reaction of
population
against
political
decisions
such
as in Greece
[FAO,
1994].
Figure 1 l a also shows that emissions from western and
central
Europe
are relatively
unimportant.
They are unlikely
to be affected by very large surface fires since their areas
were deforested_on
a large scale
a long time ago. However,
regional differences may exist because of the existence of larger or fire-prone regional forest or woodland areas. For example, 85% of the western Europe fires are located in the French Mediterranean region. In addition, German fires were
usually more severe in East Germany than in West Germany [Pyne, 1997]. Finally, in Switzerland, 90% of fires are situated in the southern province of Tecino, which accounts for only 7% of the country's area [F,40, 1996b].
BC emissions for the Middle East and North Africa are
presented
in Figure 1 lb. The total average
is 3.7 Gg C. An
exceptional peak in 1983 reached 11.8 Gg C because of an
extreme fire season in Algeria.
3.4.3. Seasonality.
Monthly distribution
was applied
to
annual emissions for each region. Northern European fires occur in summer with a peak assumed to be in July [Layout, 1996] (Figure 12a). In western and central Europe, no fire
![Table 1. The 20 Land Cover Classes of the Biosphere-Atmosphere Transfer Scheme (BATS) [Dickinson et al., 1986]](https://thumb-eu.123doks.com/thumbv2/123doknet/13043067.382565/4.912.530.786.151.474/table-cover-classes-biosphere-atmosphere-transfer-scheme-dickinson.webp)