HAL Id: halshs-00963335
https://halshs.archives-ouvertes.fr/halshs-00963335
Preprint submitted on 21 Mar 2014
HAL is a multi-disciplinary open access archive for the deposit and dissemination of sci-entific research documents, whether they are pub-lished or not. The documents may come from teaching and research institutions in France or abroad, or from public or private research centers.
L’archive ouverte pluridisciplinaire HAL, est destinée au dépôt et à la diffusion de documents scientifiques de niveau recherche, publiés ou non, émanant des établissements d’enseignement et de recherche français ou étrangers, des laboratoires publics ou privés.
Indirect exporters
Fergal Mccann
To cite this version:
Indirect Exporters
Fergal McCann
Universit´e Paris 1, Paris School of Economics.
∗November 3, 2010
Abstract
Indirect Exporters are defined as firms exporting through a trade inter-mediary. Despite numerous recent appearances in theoretical work, empir-ical evidence comparing these firms to uniquely domestic firms and Direct Exporters does not exist. I show that in Eastern Europe these firms do, as predicted by the theoretical literature, lie between domestic firms and Direct Exporters for a range of performance measures. The “Direct Exporter pre-mium” is the more robust finding, while certain ambiguity surrounding the productivity gap between Indirect Exporters and Domestic firms indicates that these two groups may not be as significantly different.
JEL: F10, F14
∗Maison des Sciences Economiques, 106 boulevard de l’Hopital, 75647 Paris Cedex 13. [email protected]. I thank Anders Akerman, Agn`es B´enassy-Qu´er´e, Matthieu Crozet, Ron Davies, Benny Jung, Sebastian Krautheim, E´oin McGuirk and Farid Toubal for helpful comments. I acknowledge financial support from the EU Marie Curie RTN “Globalization, Investment and Services Trade” (GIST). I acknowledge the hospitality of the CEPII, where this paper was partly written. I am, of course, responsible for any remaining errors.
1
Introduction
The role played by intermediaries in international trade is a topic of growing inter-est. The literature has provided ample evidence, across countries of varying levels of economic development, that these firms account for a significant portion of trade flows.1
These studies have been accompanied by a range of papers modeling inter-national trade as involving more than uniquely exporting firms in one country and consumers in another.
This theoretical treatment of the role of trade intermediaries has usually
in-volved either network or matching frameworks2
or extensions of the model of Melitz (2003).3
In Blum et al. (2009), the largest firms choose a direct distribution tech-nology to reach foreign consumers themselves. Less productive firms choose an intermediation technology by pairing up with large trading firms to export indi-rectly. In Ahn et al. (2010) the fixed cost of selling to an intermediary in the firm’s own country is lower than the fixed cost of exporting directly. This leads to an iden-tical sorting to that in Blum et al. (2009) where the most productive firms export directly, less productive firms export through intermediaries, and the least produc-tive acproduc-tive firms sell on the domestic market only (termed here “Domestic firms”). Akerman (2010) models wholesalers as having an advantage through economies of scope, i.e. they smooth the fixed cost of selling abroad across many products. He then shows that wholesalers will export a lower volume but more products, and predicts that the sorting mentioned above will hold. Felbermayer and Jung (2009) present a slightly different set-up, focusing on the hold-up problem. They also predict the same sorting pattern as the above three papers.
To the best of my knowledge, empirical evidence on the productivity sorting
present in the above-mentioned models does not exist.4
In each paper mentioned
1
Ahn et al. (2010) find that intermediaries account for 20 percent of Chinese exports in 2005. Blum et al. (2010) report that around 35 percent of imports into Chile from Argentina are mediated through wholesalers, with 6 percent through retailers. Akerman (2010) shows that in Sweden in 2005, roughly half of firms exporting goods were wholesalers, while these wholesalers accounted for 15 percent of export volume. Bernard et al. (2010) show that in Italy, 27 per cent of manufacturing exporters are wholesalers, accounting for 11 percent of export volume in 2003. Felbermayr and Jung (2009) show at industry level for the US that the ratio of exports to intermediaries over exports to foreign affiliates is almost always larger than one, and often by orders of magnitude. Bernard, Jensen et al. (2010) show that in the US, “mixed wholesaler-retailers”, i.e. firms with more than 75 percent of output in those categories, account for two thirds of US exports in 2002.
2
See Antr`as and Costinot (2010), Blum et al. (2009), who use a Melitz setting, Petropoulou (2007) or Rauch and Watson (2004).
3
See Abel-Koch (2010), Ahn et al. (2010), Akerman (2010) or Felbermayr and Jung (2009). 4
Abel-Koch (2010) is the most closely related study to the current paper. She shows that firm size negatively predicts the share of indirect exports in total sales, suggesting that as fims get larger they are more likely to export directly.
above, the empirical analysis focuses on issues relating to the intermediaries them-selves, rather than to the indirectly exporting firms. The aim of this paper is to inform this growing literature on the validity of the productivity sorting results generated by each model. Due to a lack of panel data, I cannot ascertain cleanly whether the productivity sorting is due to selection into export modes or learning from exporting. The purpose of this study is rather to inform the literature on the relative performance of these three types of firms.
We see from probit analysis that Indirect Exporters are more likely than Do-mestic firms to import, to be foreign owned, to license foreign technology, to be multi-product firms, and to engage in R&D. We also see that Direct Exporters are more likely to engage in most of the above than Indirect Exporters. This suggests support for the performance hierarchy mentioned above. On productivity, the re-sults presented here again suggest that it is valid to assume that Direct Exporters are more productive than both Indirect Exporters and Domestic firms. On the other hand, the assumption that Indirect Exporters are more productive than Domestic firms receives weaker support. In terms of sales and domestic sales, these firms exporting through intermediaries are indeed shown to perform more strongly than purely domestic firms. Using logged output per worker as a measure of produc-tivity, however, the hypothesis that Indirect Exporters are more productive than Domestic firms is shown to not hold. Using a broader definition of Indirect Ex-porter, however, the productivity hierarchy presented by the theoretical literature is shown to hold perfectly as predicted.
The overall message of the paper is that, while there is a certain ambiguity on the advantage of Indirect Exporters, the overwhelming evidence is in support of the hierarchy predicted by the emerging theoretical literature.
The paper proceeds with a description of the data (Section 2), empirical analysis (Section 3) and a conclusion (Section 4).
2
Data
The data used come from the Business Environment and Enterprise Performance Survey (BEEPS), which is collected by The European Bank for Reconstruction and Development (EBRD) and The World Bank. This database collects information on, inter alia, a firm’s sales, exports, imports, outsourcing, employment, wages, ownership, investment and opinions on corruption and institutional quality. Data are collected for most countries in Eastern Europe for 2002, 2005, 2007, 2008 and 2009. The authors (EBRD and World Bank, 2010) state that “the survey universe
was defined as commercial, service or industrial business establishments with at least five full-time employees”. The statistical sampling technique used is stratified random sampling. The three levels of stratification used were industry, establish-ment size and region. Table 1 of the latest report (EBRD and World Bank, 2010) shows that for the total country sample, over 98 percent of the target number of interviews were achieved.
Figures for nominal monetary variables are given in local currency units. I normalize these variables by converting them to US dollar figures using the mean yearly exchange rate from the IMF International Financial Statistics database. The data show that full country coverage was only carried out in 2002, 2005 and 2009. There are just under 30,000 observations in the data altogether, with wider coverage for large countries such as Russia, Turkey and Poland.
3
Empirical evidence on characteristics of
Indi-rect Exporters
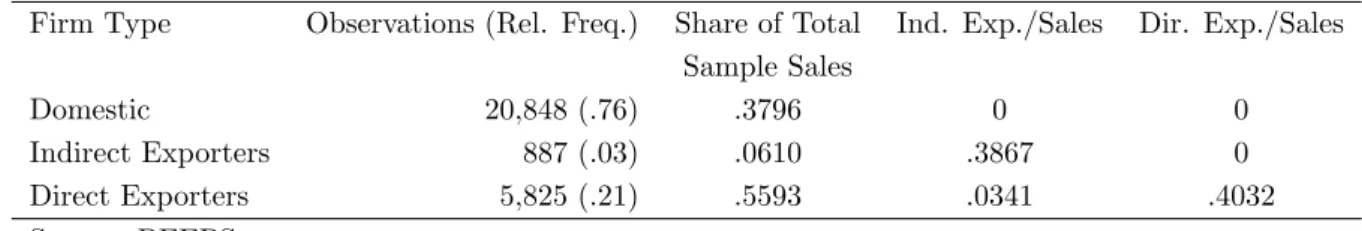
The aim of this paper is to give a first portrait of Indirect Exporters (IE hereon). Firms in the BEEPS are asked “what percentage of establishment’s sales were in-direct exports (sold domestically to a third party that exports products)”, as well as “what percentage of sales were direct exports”. For the purposes of the current paper, a firm is Domestic (D hereon) if it has 100 percent of its sales in the domestic market, an IE if some of its sales are in the form of indirect exports but none are direct exports, and a Direct Exporter (DE hereon) if it has some sales in the form of direct exports. Table 1 presents the occurrence of each of these three types of firm. Among the DE are 943 firms that have some direct and some indirect exports. I code these as DE due to the fact that, in the world of Melitz-type models, a firm ex-porting though both modes must have overcome the higher fixed costs of exex-porting directly. We see that the majority of firms are domestic firms, as would be expected given previous evidence.5
Among exporting firms, the majority of these are DE, with only 3 percent of firms exporting through a trade intermediary. This suggests that the intermediate productivity range in which IE lie in the theoretical literature is a small one in reality. Looking at these firms’ share in total sales, we see that IE are twice as important as their frequency would suggest, and unsurprisingly, DE account for a much larger share of sales than their frequency would suggest. We also see that, for both IE and DE, indirect and direct exports, respectively, account for
5
Bernard et al. (2007) show that in the US 18 percent of manufacturing firms engaged in exporting in 2002.
roughly 40 percent of total sales, while DE sell on average 3 percent of their total sales through indirect exports. This indicates that once firms have overcome the costs of exporting directly, indirect exports form a negligible part of their activity. Table 1: Observations, Relative Frequency, Group Share in Total Sample Sales, Share of Export Types in Firms’ Sales
Firm Type Observations (Rel. Freq.) Share of Total Ind. Exp./Sales Dir. Exp./Sales
Sample Sales
Domestic 20,848 (.76) .3796 0 0
Indirect Exporters 887 (.03) .0610 .3867 0
Direct Exporters 5,825 (.21) .5593 .0341 .4032
Source: BEEPS
If we relax our definition of IE, we see that firms engaging in indirect exports are more important than as appears in Table 1. If we define IE as any firm engaging in indirect exports (even if they also export directly), and DE as firms that only export directly, we see that 7% of firms are IE and 18% are DE. Changing this definition, however, only alters the sales shares of the two groups by one percent each. If we remove the firms that export both directly and through a wholesaler and include only “pure” IE and DE, we again see that frequencies and sales shares change very little.
3.1
Distributions of Exporters
I now present Kernel density plots of firm performance measures for my three cat-egories of exporter. In Figure 1 we see that IE lie clearly between D and DE for logged total sales. As a more accurate proxy for firm productivity, I use logged output per worker. The Kernel density plots for logged output per worker in Figure 2 show that, in the lower part of the distribution, the sorting pattern predicted by the theoretical literature holds. The lower productivity of domestic firms relative to both types of exporter is confirmed at all points in the distribution. As we move up to larger values of logged output per worker, however, we see that there are some points at which the distributions of IE and DE touch, and even cross. The broad pattern, however, is still one in keeping with the predictions of the theoretical literature. Table 4 in the Appendix reports Kolmogorov-Smirnov tests for equality of distributions. We see from this table that the distributions for both IE and DE lie significantly to the right of those for the rest of the sample, and that the distri-bution for DE lies to the right of that for IE. This offers continued support for the performance hierarchy set out throughout the paper.
Figure 1: Kernel densities of logged total sales
3.2
Simple Regression Analysis
In this section I engage in simple regression analysis to estimate the “performance premia” for each exporter type. Table 2 gives a more in-depth picture of the char-acteristics of the different type of exporters. I run five probit regressions which give the probability for IE and DE relative to D firms of participating in the following: importing, having a foreign owner, licensing of foreign technology, Research and Development (R&D) and multi-product sales. Formally I run
P r(Yit = 1) = IndirectExpit+ DirectExpit+ δc+ δt+ δs (1)
where Y = 1 if a firm engages in each of the five variables mentioned above and
0 otherwise, IndirectExpit is a dummy for IE, DirectExpit is a dummy for DE,
and the other controls are country, time and sector dummies. I then run four OLS regressions of the form
Xit = IndirectExpit+ DirectExpit+ δc+ δt+ δs (2)
where Xit will be logged sales, logged domestic sales, logged output per worker and
employment. From the probit regressions in Table 2 we see that IE and DE are more likely to be engaged in all the activities mentioned above than domestic firms. This confirms the theoretical literature’s prediction that domestic firms sit at the bottom of a performance hierarchy. These probit regressions also give credence to the predictions of the theoretical literature on the relation between IE and DE. For importing, being foreign owned and engaging in R&D, the likelihood of partic-ipation is statistically significantly higher for DE than IE. For licensing of foreign technology and for being a multi-product firm, the marginal effect is larger for IE, but the chi-squared test cannot reject equality of coefficients between the two types of exporter. Using OLS regressions, Table 2 tells us again that for sales, local sales and employment (l), the hierarchy predicted by the theoretical literature holds in its entirety, with the regression coefficients showing that DE and IE lie both sig-nificantly above D firms, and the F test showing that the difference in coefficients, with DE being greater than IE, is statistically significant. For logged output per worker, we find that DE are statistically significantly more productive than both IE and D firms, but the data do not give a significant difference in logged output per worker between IE and D firms.
Table 2 gives the strong overall impression of a performance hierarchy of firms: DE are the most productive firms, followed by IE, followed by D firms. These re-sults suggest that the theoretical result of an intermediate productivity for those exporting through a trade intermediary seems an accurate approximation, although
the “Indirect Exporter premium” is less robust, as evidenced by column (9). The extremely robust nature of the “Direct Exporter premium” suggests that trade intermediaries do indeed lower entry costs to exporting, so that only the top per-forming firms enter as DE. On the other hand, the less robust nature of the “Indirect Exporter premium” may suggest that intermediaries lower entry costs to such an extent that entry costs for IE are not statistically different to those to domestic production.
We now relax our definition of IE, to allow all firms that export indirectly, regardless of whether they also export directly, to be considered IE, and restrict our definition of DE to firms that only export directly. In Table 3, the regressions of Table 2 are replicated with this new definition of IE and DE. In probit regressions, DE are still more likely to be foreign-owned than IE, who have a higher likelihood than D firms. For R&D and importing, we no longer see a significant difference between IE and DE. IE are now more likely to be multi-product firms than DE. The OLS regressions return the same results as before: for logged sales, logged local sales and employment (l), the expected hierarchy holds. The key difference between Table 3 and Table 2 lies in Column (9), where the coefficient on logged output per worker now tells us that IE, when defined in this more broad way, are indeed more productive than D firms, although only at the five percent level of significance. When moving from the narrow definition of IE, we do indeed see that the hierarchy proposed by the current theoretical literature holds in the data even for our best proxy for productivity. The weaker statistical significance again suggests that the “Indirect Exporter premium” is the least robust of the relationships in the hierarchy. From Tables 2 and 3, the overwhelming picture is one in which firms exporting directly are more productive than firms exporting through a trade intermediary, who are in turn more productive than firms serving only the domestic market. The less robust nature of the latter relationship indicates that a certain caution should be exerted when assuming such a productivity hierarchy, but that on the whole the sorting of firms predicted by the new theoretical literature on intermediated trade is largely valid.
As a final robustness check, I address the worry that intermediary firms them-selves may be driving some of the results. A reader may worry that wholesaling firms are more likely to be DE and thus bias results. The data show that the dis-tribution of D, IE and DE firms in the wholesaling industry (NACE2 51) is similar to that shown across the dataset. I run all regressions and re-plot all densities documented above, and see that absolutely all results are robust to the exclusion of firms categorized in NACE2 industry 51.
Table 2: Portrait of exporter types, Base Category is Domestic firms
(1) (2) (3) (4) (5) (6) (7) (8) (9)
Probit Probit Probit Probit Probit OLS OLS OLS OLS
Importer Foreign For. Tech Multi Prod. R&D l ln(Sales) ln(Dom Sales) Lab. Prod.
Indirect Exporter 0.264*** 0.116*** 0.043*** 0.103*** 0.159*** .774*** .781*** .366*** .032
(16.01) (7.12) (4.22) ( 4.92) (7.04) (14.85) (10.07) (4.37) (0.58)
Direct Exporter 0.307*** 0.187*** 0.038*** 0.081*** 0.204*** 1.168*** 1.437*** .724*** .290***
(37.19) (25.92) (8.48) (8.35) (19.61) (49.08) (39.19) (18.76) (11.04)
N 18715 26036 13937 20544 17338 26403 21015 20486 20977
Chi-Sq (probit) or F-test (OLS) for equality of coefficients between IE and DE
Chi-Sq or F 5.59 16.01 0.16 0.87 3.37 52.95 67.33 17.04 20.28
p-value 0.018** 0.000*** 0.689 0.351 0.066* 0.000*** 0.000*** 0.000*** 0.001***
t statistics in parentheses
∗p < 0.05, ∗ ∗ p < 0.01, ∗ ∗ ∗p < 0.001
Year, Country, Sector dummies included in all regressions marginal effects reported for probit regressions
Table 3: Portrait of exporter types, Base Category is Domestic firms. Indirect Exporters defined more broadly.
(1) (2) (3) (4) (5) (6) (7) (8) (9)
Probit Probit Probit Probit Probit OLS OLS OLS OLS
Importer Foreign For. Tech Multi Prod. R&D l ln(Sales) ln(Dom Sales) Lab. Prod.
Indirect Exporter 0.309*** 0.136*** 0.046*** 0.140*** 0.198*** 1.012*** 1.082*** 0.437*** 0.105*
(27.21) (11.10) (5.98) (9.06) (12.03) (26.31) (18.74) (7.13) (2.54)
Direct Exporter 0.293*** 0.198*** 0.038*** 0.064*** 0.202*** 1.152*** 1.442*** 0.761*** 0.308***
(34.07) (25.25) (7.82) (6.19) (18.03) (45.87) (37.40) (18.72) (11.16)
Chi-Sq (probit) or F-test (OLS) for equality of coefficients between IE and DE
Chi-Sq or F 1.39 18.23 .66 16.81 .03 11.21 33.92 24.10 21.02
p-value 0.2389 0.000*** 0.4168 0.000*** 0.8611 0.000*** 0.000*** 0.000*** 0.000***
t statistics in parentheses
∗p < 0.05, ∗ ∗ p < 0.01, ∗ ∗ ∗p < 0.001
Year, Country, Sector dummies included in all regressions marginal effects reported for probit regressions
4
Conclusion
I have presented first evidence on the performance of Indirect Exporters. In con-cordance with the predictions of recent theoretical models, Indirect Exporters are found to lie between Domestic firms and Direct Exporters for a number of firm per-formance measures. The premium of Direct Exporters is unambiguous throughout the paper, whereas that of Indirect Exporters over Domestic firms is supported, but slightly less robust. This suggests, first of all, that intermediaries do certainly lower the fixed cost of exporting, as purported in the literature. Secondly, the fixed cost reductions made possible by trade intermediaries may be hugely economically significant, with the potential that they leave Indirect Exporters and firms serving only the domestic market not significantly differing. These findings can help mo-tivate and validate current and future research regarding the role of intermediaries in mediating international trade.
References
[1] Jennifer Abel-Koch. Firm size and the choice of export mode. Mimeo, Univer-sity of Mannheim Centre for Doctoral Studies in Economics, 2010.
[2] JaeBin Ahn, Amit K. Khandelwal, and Shang-Jin Wei. The role of intermedi-aries in facilitating trade. NBER Working Papers 15706, National Bureau of Economic Research, Inc, January 2010.
[3] Anders Akerman. A theory on the role of wholesalers in international trade based on economies of scope. Research Papers in Economics 2010:1, Stockholm University, Department of Economics, January 2010.
[4] Pol Antr`as and Arnaud Costinot. Intermediated trade. NBER Working Papers 15750, National Bureau of Economic Research, Inc, February 2010.
[5] Andrew B. Bernard, Marco Grazzi, and Chiara Tomasi. Intermediaries in international trade: Direct versus indirect modes of export. Working Paper Research 199, National Bank of Belgium, October 2010.
[6] Andrew B. Bernard, J. Bradford Jensen, Stephen J. Redding, and Peter K. Schott. Wholesalers and retailers in US trade. American Economic Review, 100(2):408–13, May 2010.
[7] Bernardo S. Blum, Sebastian Claro, and Ignatius Horstmann. Intermediation and the nature of trade costs: theory and evidence. Mimeo, University of Toronto, January 2009.
[8] Bernardo S. Blum, Sebastian Claro, and Ignatius Horstmann. Facts and figures on intermediated trade. American Economic Review, 100(2):419–23, 2010. [9] EBRD and World Bank. The Business Environment and Enterprise
Perfor-mance Survey (BEEPS) 2008-2009: A Report on methodology and observa-tions. European Bank for Reconstruction and Development and World Bank, 2010.
[10] Gabriel J. Felbermayr and Benjamin Jung. Trade intermediation and the orga-nization of exporters. Discussion Papers 309/2009, Department of Economics, University of Hohenheim, Germany, April 2009.
[11] Marc J. Melitz. The impact of trade on intra-industry reallocations and aggre-gate industry productivity. Econometrica, 71(6):1695–1725, November 2003. [12] Dimitra Petropoulou. Information costs, networks and intermediation in
inter-national trade. Economics Series Working Papers 370, University of Oxford, Department of Economics, November 2007.
[13] James E. Rauch and Joel Watson. Network intermediaries in international trade. Journal of Economics & Management Strategy, 13(1):69–93, 03 2004.
A
Appendix
Table 4: Kolmogorov-Smirnov tests for equality of distributions
Tests for logged sales Tests for logged sales per worker
Difference P-value Difference P-value
Indirect Exporter vs Domestic .2576 0.000 .1511 0.000
Direct Exporter vs Domestic .3799 0.000 .2072 0.000