HAL Id: hal-02929520
https://hal.archives-ouvertes.fr/hal-02929520
Submitted on 16 Sep 2020
HAL is a multi-disciplinary open access
archive for the deposit and dissemination of
sci-entific research documents, whether they are
pub-lished or not. The documents may come from
teaching and research institutions in France or
abroad, or from public or private research centers.
L’archive ouverte pluridisciplinaire HAL, est
destinée au dépôt et à la diffusion de documents
scientifiques de niveau recherche, publiés ou non,
émanant des établissements d’enseignement et de
recherche français ou étrangers, des laboratoires
publics ou privés.
Global evapotranspiration over the past three decades:
estimation based on the water balance equation
combined with empirical models
Zhenzhong Zeng, Shilong Piao, Xin Lin, Guodong Yin, Shushi Peng, Philippe
Ciais, Ranga Myneni
To cite this version:
Zhenzhong Zeng, Shilong Piao, Xin Lin, Guodong Yin, Shushi Peng, et al.. Global evapotranspiration
over the past three decades: estimation based on the water balance equation combined with empirical
models. Environmental Research Letters, IOP Publishing, 2012, 7 (1), pp.014026.
�10.1088/1748-9326/7/1/014026�. �hal-02929520�
Environmental Research Letters
LETTER
Global evapotranspiration over the past three
decades: estimation based on the water balance
equation combined with empirical models
To cite this article: Zhenzhong Zeng et al 2012 Environ. Res. Lett. 7 014026
View the article online for updates and enhancements.
Related content
Spatiotemporal patterns of
evapotranspiration in response to multiple environmental factors simulated by the Community Land Model
Xiaoying Shi, Jiafu Mao, Peter E Thornton et al.
-Recent change of vegetation growth trend in China
Shushi Peng, Anping Chen, Liang Xu et al.
-Spatio-temporal dynamics of
evapotranspiration on the Tibetan Plateau from 2000 to 2010
Lulu Song, Qianlai Zhuang, Yunhe Yin et al.
-Recent citations
A daily 0.25°×0.25° hydrologically based land surface flux dataset for conterminous China, 1961-2017
Yue Miao and Aihui Wang
-Long-Term Land Surface Evaporation and Its Changes Estimated by the Generalized Complementary Principle in China
曲 and
-Analysis on impacts of hydro-climatic changes and human activities on available water changes in Central Asia
Hui Chen et al
IOP PUBLISHING ENVIRONMENTALRESEARCHLETTERS
Environ. Res. Lett. 7 (2012) 014026 (8pp) doi:10.1088/1748-9326/7/1/014026
Global evapotranspiration over the past
three decades: estimation based on the
water balance equation combined with
empirical models
Zhenzhong Zeng
1, Shilong Piao
1,2,7, Xin Lin
3,4, Guodong Yin
1,
Shushi Peng
1, Philippe Ciais
5and Ranga B Myneni
61Sino-French Institute for Earth System Science, Department of Ecology, College of Urban and
Environmental Sciences, Peking University, Beijing 100871, People’s Republic of China
2Institute of Tibetan Plateau Research, Chinese Academy of Sciences, Beijing 100085,
People’s Republic of China
3State Key Laboratory of Environmental Criteria and Risk Assessment, Chinese Research Academy of
Environmental Sciences, Beijing 100012, People’s Republic of China
4College of Water Sciences, Beijing Normal University, Beijing 100875, People’s Republic of China 5Laboratoire des Sciences du Climat et de l’Environnement, CEA CNRS UVSQ, 91191 Gif sur Yvette,
France
6Department of Geography and Environment, Boston University, 675 Commonwealth Avenue, Boston,
MA 02215, USA
E-mail:slpiao@pku.edu.cn Received 5 December 2011
Accepted for publication 2 February 2012 Published 22 February 2012
Online atstacks.iop.org/ERL/7/014026
Abstract
We applied a land water mass balance equation over 59 major river basins during 2003–9 to estimate evapotranspiration (ET), using as input terrestrial water storage anomaly (TWSA) data from the GRACE satellites, precipitation and in situ runoff measurements. We found that the terrestrial water storage change cannot be neglected in the estimation of ET on an annual time step, especially in areas with relatively low ET values. We developed a spatial regression model of ET by integrating precipitation, temperature and satellite-derived normalized difference vegetation index (NDVI) data, and used this model to extrapolate the spatio-temporal patterns of changes in ET from 1982 to 2009. We found that the globally averaged land ET is about 604 mm yr−1with a range of 558–650 mm yr−1. From 1982 to 2009, global land ET was found to increase at a rate of 1.10 mm yr−2, with the Amazon regions and Southeast Asia showing the highest ET increasing trend. Further analyses, however, show that the increase in global land ET mainly occurred between the 1980s and the 1990s. The trend over the 2000s, its magnitude or even the sign of change substantially depended on the choice of the beginning year. This suggests a non-significant trend in global land ET over the last decade.
Keywords: evapotranspiration, normalized difference vegetation index (NDVI), gravity recovery and climate experiment (GRACE) satellites, terrestrial water storage anomaly (TWSA)
S Online supplementary data available fromstacks.iop.org/ERL/7/014026/mmedia
7 Address for correspondence: Peking University, Beijing 100871, People’s Republic of China.
1
Environ. Res. Lett. 7 (2012) 014026 Z Zeng et al
1. Introduction
Evapotranspiration (ET) links the water, energy and carbon cycles and is one of the most important fluxes in Earth’s climate system (Nachabe et al2005, Alton et al2009). It has been estimated that more than 60% of precipitation on the land surface returns to the atmosphere in the form of ET (Oki and Kanae2006) while consuming more than half of the solar radiation absorbed by the land surface (Trenberth et al2009). ET is also a robust climatic predictor of plant productivity and species richness (Fisher et al2011). Accurate estimates of spatial and temporal changes in global ET are critical for better understanding atmosphere–hydrosphere–biosphere interactions, and therefore is an important emergent theme of climate change research (Jung et al2010, Fisher et al2011).
It is difficult to directly measure ET at large spatial scales continuously over long time periods. Therefore, empirical data-driven approaches are valuable for estimation of global land ET. In theory, ET can be expressed as the residual between total precipitation (P) minus the sum of net runoff (R) and terrestrial water storage change (TWSC), i.e. ET = P − R −TWSC (Verstraeten et al2008). TWSC shows the changes in terrestrial water storage (TWS), a horizontally and vertically integrated quantity which is defined as storage of all forms of terrestrial water including groundwater, soil moisture, surface water, canopy water, snow and glaciers (Rodell and Famiglietti1999, Rodell et al 2004, 2009). At large scales, however, TWSC is difficult to estimate (Tapley et al2004), and was generally neglected in previous studies (e.g. Mueller et al 2011). The availability recently of terrestrial water storage anomalies (TWSAs) datasets from gravity recovery and climate experiment (GRACE) satellites, however, provides an opportunity to re-assess the value of considering TWSC for ET estimation at large spatial scales. The first objective of this letter is to evaluate the systematic error, if any, in land ET estimation when TWSC is ignored.
Jung et al (2010) (hereafter JUN10) and Zhang et al (2010) (hereafter ZHA10) quantified ET by up-scaling local eddy-covariance flux measurements from the global FLUXNET network, through integration with gridded satellite FAPAR (or NDVI) and climate data. Based on a multi-regression tree ensemble, JUN10 estimated ET from 1982 to 2008, and concluded that global land ET trend has stalled, and declined in some tropical regions, during the past decade. One limitation acknowledged by JUN10 is the limited coverage of FLUXNET sites and relatively short duration of flux records, especially in the tropics, which makes ET estimates uncertain (Mueller et al2011). Therefore, the second objective of this paper is to evaluate large-scale changes in global ET over the last three decades with an alternative method.
2. Data and methods
2.1. DataThe data from GRACE satellites, launched in March 2002 to accurately measure the Earth’s gravity field at ∼30 day
intervals with a spatial resolution of 400 km, can be used to estimate TWSAs over sufficiently large regions (Tapley et al
2004). TWSA is an anomaly (i.e. monthly deviations from a longer-term mean) of TWS stored above and underneath the surface of the Earth, including groundwater, soil moisture, surface water, canopy water, snow and glaciers (Syed et al
2008). The TWSA data used in this study were obtained from the Jet Propulsion Laboratory (JPL;http://grace.jpl.nasa.gov) (Swenson and Wahr 2006) and were used to derive annual terrestrial water storage change (TWSC).
Since the spatial resolution of the GRACE TWSA product is 1◦ × 1◦ (http://grace.jpl.nasa.gov), we did not include river basins smaller than 10 000 km2, resulting in 59 river basins, which cover more than 50% of the global land surface (figure1(a)). The digital map of these 59 major river basins was obtained from the Global Runoff Data Centre (GRDC 2007). The runoff data during the period of 2003–9 as well as the areas of the watersheds corresponding to runoff stations were derived from the GRDC database (GRDC
2007) and from the Ministry of Water Resources, China. ET is not only driven by climatic factors, but also modulated by physiological and structural characteristics of vegetation (Piao et al2007). We used the satellite data-based normalized difference vegetation index (NDVI), a proxy for terrestrial vegetation greenness and photosynthetic activity (Myneni et al 1998, Wang et al 2011), as one of the independent variables (predictors) for estimating global ET. The NOAA/AVHRR NDVI data used here were generated by the Global Inventory Modeling and Mapping Studies (GIMMS) group at NASA GSFC at a spatial resolution of 8 km for the period 1982–2009 (Tucker et al 2005). Annual mean surface air temperature and annual precipitation global fields during 1982–2009 at a spatial resolution of 0.5◦ × 0.5◦were obtained from the Climatic Research Unit
(CRU) TS 3.1 datasets (Mitchell and Jones2005).
2.2. Methods
For a given river basin, we assumed that surface drainage divides coincide with groundwater flow divides, so that lateral inputs and outputs of groundwater can be ignored (Rodell et al2004). Therefore the water balance equation for the land surface can be expressed as:
ET(n) = P(n) − Q(n) − (TWSA(12,n)−TWSA(12,n−1)) (1) where n is the year; TWSA(12,n−1)is the basin-level average TWSA for December of the year n (mm); ET, P and Q are annual ET (mm yr−1), precipitation (mm yr−1) and runoff (mm yr−1), respectively. Since the temporal resolution of GRACE TWSA is 1 month, we used December TWSA of the year n and n − 1 to represent TWSA at the end and beginning of the year n, respectively. Note that ET refers to actual evapotranspiration rather than potential evapotranspiration throughout this letter.
ET is affected by a number of factors, such as available energy, available water, vapor pressure deficit, wind speed and vegetation activity (Verstraeten et al 2008). Given the
Environ. Res. Lett. 7 (2012) 014026 Z Zeng et al
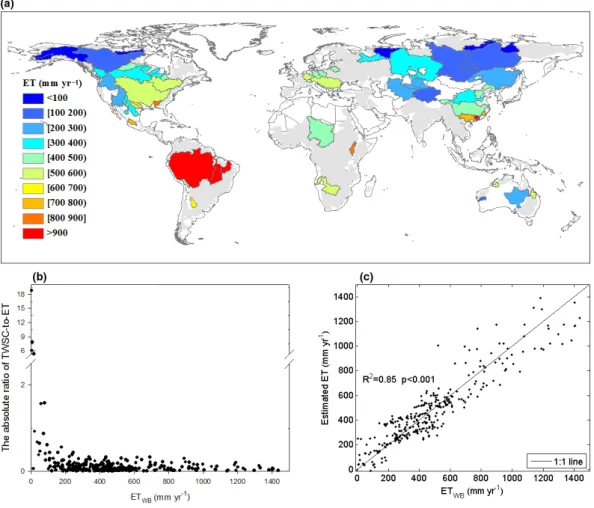
Figure 1. Spatial distribution of land ET at the basin level calculated by the water balance approach (ETWB, equation (1)), contribution of
terrestrial water storage change (TWSC) to ETWBand validation of ET estimated by the regression approach (equation (2)) against ETWB.
(a) Spatial pattern of mean annual ETWBover 59 major river basins during 2003–9; (b) relationship between ETWBand absolute ratio of
TWSC-to-ET; (c) comparison of ET estimated by the regression approach (estimated ET, equation (2)) and ET calculated by the water balance approach (ETWB, equation (1)) over the 59 major river basins during 2003–9, where each dot represents ET of one river basin year.
multi-collinearity of different factors and availability of global datasets during the study period, we chose available energy, available water and vegetation activity as the main drivers of spatio-temporal variations of ET. We find that over 299 basin years, ET is significantly and positively correlated with mean annual temperature (a proxy of available energy; R = 0.68, p < 0.001), annual precipitation (a proxy of available water; R = 0.87, p < 0.001) and annual NDVI (a proxy of vegetation condition; R = 0.70, p < 0.001). We performed multiple linear, spatial (cross-basin) regression analyses using annual ET as the dependent variable and mean annual temperature, annual precipitation and annual NDVI as independent variables. We also performed the multiple regression analysis 1000 times by randomly selecting a subset of 80% of samples from the datasets in order to further analyze the uncertainty of global ET. Annual NDVI is calculated as the sum of monthly NDVI that is larger than 0.1. Because the maximum NDVI value composite (MVC) (a maximum daily NDVI value in each 15 days) minimizes atmospheric effects, scan angle effects, cloud contamination and solar zenith angle effects (Holben1986), we used the largest 15 day MVC for each month to produce the monthly NDVI dataset.
3. Results and discussion
3.1. Estimation of ET at the basin level
Figure 1(a) shows spatial patterns of average ET during 2003–9 across the 59 river basins. Among the basins, ET shows pronounced regional contrasts, reflecting the spatial patterns of climatic conditions and vegetation coverage and structure. High ET (>900 mm yr−1) is observed in the Amazon, while low ET (<200 mm yr−1) is found in the basins of high-latitude in the northern hemisphere and in Central Asia, as may be expected. In the Pechora basin of northern Russia, the water balance defined in equation (1) predicts a negative value of ET, but close to 0 mm yr−1(−9 mm yr−1), which may be likely due to uncertainties in precipitation from the limited number of climatic stations, as well as inaccurate estimation of TWSC. The spatio-temporal change of ET over 299 river basin years is significantly and positively correlated with annual precipitation, mean annual temperature and annual NDVI. Therefore, these three variables were used to calculate ET using the following multi-linear regression,
Environ. Res. Lett. 7 (2012) 014026 Z Zeng et al
Figure 2. Spatial patterns of (a) mean annual land ET during 1982–2009 and (b) mean latitude ET estimated by three different methods. The shaded area is the range of one standard deviation of latitude ET estimated in this study.
ET = 0.41(±0.02)P + 10.62(±0.39)T
+9.63(±2.27)NDVI + 31.58(±7.89), (2) where ET is basin-averaged annual evapotranspiration (mm yr−1), P, T and NDVI are annual precipitation (mm yr−1), mean annual temperature (◦C) and annual NDVI, respectively. The uncertainty of each parameter was derived from 1000 multiple regression analyses, by randomly selecting 80% of samples from the datasets. As shown in figure S1 (available atstacks.iop.org/ERL/7/014026/ mmedia), the regression based on 80% of samples of the datasets also successfully predicts the other 20% of the data.
This regression explains more than 85% of the spatio-temporal differences in ET across the 299 river basin years. Although it has been suggested that wind speed may influence ET (Skidmore et al1969), including wind speed as a predictor in equation (2) did not significantly improve the explanation of spatial differences in ET across the river basins (p> 0.05), suggesting that the effect of wind speed is small on an annual average basis.
Figure 1(b) shows the change in the absolute ratio of TWSC-to-ET (i.e. the relative error derived from ignoring TWSC in ET estimates) versus ET across 299 river basin years. This ratio decreases with increasing ET, suggesting that biases in ET estimates from ignoring TWSC in regions of low ET are larger than in regions with higher ET. As TWSC is relatively constant across latitudes (Syed et al2008), the substantially high ET biases in regions of low ET are mainly related to the disproportionately low ET values. Further analysis shows that there is no effect of the size of a basin. For example, smaller basins are not more sensitive to ignoring TWSC than larger basins (figure S2 available atstacks.iop. org/ERL/7/014026/mmedia). Overall, more than 44% of the river basins have biases larger than 10%, highlighting the importance of including TWSC in the calculation of ET. 3.2. Spatial patterns of global ET
Using equation (2) together with climate and NDVI data, we extrapolated temporal changes in global ET for the period 1982–2009. The global mean annual land ET value for the
period 1982–2009 is about 604 mm yr−1(558–650 mm yr−1), which is comparable to Mueller et al (2011), who compared 30 global observation-based ET datasets and 11 coupled atmosphere–ocean–land global climate models (GCMs) ET datasets from the IPCC Fourth Assessment Report. The global mean annual ET of the 41 datasets ranged from 511 to 650 mm yr−1, with an average value of 580 mm yr−1(Mueller et al2011). ZHA10 used a remote-sensing based dataset and derived a global ET of 539 ± 9 mm yr−1over the period of 1983–2006.
The spatial patterns of ET estimated in this study are consistent with the results from earlier studies (Jung et al
2010, Zhang et al2010). The highest values are observed in the tropical regions (figure2(a)), particularly in northwestern Amazonia, Indonesia and Malaysia. The uncertainty in ET estimates is also the highest in the tropical regions (figure S3 available atstacks.iop.org/ERL/7/014026/mmedia).
3.3. ET trends from 1982 to 2009
Global land ET increased from 1982 to 2009 at the rate of 1.10 ± 0.20 mm yr−2(p< 0.01) (figure3(a)). As illustrated in figure3(b), a positive trend is found in 25% of the pixels, of which the Amazon Basin and Southeast Asia have the highest rate of ET increase. This general upward land ET trend over the past three decades was previously reported by ZHA10 and JUN10; however, the increasing trends in those studies were relatively weaker (table1). All three studies predict significant increase in ET over Europe and Africa. In North America and South America, both this study and ZHA10 estimate a significant increasing trend of ET, while JUN10 shows an insignificant trend. In Asia, ZHA10 estimated a significant negative trend of ET by −0.74 ± 0.22 mm yr−2. In contrast, both this study and JUN10 predict a significant positive trend of ET over Asia at the continental scale.
Recently, JUN10 suggested that the increase in global land ET mainly occurred during 1982–98, which is confirmed by our study. We report global land ET increased by 1.03 ± 0.44 mm yr−2 (p< 0.05), with a significant positive trend in more than 10% of the pixels (figure 3(c)). The average
Environ. Res. Lett. 7 (2012) 014026 Z Zeng et al
Figure 3. Inter-annual variability of global land ET anomaly and spatial distribution of land ET trends. (a) Inter-annual variability of global land ET anomalies. Trends estimated by linear regression are shown as a solid line for 1982–2009, as a blue dashed line for 1982–98 and as a red dotted line for 1998–2009. ** indicates the significance of the trend at the 95% confidence interval; land ET trends (b) during 1982–2009, (c) during 1982–98 and (d) during 1998–2009. The inset panels show the area where the ET trend during the corresponding period is statistically significant (p< 0.05), where blue stands for significant increase and red for significant decrease.
magnitude of this positive trend is within the range of previous estimates of 1.32 ± 0.43 mm yr−2 (p < 0.001)
by ZHA10 and 0.85 ± 0.16 mm yr−2 (p < 0.001) by
JUN10.
In contrast to the pre-1998 increase, global land ET seemed to have slowed down or even completely disappeared thereafter (figure 3). Our results suggest a statistically insignificant trend in global land ET, with a value of −0.10 ± 0.61 mm yr−2over the period 1998–2009 (R2=0.00, p=0.89) (table1, figure3(a)). This is within uncertainties of the trends reported by ZHA10 and JUN10. JUN10 inferred a decline from 1998 to 2008, but this negative trend was not statistically significant (table1). Furthermore, both the magnitude and the sign of the trend during the last decade varied substantially depending on the choice of beginning or ending year (table1). For example, in JUN10, ZHA10 and this work, there is a slight but statistically insignificant increasing trend when the starting year is 1999. Furthermore, in Asia and Europe, JUN10 estimated a significant positive trend of ET since 1999, while this work and ZHA10 converge to no significant trends during the same period (table 1). Our results show that only 10% of the study areas have statistically significant trends, positive or negative, during the period of 1998–2009 (figure3(d)).
As shown in figure3(a), the recent stall in the increasing trend is likely related to the relatively low ET values during the early 2000s when several continental-scale droughts occurred, e.g. the 2002 drought in North America (Seager
2007), the 2003 drought in Europe (Ciais et al 2005) and
the 2005 drought in the Amazon region (Marengo et al
2008). Coincident with the widespread precipitation decrease and consequent decline in vegetation growth during the corresponding year, there was a large-scale reduction in land ET relative to the baseline period (1982–2009) over North America in 2002 (−7.78 mm yr−1, −1.8%), Europe in 2003 (−9.31 mm yr−1, −2.2%) and Southern Amazon in 2005 (south of 3◦S, −50.2 mm yr−1, −4.2%) (figure 4). For example, in response to the 2003 drought event in Europe, particularly in central Europe, more than 31% of the European continental regions experienced negative annual land ET anomalies less than −1 std.
4. Conclusions
We estimated the spatio-temporal change in global land ET from 1982 to 2009 using a water balance approach in this study. The results presented here are consistent with previous reports of a positive trend in ET during the 1980s and 1990s, and a stalling of this trend thereafter. However, this reduction in ET trend during the recent years depended on the choice of the beginning and end dates, not surprisingly given the short period, suggesting that continuous monitoring is required to validate whether this transition is a short-term fluctuation or a sign of a longer-term decline in global land ET. Moreover, our results demonstrate the importance of TWSC for estimation of ET using the water balance equation. Ignoring TWSC, as in previous studies, will significantly bias ET estimation, especially in regions of low ET.
Environ. Res. Lett. 7 (2012) 014026 Z Zeng et al T able 1. T rends in land ET o v er the globe and six continent s estimated by three dif ferent methods. The standard errors of these trends are also pro vided. *, ** and *** indicate the significance of the trends at the 90%, 95% and 99% confidence interv als, respecti v ely . The unit for trend is mm yr − 2. Periods M ethods Global N-America Asia Europe Africa S-America Australia All period This study 1. 10 ∗∗∗ ± 0. 20 0. 56 ∗∗ ± 0. 22 0. 87 ∗∗∗ ± 0. 28 0. 96 ∗∗∗ ± 0. 21 1. 50 ∗∗∗ ± 0. 30 1. 84 ∗∗∗ ± 0. 56 0. 48 ± 0. 49 JUN10 0. 41 ∗∗∗ ± 0. 10 0. 14 ± 0. 14 0. 45 ∗∗∗ ± 0. 10 0. 56 ∗∗∗ ± 0. 11 0. 96 ∗∗∗ ± 0. 22 0. 01 ± 0. 20 0. 31 ± 0. 61 ZHA10 0. 72 ∗∗∗ ± 0. 21 1. 12 ∗∗∗ ± 0. 32 − 0. 74 ∗∗∗ ± 0. 22 1. 24 ∗∗∗ ± 0. 30 1. 22 ∗∗∗ ± 0. 38 3. 21 ∗∗∗ ± 1. 00 − 0. 46 ± 0. 39 Until 1998 This study 1. 03 ∗∗ ± 0. 44 0. 92 ∗ ± 0. 45 0. 91 ± 0. 68 1. 01 ∗∗ ± 0. 47 1. 68 ∗∗ ± 0. 75 0. 51 ± 1. 17 1. 16 ± 0. 98 JUN10 0. 85 ∗∗∗ ± 0. 16 0. 56 ∗∗ ± 0. 21 0. 86 ∗∗∗ ± 0. 18 0. 78 ∗∗∗ ± 0. 25 1. 57 ∗∗∗ ± 0. 41 0. 44 ± 0. 33 1. 03 ± 0. 62 ZHA10 1. 32 ∗∗∗ ± 0. 43 1. 71 ∗∗ ± 0. 66 − 0. 36 ± 0. 41 2. 36 ∗∗∗ ± 0. 56 3. 08 ∗∗∗ ± 0. 48 3. 10 ± 2. 25 − 0. 86 ± 0. 53 Since 1998 T his study − 0. 10 ± 0. 61 − 0. 02 ± 0. 97 − 0. 21 ± 0. 72 0. 81 ± 0. 74 0. 46 ± 0. 68 0. 67 ± 1. 95 − 3. 00 ± 1. 71 JUN10 − 0. 16 ± 0. 50 0. 26 ± 0. 73 0. 57 ± 0. 41 0. 80 ∗∗ ± 0. 28 − 0. 06 ± 0. 94 − 0. 61 ± 0. 96 − 6. 17 ∗ ± 2. 91 ZHA10 − 0. 46 ± 0. 74 0. 14 ± 1. 48 0. 06 ± 0. 86 − 0. 41 ± 0. 62 − 0. 90 ± 1. 49 − 2. 25 ± 1. 98 − 1. 77 ± 2. 36 Since 1999 Thi s study 0. 15 ± 0. 71 0. 89 ± 0. 98 0. 06 ± 0. 85 1. 26 ± 0. 83 0. 68 ± 0. 80 − 0. 02 ± 2. 30 − 2. 78 ± 2. 05 JUN10 0. 31 ± 0. 52 0. 99 ± 0. 73 1. 18 ∗∗∗ ± 0. 26 0. 77 ∗ ± 0. 34 0. 73 ± 1. 00 − 0. 19 ± 1. 14 − 7. 15 ∗ ± 3. 50 ZHA10 0. 68 ± 0. 45 2. 35 ∗∗ ± 0. 96 0. 92 ± 0. 91 − 1. 05 ± 0. 64 − 0. 11 ± 1. 83 0. 28 ± 1. 73 − 2. 73 ± 2. 96 1998–2006 This study − 0. 87 ± 0. 85 1. 04 ± 1. 58 − 1. 66 ∗∗ ± 0. 50 − 1. 40 ± 0. 82 − 0. 31 ± 1. 07 1. 64 ± 3. 27 − 6. 20 ∗ ± 2. 66 JUN10 − 0. 05 ± 0. 74 0. 18 ± 1. 07 0. 48 ± 0. 60 0. 89 ∗∗ ± 0. 36 0. 11 ± 1. 40 1. 29 ± 1. 02 − 7. 90 ± 4. 36 ZHA10 − 0. 46 ± 0. 74 0. 14 ± 1. 48 0. 06 ± 0. 86 − 0. 41 ± 0. 62 − 0. 90 ± 1. 49 − 2. 25 ± 1. 98 − 1. 77 ± 2. 36 1983–2006 This study 1. 12 ∗∗∗ ± 0. 25 0. 74 ∗∗ ± 0. 28 0. 63 ∗ ± 0. 33 0. 71 ∗∗ ± 0. 27 1. 68 ∗∗∗ ± 0. 39 2. 33 ∗∗∗ ± 0. 71 0. 47 ± 0. 66 JUN10 0. 48 ∗∗∗ ± 0. 13 0. 07 ± 0. 17 0. 42 ∗∗∗ ± 0. 12 0. 56 ∗∗∗ ± 0. 14 1. 16 ∗∗∗ ± 0. 26 0. 27 ± 0. 21 0. 58 ± 0. 76 ZHA10 0. 72 ∗∗∗ ± 0. 21 1. 12 ∗∗∗ ± 0. 32 − 0. 74 ∗∗∗ ± 0. 22 1. 24 ∗∗∗ ± 0. 30 1. 22 ∗∗∗ ± 0. 38 3. 21 ∗∗∗ ± 1. 00 − 0. 46 ± 0. 39 6
Environ. Res. Lett. 7 (2012) 014026 Z Zeng et al
Figure 4. Spatial distributions of standardized anomalies of detrended ET (a) over North America in 2002, (b) over Europe in 2003 and (c) over South America in 2005.
There are a few points that deserve further study. Although a general agreement exists between the FLUXNET up-scaling method of JUN10 and ZHA10 for instance and our simple empirical water balance method, the model uses temperature as one of the independent variables instead of solar radiation due to lack of requisite solar radiation data sets. All the three methods suffer from a ‘space for time’ substitution hypothesis. In addition, the effects of land use change and rising atmospheric CO2 concentrations, as well
as humidity, were not taken into account in our simulation, which invariably introduced additional uncertainty. Finally, both temperature and precipitation not only influence ET directly but also indirectly through NDVI, in our approach and in JUN10 as well. For these reasons, our analysis was focused on spatio-temporal changes rather than mechanisms. Further studies based on process-based ET models by including all the driving factors are needed to precisely explore the mechanisms (e.g. soil moisture change (Jung et al 2010), wind speed decrease (McVicar et al 2012), solar radiation change (Teuling et al 2009), land-use change (Piao et al2007) or closure caused by increasing CO2 (Gedney et al 2006))
underlying historical change in global land ET over the past several decades.
Acknowledgments
We thank Dr M Jung for helpful comments, the Jet Propulsion Laboratory (JPL) supported by the NASA MEASURES Program for providing GRACE land data and the Global Runoff Data Centre (GRDC) for runoff data. This study was
supported by the National Natural Science Foundation of China (grants 41125004 and 31021001).
References
Alton P, Fisher R, Los S and Williams M 2009 Simulations of global evapotranspiration using semiempirical and mechanistic schemes of plant hydrology Glob. Biogeochem. Cycles
23 GB4023
Ciais P et al 2005 Europe-wide reduction in primary productivity caused by the heat drought in 2003 Nature437 529–33
Fisher J B, Whittaker R J and Malhi Y 2011 ET come home: potential evapotranspiration in geographical ecology Glob. Ecol. Biogeogr.20 1–18
Gedney N, Cox P M, Betts R A, Boucher O, Huntingford C and Stott P A 2006 Detection of a direct carbon dioxide effect in continental river runoff records Nature439 835–8
GRDC 2007 Major River Basins of the World/Global Runoff Data Centre(Koblenz: Federal Institute of Hydrology (BfG)) Holben B N 1986 Characteristics of maximum-value composite
images from temporal AVHRR data Int. J. Remote Sens.
7 1417–34
Jung M et al 2010 Recent decline in the global land
evapotranspiration trend due to limited moisture supply Nature
467 951–4
Marengo J A, Nobre C A, Tomasella J, Oyama M D,
De Oliveira G S, De Oliveira R, Camargo H, Alves L M and Brown I F 2008 The drought of Amazonia in 2005 J. Clim.
21 495–516
McVicar T R et al 2012 Global review and synthesis of trends in observed terrestrial near-surface wind speeds: implications for evaporation J. Hydrol.416/417 182–205
Mitchell T D and Jones P D 2005 An improved method of constructing a database of monthly climate observations and associated high-resolution grids Int. J. Climatol.25 693–712
Environ. Res. Lett. 7 (2012) 014026 Z Zeng et al
Mueller B et al 2011 Evaluation of global observations-based evapotranspiration datasets and IPCC AR4 simulations Geophys. Res. Lett.38 L06402
Myneni R B, Tucker C J, Asrar G and Keeling C D 1998
Interannual variations in satellite-sensed vegetation index data from 1981 to 1991 J. Geophys. Res.103 6145–60
Nachabe M, Shah N, Ross M and Vomacka J 2005
Evapotranspiration of two vegetation covers in a shallow water table environment Soil Sci. Soc. Am. J.69 492–9
Oki T and Kanae S 2006 Global hydrological cycles and world water resources Science313 1068–72
Piao S, Friedlingstein P, Ciais P, de Noblet-Ducoudr´e N, Labat D and Zaehle S 2007 Changes in climate and land use have a larger direct impact than rising CO2on global river
runoff trends Proc. Natl Acad. Sci. USA104 15242–7
Rodell M and Famiglietti J S 1999 Detectability of variations in continental water storage from satellite observations of the time dependent gravity field Water Resour. Res.
35 2705–23
Rodell M, Famiglietti J S, Chen J, Seneviratne S I, Viterbo P, Holl S and Wilson C R 2004 Basin scale estimates of evapotranspiration using GRACE and other observations Geophys. Res. Lett.31 L20504
Rodell M, Velicogna I and Famiglietti J S 2009 Satellite-based estimates of groundwater depletion in India Nature
460 999–1002
Seager R 2007 The turn of the century North American drought: global context, dynamics, and past analogs J. Clim.20 5527–52
Skidmore E L, Jacobs H S and Powers W L 1969 Potential evapotranspiration as influenced by wind Agron. J.61 543–6
Swenson S and Wahr J 2006 Post-processing removal of correlated errors in GRACE data Geophys. Res. Lett.33 L08402
Syed T H, Famiglietti J S, Rodell M, Chen J and Wilson C R 2008 Analysis of terrestrial water storage changes from GRACE and GLDAS Water Resour. Res.44 W02433
Tapley B D, Bettadpur S, Ries J C, Thompson P F and
Watkins M M 2004 GRACE measurements of mass variability in the Earth system Science305 503–5
Teuling A J et al 2009 A regional perspective on trends in continental evaporation Geophys. Res. Lett.36 L02404
Trenberth K E, Fasullo J T and Kiehl J 2009 Earth’s global energy budget Bull. Am. Meteorol. Soc.90 311–23
Tucker C, Pinzon J, Brown M, Slayback D, Pak E, Mahoney R, Vermote E and Saleous N 2005 An extended AVHRR 8 km NDVI dataset compatible with MODIS and SPOT vegetation NDVI data Int. J. Remote Sens.26 4485–98
Verstraeten W, Veroustraete F and Feyen J 2008 Assessment of evapotranspiration and soil moisture content across different scales of observation Sensors8 70–117
Wang X, Piao S, Ciais P, Li J, Friedlingstein P, Koven C and Chen A 2011 Spring temperature change its implication in the change of vegetation growth in North America from 1982 to 2006 Proc. Natl Acad. Sci. USA104 1240–5
Zhang K, Kimball J S, Nemani R R and Running S W 2010 A continuous satellite-derived global record of land surface evapotranspiration from 1983 to 2006 Water Resour. Res.
46 W09522