HAL Id: cea-01484052
https://hal-cea.archives-ouvertes.fr/cea-01484052
Submitted on 6 Mar 2017
HAL is a multi-disciplinary open access
archive for the deposit and dissemination of
sci-entific research documents, whether they are
pub-lished or not. The documents may come from
teaching and research institutions in France or
abroad, or from public or private research centers.
L’archive ouverte pluridisciplinaire HAL, est
destinée au dépôt et à la diffusion de documents
scientifiques de niveau recherche, publiés ou non,
émanant des établissements d’enseignement et de
recherche français ou étrangers, des laboratoires
publics ou privés.
magnetism, collapsing, and three-dimensional dispersion
of the Co pnictides A Co 2 As 2 ( A = Ba , Sr, Ca)
Joseph Mansart, Patrick Le Fèvre, François Bertran, Anne Forget, Dorothée
Colson, Véronique Brouet
To cite this version:
Joseph Mansart, Patrick Le Fèvre, François Bertran, Anne Forget, Dorothée Colson, et al.. Influence
of surface symmetry breaking on the magnetism, collapsing, and three-dimensional dispersion of the
Co pnictides A Co 2 As 2 ( A = Ba , Sr, Ca). Physical Review B: Condensed Matter and Materials
Physics (1998-2015), American Physical Society, 2016, 94 (23), �10.1103/PhysRevB.94.235147�.
�cea-01484052�
Influence of the surface symmetry breaking on the magnetism, collapsing and three
dimensional dispersion of Co pnictides ACo
2As
2(A=Ba, Sr, Ca)
Joseph Mansart,1 Patrick Le Fèvre,2 François Bertran,2Anne Forget,3 Dorothée Colson,3 and Véronique Brouet†,4
1Laboratoire de Physique des Solides, Université Paris-Sud, UMR 8502, Bât. 510, 91405 Orsay, France 2Synchrotron SOLEIL, L’Orme des Merisiers, Saint-Aubin-BP 48, 91192 Gif sur Yvette, France
3
Service de Physique de l’Etat Condensé, Orme des Merisiers, CEA Saclay, CNRS-URA 2464, 91191 Gif sur Yvette Cedex, France
4Laboratoire de Physique des Solides, Université Paris-Sud, UMR 8502, Bât. 510, 91405 Orsay, France (Dated: December 22, 2016)
We use angle-resolved photoemission (ARPES) to study the three dimensional (3D) electronic structure of Co pnictides ACo2As2with A=Ba, Sr, Ca or a mixture of Sr and Ca. These compounds are isostructural to Fe based superconductors, but have one more electron in the Co 3d orbitals. Going from Ba to Ca, they become more and more 3D, eventually forming a “collapsed” tetragonal phase, where the distance between CoAs layers is markedly reduced. We observe with ARPES the periodicity of the electronic structure as a function of kz (i.e. perpendicularly to CoAs layers) and find that it matches in each case that expected from the distance between the planes in the bulk. However, the electronic structure is better fitted by a calculation corresponding to a slab with 2 CoAs layers than to the bulk structure. We attribute this to subtle modifications of the 2D electronic structure induced by the truncation of the 3D dispersion at the surface in the ARPES measurement. We further study how this affects the electronic properties. We show that, despite this distortion, the electronic structure of CaCo2As2 is essentially that expected for a collapsed phase. Electronic correlations produce a renormalization of the electronic structure by a factor 1.4, which is not affected by the transition to the collapsed state. On the other hand, a small shift of the Fermi level reduces the density of states in the egbands and suppresses the magnetic transition expected in CaCo2As2. Our study evidences that observing the 3D bulk periodicity is not sufficient to ensure bulk sensitivity. It further gives direct information on the role of 3D interactions, mostly governed by Co-As hybridization, among eg and t2gorbitals. It is also useful to better understand the electronic structure of Fe superconductors and the range of validity of ARPES measurements.
I. INTRODUCTION
Layered systems play a central role in the study of cor-related systems, since the reduced dimensionality typ-ically enhances the strength of electronic correlations. Cuprates, iron-based superconductors, transition-metal chalcogenides are all examples of layered systems. While the electronic structure of one layer often works as a good approximation for the electronic structure of the bulk material, interlayer couplings are ultimately also crucial. This is evidenced by default by the specific properties dis-covered more and more in monolayers, from graphene to MoS2. The most direct probe of the electronic structure
of one system is arguably angle-resolved photoemission (ARPES). However, it is extremely surface sensitive, the typical escape depth of electrons at the photon energies enabling high resolution (10-100eV) being 5Å[1, 2]. One can therefore question whether the measured electronic structure corresponds to that of the bulk, or the surface, or a monolayer and how these different cases connect to each other.
We tackle this problem by investigating a family of Co pnictides, ACo2As2, where the distance between the
CoAs layers can be tuned from 5.2Å to 6.3Å by inter-calating different ions A (Ba, Sr, Ca) between the lay-ers. This family is isostructural to the “122” family of Fe superconductors, as sketched in Fig. 1a. For A=Ca, the structure is “collapsed”, as found in CaFe2As2
un-der pressure [3], meaning that, although the structural symmetry remains the same, the distance between CoAs layers is markedly reduced, enabling the formation of As dimers between the planes (see arrows in Fig. 1a). We establish that ARPES measures very well the bulk dis-tance between the CoAs layers, but also evidence traces of an underlying bilayer structure. We investigate the meaning of this finding by detailed comparison between measurements and calculations for bulk and 2 layers slab structures.
These Co pnictides are isostructural with the “122” family of Fe superconductors [4], which exhibit a very rich multi-orbital electronic structure, enabling original types of electronic correlations [5, 6]. When Fe is fully substituted with Co, there is one more electron per site, i.e. 7 electrons in the 3d shell. The general expectation is that Co compounds will be less correlated than their Fe counterparts [7], because they are further away from half filling, where correlations would be the strongest. However, an interesting feature is that the extra electron reaches eg levels that are empty for Fe pnictides. They
form a very flat band near the Fermi level, yielding a high density of states at the Fermi level n(EF), favorable
to Stoner-like ferromagnetism [8–10]. Co pnictides then offer the opportunity to study the physics of this struc-ture in a more itinerant limit than Fe pnictides, where magnetism is also present but probably of a very different nature.
A
Co
As
Figure 1. (a) Sketch of the structure of ACo2As2. (b) c axis value as a function of the nominal fraction of Ca and Sr. (c) Photoemission spectra showing the As 3d core levels measured at 100 eV photon energy in the indicated compounds. Each As gives rise to a doublet due to spin-orbit splitting and up to three As doublets are observed as indicated by dotted, solid and red lines. (d) Peak positions of the lowest binding energy for each As 3d doublet as a function of c. (e) Percentage of the three doublets as a function of photon energy for CaCo.
In BaCo2As2 [8] and SrCo2As2 [9], there is an
en-hanced magnetic susceptibility, suggesting proximity of a quantum instability, but no magnetic transition down to low temperatures. In CaCo2As2, on the other hand,
there is a transition to an antiferromagnetic (AF) state below 72K [11, 12], where the CoAs layers order ferro-magnetically [13], in good agreement with the ferromag-netic tendency expected from the high n(EF). The case
of Ba is the one that has been studied by ARPES in more details [7, 14], although some data are also available for Sr [9] and Ca [10]. In this paper, we use ARPES to give a complete picture of the electronic structure of these com-pounds. We evidence an increased 3D character from Ba to Ca, in good agreement with bulk calculations (sec-tion III). There are, however, some devia(sec-tions that are better explained by a 2 layers slab structure calculation (section IV). We finally give special attention to the tran-sition in CaCo2As2to the collapsed structure (section V)
and magnetic phase (section VI). We conclude that the structure measured by ARPES for Ca is collapsed, but not magnetic. This is attributed to an upward shift of the eglevels at the surface, which proves by default their
role in the magnetic transition. We finally discuss the implications of these findings for ARPES studies of Fe pnictides in general (section VII).
II. EXPERIMENTAL AND CALCULATION DETAILS
We have synthesized single crystals of ACo2As2
(ab-breviated as ACo in the following), for A=Ba, Sr, Ca, with methods similar to those used in Fe pnictides pre-viously [15]. Starting reagents of high purity Ba, Sr and/or Ca and CoAs were mixed in the molar ratio 1:4. For ARPES measurements, the crystals were cleaved in ultra-high vacuum at low temperatures. The cleavage plane is between two CoAs layers (see Fig. 1a) and the surface neutrality is preserved by removing half the A ions of the top layer [16]. To better study the transition between “normal” and “collapsed” phases [3], we synthe-sized compounds with intermediate values of c using a combination of Ca and Sr. The evolution of c is given in Fig. 1(b). The magnetic properties of the low Sr doping were studied in [12] and a similar structural evolution was reported for (Ca,Sr)Co2P2[17]. In this paper, we report
on Ca0.8Sr0.2 (c=10.82Å) and Ca0.6Sr0.4 (c=11.41Å). In
our CaCo sample, the magnetic transition, measured by SQUID, takes place at 72K, as reported by [11], but dif-ferent from ref. [10], where TN=52K was obtained and
the stoichiometry was estimated to CaCo1.86As2.
The 3d core-levels of As, presented in Fig. 1(c), al-low to evidence the transition to the collapsed phase. They can generally be fitted by a pair of spin-orbit split doublets, assigned to bulk (solid black lines) and surface
3
Figure 2. (a) Spectral weight integrated in a 10 meV window around EF in the indicated compounds, as a function of photon energy. The k axis is indicated in (b). X is indicated by a white vertical line. White horizontal lines indicate the extrema corresponding to even (solid) or odd (dotted) values of kz. (b) Sketch of two adjacent BZ at kz=0 and kz=1 (top) and 3D view (bottom). The red line indicates the direction of the cut measured in (a) using s-polarization. (c) kF, extracted from the previous maps, as a function of photon energy for BaCo, SrCo and CaCo. Extrema corresponding to odd kz are indicated by vertical lines. (d) Extrema of kz, in units of 4π/c, determined experimentally as a function of photon energy for the different compounds. Solid lines are fits to Eq. (2) assuming V0=13.5eV and giving the values of c indicated on the graph.
(dotted black lines) contributions. In the collapsed phase, a new doublet appears at high binding energies, showed in red, probably as a result of a highest electronic den-sity around As in this structure. We observed a similar shift to high energy in collapsed CaFe2As2 (not shown),
as also reported in [18]. This evidences that the last two compounds have collapsed structures. All these peak po-sitions are reported in Fig. 1(d). Experiments at high photon energy, up to 600eV, in Fig. 1(e), demonstrate that the first two doublets are bulk in nature, while the outer one is a surface contribution. The reason why three doublets appear in the collapsed phase is still to be de-termined.
Our ARPES experiments were carried out at the CAS-SIOPEE beamline of the SOLEIL synchrotron, with a Scienta R4000 analyzer, an angular resolution of 0.3◦and an overall energy resolution from 5meV around 30eV to 15meV around 100eV. For most of the data shown in the paper, the polarization A was Linear Vertical (LV), lying in the sample surface plane. This selects even orbitals in the plane containing A and the surface normal (this will be called p-polarization in the following) and odd orbitals for the perpendicular plane (s-polarization). All measurements were done at 20K, except when noted
oth-erwise.
We performed band structure calculations using the
WIEN2k software [19]. We used structures
deter-mined experimentally for BaCo (c=12.65Å) [20], SrCo (c=11.8Å) [9] and CaCo (c=10.33Å) [21]. Interestingly, in all these cases, the position z of As above the Co plane is ∼ 1.27Å, very close from the value we optimized the-oretically. Note that early determination of z [21] gave the opposite impression with z decreasing from 1.41Å in BaCo to 1.27Å in CaCo. This is at variance with the case of Fe pnictides, where z is usually much larger in experiment than the calculated one. This is believed to be the sign of the presence of local magnetic moments in Fe pnictides, as the optimized value of z in magnetic calculations correspond much better to the experimental one [22]. This can be taken a contrario as an indirect proof that such moments have indeed disappeared in all Co pnictides.
III. THREE DIMENSIONAL ELECTRONIC STRUCTURE
We start our analysis by investigating the periodicity of the kzdispersion, perpendicularly to the cleaved surface.
This can be done with ARPES by scanning the photon energy hν. The conservation of energy during the pho-toemission process [1, 2] dictates that the kinetic energy Ekinof the detected electron is that of the photon minus
the binding energy EB of the photoexcited electron and
the work function W paid to cross the surface.
Ekin= hν − W − EB (1)
= ~2(k//2 + kz2)/2m − V0 (2)
This outgoing electron is usually assumed to be in a free electron state. It is defined by a parabola with a bottom at an inner potential -V0, as written in Eq. 2, where k//
and kz are components of the momentum of the electron
before crossing the surface. The wave vector parallel to the surface k// is conserved, but not the component
per-pendicular to the surface kz. However, one sees from Eq.
(1) and (2) that kzwill increase with hν and one expects
periodic variations in units of 2π/c for a fixed k//. This
is how kz will be determined. For these compounds, the
expected 3D periodicity along kz is 4π/c, as there are 2
planes per unit cell.
In Fig. 2(a), we show the variation with the photon en-ergy of the spectral weight integrated at the Fermi level, along the diagonal of the Brillouin Zone (BZ). This direc-tion is shown in Fig. 2(b) as a red line and the polariza-tion A, perpendicular to it, selects odd orbitals, in this case mainly the dxz/dyz electron band [23]. Note that
the stacking of the BZ is such that when X lies in the plane defined by kz, this direction measures a dispersion
corresponding to 1-kz (see Fig. 2b). In all cases, there
is a clear periodic variation with photon energy. The successive extrema are marked with white solid/dotted lines for even/odd kz. In Fig. 2(c), we plot kF as a
function of photon energy extracted from these maps to evidence how these extrema are shifting in the different compounds.
These different periodicities correspond to the different values of c. Usually, kz is adjusted from this periodicity
using, in Eq. (2), the bulk value of c and fitting V0 as
a parameter. Here, we fix V0=13.5 eV, a usual value for
Fe pnictides [24, 25], and fit the values of c. We obtain a good description of the data, as shown in Fig. 2(d), and values of c strikingly close to the bulk values, as indicated on the graph. This shows unambiguously that ARPES is sensitive to the bulk distance between the planes and that there is no strong variation of this distance near the surface.
Next, we replot in Fig. 3 these contours as a function of kz. They match quite remarkably the contours
calcu-lated for the bulk structures. For example, we observe an
-0.8 -0.6 -0.4 -0.2 0.0 Energy (eV) -1.0 -0.5 0.0 0.5 1.0 k axis (p/a units) -0.8 -0.6 -0.4 -0.2 0.0 Energy (eV) -1.0 -0.5 0.0 0.5 1.0 k axis (p/a units) -0.8 -0.6 -0.4 -0.2 0.0 Energy (eV) -1.0 -0.5 0.0 0.5 1.0 k axis (p/a units)
kz=1 Bulk kz=1 -0.8 -0.6 -0.4 -0.2 0.0 Energy (eV) -1.0 -0.5 0.0 0.5 1.0 k axis (p/a units) -0.8 -0.6 -0.4 -0.2 0.0 Energy (eV) -1.0 -0.5 0.0 0.5 1.0 k axis (p/a units) -0.8 -0.6 -0.4 -0.2 0.0 Energy (eV) -1.0 -0.5 0.0 0.5 1.0 k axis (p/a units)
kz=0 Bulk kz=0 1.0 0.8 0.6 0.4 kF (p /a units) 10 9 8 7 6 kz (4p/c units) Ca 1.0 0.8 0.6 0.4 kF (p /a units) 10 9 8 7 6 kz (4p/c units) Sr 1.0 0.8 0.6 0.4 kF (p /a units) 10 9 8 7 6 kz (4p/c units) Ba 2.0 1.5 1.0 0.5 1.2 0.8 0.4 0.0 G X -3 -2 -1 0 1 2.8 2.4 2.0 1.6 G X 18 16 14 12 10 8 6 1.1 0.6 0.1 G X kz=0 kz=1
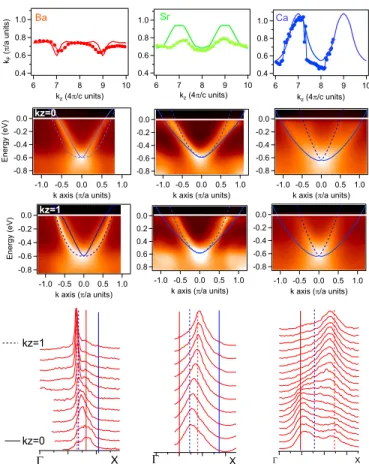
Figure 3. The different columns correspond to data measred for BaCo, SrCo and CaCo, respectively. 1st row : symbols are experimental values of kF as a function of kz for the dxz/dyz electron band. They were extracted from the maps of Fig. 2 by lorentzian fits and/or determination of local maxima. The contour expected in bulk calculation is shown as solid line. 2nd row : Energy-momentum images of dispersion along ΓX at kz=0 (68eV for BaCo, 50eV for SrCo and 63eV for CaCo). k = 0 corresponds to X. Lines indicate bulk calculation at kz=0 (solid line) and kz=1 (dotted line) renormalized by 1.4. For CaCo, data are also shifted up by 70 meV. 3rd row : Same for kz=1 (86eV for BaCo, 68eV for SrCo and 85eV for CaCo). 4th row : MDC stacks along ΓX from kz=0 (lower spectrum) to kz=1 (higher spectrum). Vertical lines indicate the calculated positions of kF in bulk calculation at kz=0 (solid) and kz=1 (dotted) for dxz/dyz (red) and dxy(blue).
inversion of minima and maxima at kz=1 between BaCo
and SrCo, as calculated, and a large increase of the kz
dispersion between SrCo and CaCo, corresponding to the transition to the collapsed phase. Nevertheless, in SrCo, the kz dispersion appears smaller experimentally than
theoretically.
In rows 2 and 3 of Fig. 3, we show the
energy-momentum images at kz=0 and 1, together with the bulk
calculation for dxz/dyz, renormalized by 1.4 and shifted
up by 70 meV for CaCo. Although a dxyelectron band is
also expected in this direction, it is not intense in these experimental conditions and will be studied later. The calculated dispersion describes generally quite well the
5
Figure 4. (a-b) Calculated FS for the bulk SrCo at kz=0 and 1 (a) and kz=0.5 (b). Colors indicate the predominant orbital character : dx2−y2 (pink), dxy (blue) or dxz/dyz (green). The filled part of the green sheet is shaded in green. (c) Red circles
: experimental dispersion along ΓMX, taken from the images shown in (d-f). They are compared with calculation for the bulk at kz=0 (red dotted line) and for the 2 layers slab model (black lines), both renormalized by 1.4. (d) Energy-momentum image measured at 30eV (kz=0) along ΓM. Green points indicate FS crossings expected from (a). (e) Energy-momentum image measured at 70eV (kz=0.5) along MX. Open green and blue points indicate FS crossings expected from (b). (f) Energy-momentum image measured at 44eV (kz=1) along MX. Blue point indicates FS crossing expected from (a) and green point the position of the band forming the green sheet at M in (a).
experiment. In particular, the bottom of the band, which is fixed in kz, is well fitted in each case with this
renor-malization. The renormalization value is in good agree-ment with the one previously found for BaCo [7]. It is smaller than the one used for BaFe2As2 lightly doped
with Co (we estimated ∼2 for electron pockets in ref. [26]), but not dramatically despite the large change of doping. Moreover, it does not seem to evolve much with the increased dimensionality and/or the collapsed tran-sition in SrCo and CaCo.
For BaCo, the bulk calculation reproduces very well the characteristic difference of band shapes from trian-gular at kz=0 to rounded at kz=1. For SrCo and CaCo,
there is a good agreement at kz=1, but it is not as good
at kz=0. For SrCo, the band does not open as much as
expected, as already noticed, and, f or CaCo, it seems that we observe simultaneously dispersions correspond-ing to kz=0 and kz=1. A closer inspection of the MDC
lineshapes, displayed in the 4th row of Fig. 3, shows that there is a strong broadening as a function of kz in all
compounds, although it is more obvious for CaCo. The lineshape are rather good lorentzians near kz=1, but
dis-torts for smaller kz. The intensity tends to spread
be-tween the values expected at kz=0 (solid red line) and 1
(dotted red line), often with local maxima at these two extreme values. We also indicate with blue lines the
posi-tions expected for dxy, which evidences these lineshapes
cannot be explained by a residual contribution from dxy.
The most dramatic case is CaCo at kz=0, where there
is almost a “doublet” structure corresponding to these two values. We observed a similar broadening with kz in
LiFeAs [23], so that we believe these lineshapes are typ-ical from Fe pnictides. It is of course crucial to take this into account to attempt any fitting of the dispersions and avoid mistaking this structure for two different bands.
A broadening of the MDC lineshape in 3D systems is commonly expected in ARPES, as the incertitude on kz
induces an integration over a finite kzrange [27, 28]. The
lineshape should depend both on the kz dispersion and
the lifetime of the final state [29], so that a detailed pre-diction is difficult. However, the doublet observed here at kz=0 is also reminiscent of a bilayer system. In systems
with few layers, one expects to build progressively a 3D dispersion, when adding more and more layers. This was nicely observed for a few layers of graphene [30], where N peaks were observed for N layers, with oscillating inten-sities as a function of photon energy. Such oscillations are expected from the different symmetries of the wave functions (bonding and antibonding for a bilayer system [31]). As N increases, the dispersion of the N peaks con-verge to the 3D dispersion. This raises questions on the meaning of the 3D dispersion observed here, especially
whether thinking in terms of an underlying bilayer struc-ture could be meaningful.
IV. MODEL WITH 2 LAYERS SLAB
To explore this idea, we have performed calculations for a 2 layers slab. To avoid doubling the unit cell, we consider the structure of Fig. 1(a) with 7Å of vaccum above and below and remove one electron to the alkali-earth atom facing vacuum, to preserve stoichiometry. In reality, stoichiometry is preserved by removing half of the alkali-earth at the surface [16]. We keep the structural positions to the bulk values. We have observed that re-laxing these positions modifies only marginally the elec-tronic structure. We believe this is a minimal model to explore how the symmetry breaking at the surface im-pacts the electronic structure.
The major impact of the 3D dispersion occurs in fact at the limits of the BZ. As exemplified in Fig. 4(a-b) in the case of SrCo, the FS consists of small electron pock-ets of dx2−y2 character around the Γ point (pink color)
and two larger sheets of predominantly dxy (blue) and
dxz/dyz (green) character. The area filled in green
indi-cates the filled parts of the green sheet. At kz=0.5, the
two sheets form large electron pockets around X, as they do in Fe pnictides, but, at kz=0 and 1, the outer sheet
is large enough to intersect the BZ boundaries. Along ΓM, it forms a small electron pocket, delimited by green points on Fig. 4(d). We indeed observe such a pocket experimentally, although it is a bit smaller in diameter. Along MX, at kz=0.5 [Fig. 4(e)], two electron pockets
are expected (blue and green points), as observed, al-though again with slightly different kF values. Along
MX at kz=0 or 1 [Fig. 4(f)], only one band should cross
the Fermi level (blue point), the other band rising up to -0.2eV at M (green point). We observe a clear band cross-ing EF at the blue point, but, for the other band, there
is a large distribution of intensities starting well above the green point and extending to the Fermi level.
For a quantitative comparison, we report in Fig. 4(c) these experimental dispersions (red circles) together with the bulk calculation at kz=0 (red dotted line) and the 2
layers slab calculation (black lines). All calculations are renormalized by 1.4, as for Fig. 3. While this describes reasonably well most features, there is a clear deviation near M, where the calculated bulk band should be shifted up by 0.2 eV to fit the experiment (see arrow). Interest-ingly, the deviation between the bulk and 2 layers slab calculation exhibits a similar behavior, with the largest deviation in this area. We conclude that the deviation observed in SrCo is indeed due to a deviation between the 3D dispersion measured by ARPES and the 3D bulk dispersion. We suggest that comparing bulk and few lay-ers calculation is a relatively easy way to pinpoint these deviations.
V. TRANSITION TO THE COLLAPSED PHASE
Having evidenced that the electronic structure mea-sured by ARPES may deviate from the bulk structure, it is interesting to wonder whether ARPES will be sen-sitive to the transition to the collapsed phase that de-pends crucially on interaction between As of neighboring layers. Indeed, As dimers will be broken at the cleaved surface, so that, despite the fact that we know from Fig. 2 that the distance between the CoAs layers is that of the collapsed phase in our CaCo sample, some modification could occur. Fig. 5(a) gives the FS expected from bulk calculation at kz=0 and 1. The main difference
com-pared to SrCo is that the dxy electron sheet is largely
suppressed, except for a small portion near kz=1. This
was explained in details by Andersen and Boeri [32]. As a counter part, a large pocket of dx2−y2/dz2 character
develops around X.
Our data support the large suppression of the dxy
elec-tron band. To observe it, we measure again along the diagonal of the BZ, but with the light polarization along this direction, instead of perpendicularly to it, as in Fig. 2(b) [23]. At kz=1, in Fig. 5(c), we observe dxy clearly,
as marked by the arrow. However, it rapidly disappears away from that kz value. At kz=0, shown in Fig. 5(b),
there is no clear sign of it.
The band structure along MX gives definitive evidence of the transition to the collapsed phase. On the left part of Fig.5(d), we show the bulk band calculation at kz=0
and kz=0.5, for the collapsed CaCo phase, renormalized
by 1.4 and shifted up by 70 meV, as in Fig. 3. As a consequence of the suppression of the blue sheet, two bands (marked by blue circles) remain below EFat kz=0.
One is nearly flat reaching -0.4eV at M. In Fig. 5(f-g), we observe such a flat band (see arrow), supporting the transition to the collapsed phase, as was also suggested from the change in the As core-levels (Fig. 1) or the larger kzdispersion of dxz/dyz(Fig. 3). Thus, the broken
As dimers at the surface do not prevent the transition to the collapsed phase. Interestingly, this is also true for the 2 layer slab calculation [right part of Fig. 5(d)], where one band has strongly shifted down compared to SrCo [see Fig. 4(c)]. However, there are still 3 bands approaching EF, instead of only 2 in the bulk, suggesting
a smaller degree of collapsing. These differences in the degree of collapsing are probably responsible for the shift of 70 meV we have to apply to the bulk calculation to fit our data in CaCo. The dxy electron sheet may, for
example, contain some more electrons than in the fully collapsed case, requiring a reduction of the size of the green sheet.
As for SrCo, there are also deviations between the measured bands and the bulk calculation, where the hy-bridization with bands having strong 3D dispersion is the largest, i.e. near the M point. In our data, we observe for all kzone or two bands crossing the Fermi level along
MX, as seen on the map as a function of photon energy of Fig. 5(e), whereas only one around kz=0.5 is expected in
7
Figure 5. (a) Fermi Surface calculated for CaCo at kz=0 and 1. The main orbital character of the different sheets is eg for pink and purple dots, dxz/dyz for green dots, dxy for blue dots. The occupied part of the green sheet is shaded in green. (b) Dispersion along the BZ diagonal at 82 eV (kz∼0) with p-polarization. (c) Same at 106 eV (kz∼1). (d) Red circles : experimental dispersion obtain near kz=0 and 1, compared on the left with bulk calculation at kz=0 (red lines) and 0.5 (blue dotted lines) and on the right with the 2 layers slab calculation (black lines). In both cases, the calculation is renormalized by 1.4 and shifted up by 70 meV. (e) Spectral weight integrated at the Fermi level along MX direction as a function of photon energy. (f) Dispersion along MX at 82 eV (kz∼0). (g) Dispersion along MX at 100 eV (kz∼0.5). The blue arrows indicate the position of the flat band indicated by blue circles in (d).
bulk calculation. This means that the green sheet does not extend as much in the BZ as expected in the bulk calculation. As in Fig. 2, there is a characteristic beat-ing of intensity between two extrema, with coexistence for some photon energies. As kz=0 and kz=1 are
equiva-lent by symmetry along MX, it is clear here that it is not due to a different band structure, but just to a modula-tion of the intensities. The images corresponding to the smallest and largest kF are shown in Fig. 5(f-g). Their
dispersions are reported in Fig. 5(d) and it is clear that the calculated bulk bands (left part) should be shifted up at M by 0.2eV to fit the data. On the other hand, the 2 layers slab calculation (right part) is in fair agree-ment with the measureagree-ment. Again, we conclude that the truncated 3D dispersion at the surface modifies the 2D dispersion of the bands in the plane, especially near M.
VI. MAGNETIC PHASE
We now investigate whether these differences can mod-ify the electronic properties. As recalled in introduction,
CaCo undergoes an AF transition at 72K in the bulk, where CoAs layers order ferromagnetically. In agree-ment with previous calculations [10], we find that there is a nearly flat band with egcharacter along ΓX/ZX Fig.
6(a), which gives a high n(EF) in Fig. 6(b). With the
ex-perimental magnetic structure, the calculation converges towards M=0.6µB, consistent with the moments known
experimentally [13]. This splits the eg states near EF
by nearly 0.5eV. However, in our ARPES data, we did not observe such a splitting. In Fig. 6(d), we observe no difference for the eg peak at X at 5K or 120K.
Experimentally, we clearly see a small eg pocket at
the zone center [Fig. 6(c)], like in all Co pnictides. It is in good agreement with the calculation renormalized and shifted up by 70 meV (white lines). We further see another eg pocket at X, which is a fingerprint of the
col-lapsed phase (compare FS of CaCo and SrCo in Fig. 4 and 5). Indeed, in the maps of Fig. 2, the intensity at X is due to this pocket and clearly increases for the collapsed phases. This small pocket can be seen in the dispersion images of Fig. 5(b) or (f). However, the band barely touches EF and it is difficult to extract its
-0.2 -0.1 0.0 0.1 Energy (eV) -1.11Z 0.00X 1.11G -0.8 -0.6 -0.4 -0.2 0.0 Energy (eV) -0.4 -0.2 0.0 0.2 0.4
k axis (p/a units)
Z 1.5 1.0 0.5 0.0 Intensity (a.u) -0.8 -0.6 -0.4 -0.2 0.0 Energy (eV) EDC, X, 5K EDC, X, 120K t2g e g -10 -8 -6 -4 -2 0 DOS (a.u.) -1.5 -1.0 -0.5 0.0 0.5 Energy (eV) PM AF up AF down t2g eg (a) (b) (c) (d)
Figure 6. (a) Calculated bulk dispersion for CaCo along ZXΓ. The eg weight is shown by the size of the markers. The cal-culation was neither shifted nor renormalized. The blue line indicates the position of EF found experimentally. (b) Den-sity of states from the previous calculation in the paramag-netic (PM) phase and in the antiferromagparamag-netic (AF) phase. (c) Energy-momentum image around Z of the small dx2−y2
pocket. White lines are bulk calculation at kz=1, renormal-ized by 1.4 and shifted up by 70 meV. (d) EDC spectra at X, showing the density of states for the eg pocket at 5K and 120K.
50 meV. In the calculation, a larger pocket would be ex-pected with a bottom at -0.1eV. However, if we apply the same renormalization of 1.4 and upward shift of 70 meV that we used for dxz/dyz (the blue line in Fig. 6(a-b)
indicates the position of EF after such a shift), this band
moves very close to EF, in better agreement with the
data.
The 70 meV shift strongly reduces the eg weight and
it is likely the reason for the suppression of the magnetic instability. Indeed in calculations for BaCo and SrCo, which do not order magnetically, the essential difference is the position of eg states, which are moved just above
EF. A careful examination of correlations in BaCo,
in-cluding screened exchange beyond the local density ap-proximation, also showed that the DFT calculation is not sufficient to correctly predict the position of this band [33].
VII. DISCUSSION
The electronic structure measured by ARPES in Co pnictides presents two “anomalies” compared to band structure calculations. (i) - a doublet is often measured, where a single line would be expected. The two lines of this doublet correspond quite well to the calculated ex-trema of the kz dispersion. (ii)- shifts as large as 0.2eV
are required to match the bulk calculation in some loca-tions of the BZ (Fig. 4), while, in other parts, no shifts
are required at all.
We notice that both these features are present in a 2 layers slab calculation. Each line splits as a result of the interactions between the two layers, which “replaces” the kz dispersion of bulk systems. The locations in the
re-ciprocal space where band shifts are observed in ARPES are also those where the deviation between the bulk and 2 layers slab calculations are the largest. This is a simple way to identify the places where the hybridization with bands having a strong 3D dispersion - the As pzband for
example - is very large.
When there are deviations between ARPES and bulk properties, it is generally assumed that there is a sur-face problem, for example a sursur-face reconstruction. In ARPES studies of Fe pnictides, it is often argued that LiFeAs will be a “better” system for ARPES than AFe2As2, because its surface is non polar [34]. While this
may be true, we emphasize that the problem we describe here is not due to a modification of the surface, but to an improper 3D dispersion. In fact, we have tried many dif-ferent ways to modify theoretically the surface (through structural relaxation, charge unbalance...), but we could never reproduced the “anomalies” described above. As a consequence, systems like LiFeAs or FeSe, which are quite strongly 3D, could also be affected by such prob-lems.
From a practical point of view, this study gives indi-cations on the situations where caution has to be taken to interpret ARPES data.
(i) - One has to be aware that the 3D dispersion may modify the lineshapes in a way mimicking two different lines. For a complicated electronic structure as that of Fe pnictides, it could be tempting to attribute these lines to two different bands.
(ii) - ARPES is often used to estimate the strength of electronic correlations from band renormalizations. As long as only renormalization of the band structure is used, this estimation should be reliable. However, shifts often have to be applied in Fe pnictides [35], as a result of Fermi Surface “shrinking” [36] or correlation-induced redistribution of carriers between orbitals [37]. In this case, the two quantities are not independent and defin-ing a good renormalization may become a very tricky problem. For example, the bottom of the electron bands in these Co pnictides is around -0.85eV in the unrenor-malized calculation and -0.6eV in the experiment. To match the two values, one could a priori renormalize by ∼1.4 or shift by ∼0.25eV, which have very different phys-ical meaning. The changes in the kF contour as a
func-tion of kz should normally allow to choose the right
so-lution, but, if there are intrinsic deviation between the bulk and calculated 3D dispersion, as we describe here, this may become impossible. One should keep in mind that a renormalization value will be reliable only if the kF vs kz contour has been determined in details.
(iii) - The most interesting consequence may be about the lineshape analysis. Linewidths should describe the lifetime of quasiparticles (QP) if no extrinsic source of
9 broadening is present. In a 3D system, the 3D
disper-sion is often a major source of broadening that usually prevents lifetime analysis. It is clear from Fig. 3 that such analysis will be unfeasible here for a large kz range.
However, we also observe rather clean lineshapes near kz=1. In BaCo, they are even the sharpest lineshapes
(∆ν=0.03Å−1) that we have ever observed in our stud-ies of these systems. It may be that the lifetime of the final state cancels at some points of the BZ, as observed in bulk Ag [38], making them favorable for such analy-sis. In a recent study of lifetimes in Ba(Fe,Co)2As2 and
LiFeAs, we indeed concluded that the 3D brodening at favorable kzpositions was not a major contribution to the
linewidth. A more complete theory of the 3D broadening of these lineshapes would definitely be very interesting.
VIII. CONCLUSION
In this study, we observed how increasing inter-layer in-teractions modify the electronic structure of Co pnictides. We show that ARPES largely follows this evolution, typi-cal fingerprints of the “collapsed” electronic structure are for example observed in CaCo2As2. However, some
de-viations arise from the truncated 3D dispersion at the surface that are already significant for SrCo2As2. They
are summarized in more details in the discussion section. We show that they should be carefully considered to give reliable estimations of the renomalization and/or the QP lifetimes from ARPES. We suggest that comparing cal-culations for the bulk structure and a 2 layers slab gives a good idea of places in the BZ where problems might
appear. These deviations can have significant impact on the electronic properties. In CaCo2As2, they suppress
the magnetic transition observed in the bulk.
One interesting result of this study is that correla-tions do not change through the collapsed transition. In CaFe2As2, a change of correlations is expected at the
collapsed transition [39, 40], because of the disappear-ance of local magnetic moments [41–43]. This is par-tially supported by ARPES data [44–46]. The absence of change observed here is consistent with the idea that local moments have disappeared in Co pnictides, so that no change should be expected at the transition to the collapsed phase from this point of view. We note, never-theless that the “residual” renormalization of 1.4 we find here is not insignificant. In fact, magnetism has not dis-appeared in Co pnictides, but the nature of magnetism has evolved, from a situation dominated by local mo-ments to a much more itinerant picture. The correlation inherent to this state are also interesting. The value we find here is in good agreement with the enhancement of the susceptibillity and of Sommerfeld coeffecient quoted in these systems [8, 9]. As n(EF) depends very
sensi-tively on the position of the eg states compared to EF,
which may be slightly different between the bulk and the surface, more work will be needed to completely charac-terize the evolution of properties of this interesting family of materials.
ACKNOWLEDGMENTS We thank Silke Bier-mann for interesting discussions. This work was sup-ported by the ANR âĂIJPNICTIDESâĂİ.
[1] S. Hufner, Photoelectron Spectroscopy (Springer, Berlin)(1995)
[2] A. Tejeda and D. Malterre, First steps in photoemission: concepts and applications, EDCP Sciences(2017) [3] A. Kreyssig, M. A. Green, Y. Lee, G. D. Samolyuk, P.
Za-jdel, J. W. Lynn, S. L. Bud’ko, M. S. Torikachvili, N. Ni, S. Nandi, J. B. Leão, S. J. Poulton, D. N. Argyriou, B. N. Harmon, R. J. McQueeney, P. C. Canfield, and A. I. Goldman, Phys. Rev. B 78, 184517 (2008)
[4] J. Paglione and R. L. Greene, Nature Phys. 6, 645 (2010) [5] Z. P. Yin, K. Haule, and G. Kotliar, Nature Materials
10, 932 (2011)
[6] L. de’ Medici, G. Giovannetti, and M. Capone, Phys. Rev. Lett. 112, 177001 (2014)
[7] N. Xu, P. Richard, A. van Roekeghem, P. Zhang, H. Miao, W.-L. Zhang, T. Qian, M. Ferrero, A. S. Se-fat, S. Biermann, and H. Ding, Phys. Rev. X 3, 011006 [8] A. S. Sefat, D. J. Singh, R. Jin, M. A. McGuire, B. C.
Sales, and D. Mandrus, Phys. Rev. B 79, 024512 (2009) [9] A. Pandey, D. G. Quirinale, W. Jayasekara, A. Sapkota, M. G. Kim, R. S. Dhaka, Y. Lee, T. W. Heitmann, P. W. Stephens, V. Ogloblichev, A. Kreyssig, R. J. McQueeney, A. I. Goldman, A. Kaminski, B. N. Harmon, Y. Fu-rukawa, and D. C. Johnston, Phys. Rev. B 88, 014526
(2013)
[10] V. K. Anand, R. S. Dhaka, Y. Lee, B. N. Harmon, A. Kaminski, and D. C. Johnston, Phys. Rev. B 89, 214409 (2014)
[11] B. Cheng, B. F. Hu, R. H. Yuan, T. Dong, A. F. Fang, Z. G. Chen, G. Xu, Y. G. Shi, P. Zheng, J. L. Luo, and N. L. Wang, Phys. Rev. B 85, 144426 (2012)
[12] J. J. Ying, Y. J. Yan, A. F. Wang, Z. J. Xiang, P. Cheng, G. J. Ye, and X. H. Chen, Phys. Rev. B 85, 214414 (2012) [13] D. G. Quirinale, V. K. Anand, M. G. Kim, A. Pandey, A. Huq, P. W. Stephens, T. W. Heitmann, A. Kreyssig, R. J. McQueeney, D. C. Johnston, and A. I. Goldman, Phys. Rev. B 88, 174420 (2013)
[14] R. S. Dhaka, Y. Lee, V. K. Anand, D. C. Johnston, B. N. Harmon, and A. Kaminski, Phys. Rev. B 87, 214516 (2013)
[15] F. Rullier-Albenque, D. Colson, A. Forget, and H. Alloul, Phys. Rev. Lett. 103, 057001 (2009)
[16] F. Massee, S. de Jong, Y. Huang, J. Kaas, E. van Heumen, J. B. Goedkoop, and M. S. Golden, Phys. Rev. B 80, 140507 (2009)
[17] S. Jia, A. J. Williams, P. W. Stephens, and R. J. Cava, Phys. Rev. B 80, 165107 (2009)
073705 (2013)
[19] P. Blaha, K. Schwarz, G. Madsen, D. Kvasnicka, and J. Luitz, WIEN2K: An Augmented Plane Wave + Lo-cal Orbitals Program for Calculating Crystal Properties (Karlheinz Schwarz, Techniche Universitat, Wien, Aus-tria)(1999)
[20] V. K. Anand, D. G. Quirinale, Y. Lee, B. N. Harmon, Y. Furukawa, V. V. Ogloblichev, A. Huq, D. L. Aber-nathy, P. W. Stephens, R. J. McQueeney, A. Kreyssig, A. I. Goldman, and D. C. Johnston, Phys. Rev. B 90, 064517 (Aug 2014), http://link.aps.org/doi/10. 1103/PhysRevB.90.064517
[21] D. C. Johnston, Advances in Physics 59, 803 (2010) [22] I. I. Mazin, M. D. Johannes, L. Boeri, K. Koepernik, and
D. J. Singh, Phys. Rev. B 78, 085104 (2008)
[23] V. Brouet, D. LeBoeuf, P.-H. Lin, J. Mansart, A. Taleb-Ibrahimi, P. Le Fevre, F. Bertran, A. Forget, and D. Col-son, Phys. Rev. B 93, 085137 (2016)
[24] V. Brouet, M. Marsi, B. Mansart, A. Nicolaou, A. Taleb-Ibrahimi, P. Le Fèvre, F. Bertran, F. Rullier-Albenque, A. Forget, and D. Colson, Phys. Rev. B 80, 165115 (2009) [25] W. Malaeb, T. Yoshida, A. Fujimori, M. Kubota, K. Ono, K. Kihou, P. M. Shirage, H. Kito, A. Iyo, H. Eisaki, Y. Nakajima, T. Tamegai, and R. Arita, Journal of the Physical Society of Japan 78, 123706 (2009)
[26] V. Brouet, P.-H. Lin, Y. Texier, J. Bobroff, A. Taleb-Ibrahimi, P. Le Fèvre, F. Bertran, M. Casula, P. Werner, S. Biermann, F. Rullier-Albenque, A. Forget, and D. Col-son, Phys. Rev. Lett. 110, 167002 (2013)
[27] V. Strocov, Journal of Electron Spectroscopy and Related Phenomena 130, 65 (2003)
[28] G. Derondeau et al., cond-mat/1606.08977
[29] A. Bansil, M. Lindroos, S. Sahrakorpi, and R. S. Markiewicz, Phys. Rev. B 71, 012503 (Jan 2005), http: //link.aps.org/doi/10.1103/PhysRevB.71.012503 [30] T. Ohta, A. Bostwick, J. L. McChesney, T. Seyller,
K. Horn, and E. Rotenberg, Phys. Rev. Lett. 98, 206802 (2007)
[31] L. Moreschini, S. Moser, A. Ebrahimi, B. Dalla Piazza, K. S. Kim, S. Boseggia, D. F. McMorrow, H. M. Ronnow, J. Chang, D. Prabhakaran, A. T. Boothroyd, E. Roten-berg, A. Bostwick, and M. Grioni, Phys. Rev. B 89, 201114 (2014)
[32] O. Andersen and L. Boeri, Annalen der Physik 523, 8
(2011)
[33] A. van Roekeghem, T. Ayral, J. M. Tomczak, M. Ca-sula, N. Xu, H. Ding, M. Ferrero, O. Parcol-let, H. Jiang, and S. Biermann, Phys. Rev. Lett. 113, 266403 (Dec 2014), http://link.aps.org/doi/10. 1103/PhysRevLett.113.266403
[34] S. V. Borisenko, V. B. Zabolotnyy, D. V. Evtushinsky, T. K. Kim, I. V. Morozov, A. N. Yaresko, A. A. Kordyuk, G. Behr, A. Vasiliev, R. Follath, and B. Büchner, Phys. Rev. Lett. 105, 067002 (2010)
[35] M. Yi, D. H. Lu, J. G. Analytis, J.-H. Chu, S.-K. Mo, R.-H. He, R. G. Moore, X. J. Zhou, G. F. Chen, J. L. Luo, N. L. Wang, Z. Hussain, D. J. Singh, I. R. Fisher, and Z.-X. Shen, Phys. Rev. B 80, 024515 (2009) [36] L. Ortenzi, E. Cappelluti, L. Benfatto, and L. Pietronero,
Phys. Rev. Lett. 103, 046404 (2009)
[37] G. Lee, H. S. Ji, Y. Kim, C. Kim, K. Haule, G. Kotliar, B. Lee, S. Khim, K. H. Kim, K. S. Kim, K.-S. Kim, and J. H. Shim, Phys. Rev. Lett. 109, 177001 (2012) [38] E. D. Hansen, T. Miller, and T.-C. Chiang, Phys. Rev.
Lett. 80, 1766 (1998)
[39] J. Diehl, S. Backes, D. Guterding, H. O. Jeschke, and R. Valentí, Phys. Rev. B 90, 085110 (2014)
[40] A. van Roekeghem, P. Richard, X. Shi, S. Wu, L. Zeng, B. Saparov, Y. Ohtsubo, T. Qian, A. S. Sefat, S. Bier-mann, and H. Ding, Phys. Rev. B 93, 245139 (2016) [41] T. Yildirim, Phys. Rev. Lett. 102, 037003 (2009) [42] L. Ortenzi, H. Gretarsson, S. Kasahara, Y. Matsuda,
T. Shibauchi, K. D. Finkelstein, W. Wu, S. R. Julian, Y.-J. Kim, I. I. Mazin, and L. Boeri, Phys. Rev. Lett. 114, 047001 (2015)
[43] H. Gretarsson, S. R. Saha, T. Drye, J. Paglione, J. Kim, D. Casa, T. Gog, W. Wu, S. R. Julian, and Y.-J. Kim, Phys. Rev. Lett. 110, 047003 (2013)
[44] D. F. Xu, D. W. Shen, J. Jiang, Z. R. Ye, X. Liu, X. H. Niu, H. C. Xu, Y. J. Yan, T. Zhang, B. P. Xie, and D. L. Feng, Phys. Rev. B 90, 214519 (2014)
[45] K. Gofryk, B. Saparov, T. Durakiewicz, A. Chikina, S. Danzenbächer, D. V. Vyalikh, M. J. Graf, and A. S. Sefat, Phys. Rev. Lett. 112, 186401 (2014)
[46] R. S. Dhaka, R. Jiang, S. Ran, S. L. Bud’ko, P. C. Can-field, B. N. Harmon, A. Kaminski, M. Tomić, R. Valentí, and Y. Lee, Phys. Rev. B 89, 020511 (2014)