HAL Id: hal-00330213
https://hal.archives-ouvertes.fr/hal-00330213
Submitted on 19 Aug 2004HAL is a multi-disciplinary open access
archive for the deposit and dissemination of sci-entific research documents, whether they are pub-lished or not. The documents may come from teaching and research institutions in France or abroad, or from public or private research centers.
L’archive ouverte pluridisciplinaire HAL, est destinée au dépôt et à la diffusion de documents scientifiques de niveau recherche, publiés ou non, émanant des établissements d’enseignement et de recherche français ou étrangers, des laboratoires publics ou privés.
Quantifying the structure of the mesopelagic microbial
loop from observed depth profiles of bacteria and
protozoa
T. Tanaka, F. Rassoulzadegan, T. F. Thingstad
To cite this version:
T. Tanaka, F. Rassoulzadegan, T. F. Thingstad. Quantifying the structure of the mesopelagic micro-bial loop from observed depth profiles of bacteria and protozoa. Biogeosciences Discussions, European Geosciences Union, 2004, 1 (1), pp.413-428. �hal-00330213�
BGD
1, 413–428, 2004 Quantifying the structure of the mesopelagic microbial loop T. Tanaka et al. Title Page Abstract Introduction Conclusions References Tables Figures J I J I Back Close Full Screen / EscPrint Version Interactive Discussion © EGU 2004 Biogeosciences Discussions, 1, 413–428, 2004 www.biogeosciences.net/bgd/1/413/ SRef-ID: 1810-6285/bgd/2004-1-413 © European Geosciences Union 2004
Biogeosciences Discussions
Biogeosciences Discussions is the access reviewed discussion forum of Biogeosciences
Quantifying the structure of the
mesopelagic microbial loop from
observed depth profiles of bacteria and
protozoa
T. Tanaka1, F. Rassoulzadegan2, and T. F. Thingstad1
1
Department of Biology, University of Bergen, Jahnebakken 5, PO Box 7800, N-5020 Bergen, Norway
2
LOV-UMR7093, CNRS-UPMC, Station Zoologique, BP 28, F-06234 Villefranche-sur-Mer Cedex, France
Received: 4 August 2004 – Accepted: 16 August 2004 – Published: 19 August 2004 Correspondence to: T. Tanaka (tsuneo.tanaka@bio.uib.no)
BGD
1, 413–428, 2004 Quantifying the structure of the mesopelagic microbial loop T. Tanaka et al. Title Page Abstract Introduction Conclusions References Tables Figures J I J I Back Close Full Screen / EscPrint Version
Interactive Discussion
© EGU 2004
Abstract
It is widely recognized that organic carbon exported to the ocean aphotic layer is sig-nificantly consumed by heterotrophic organisms such as bacteria and zooplankton in the mesopelagic layer. However, very little is known for the trophic link between bacteria and zooplankton or the structure of the microbial loop in this layer. In the
5
northwestern Mediterranean, recent studies have shown that viruses, bacteria, het-erotrophic nanoflagellates, and ciliates distribute down to 2000 m with group-specific depth-dependent decreases, and that bacterial production decreases with depth down to 1000 m. Here we show that such data can be analyzed using a simple steady-state food chain model to quantify the carbon flow from bacteria to zooplankton over
10
the mesopelagic layer. The model indicates that a similar amount of bacterial produc-tion is allocated to viruses and heterotrophic nanoflagellates, and that heterotrophic nanoflagellates are the important remineralizers.
1. Introduction
The current view of ocean biogeochemistry is that organic carbon (OC) exported from
15
the euphotic layer is mostly remineralized in the mesopelagic layer, otherwise con-sidered buried in the ocean interior (e.g. Fowler and Knauer, 1986). While sinking particulate organic carbon (POC) is consumed by particle-attached bacteria and detri-tivorous zooplankton during the sinking process (Martin et al., 1987; Cho and Azam, 1988; Smith et al., 1992), dissolved organic carbon (DOC), which is exported from the
20
euphotic layer or released from sinking POC, is accessible only for free-living bacteria. However the trophic link between bacteria and zooplankton, i.e. the structure of the microbial loop, is unknown in the mesopelagic layer, by which our understanding of biological process in global material cycling may be limited.
Recent studies in the northwestern Mediterranean reported vertical and seasonal
25
BGD
1, 413–428, 2004 Quantifying the structure of the mesopelagic microbial loop T. Tanaka et al. Title Page Abstract Introduction Conclusions References Tables Figures J I J I Back Close Full Screen / EscPrint Version
Interactive Discussion
© EGU 2004 ciliates, and of bacterial production, in the aphotic layers down to 2000 m (Harris et al.,
2001; Tamburini et al., 2002; Tanaka and Rassoulzadegan, 2002; Weinbauer et al., 2003). In addition, Tanaka and Rassoulzadegan (2004) showed that bacteria at 500 m were controlled by both bottom-up (substrate) and top-down (predation) controls. In this paper, we analyzed carbon flow in the mesopelagic microbial loop-zooplankton, using
5
the published data combined with a simple steady-state food chain model. Results indicated that (1) a similar amount of bacterial production is allocated to viruses and HNF, and (2) HNF are the important remineralizers.
2. Study site
The data used in this study were obtained at the French-JGOFS time-series station
10
DYFAMED (43◦25.2’ N, 07◦51.8’ E; 2350 m max. depth) in the northwestern Mediter-ranean, and have been published in Tanaka and Rassoulzadegan (2002, 2004, see also for detailed description of materials and methods). This site is likely indepen-dent of anthropogenic and natural dust inputs (Marty et al., 1994; Ridame and Guieu, 2002) and receives very weak lateral flows (B ´ethoux et al., 1988; Andersen and Prieur,
15
2000). Water temperature is always ca. 13◦C below seasonal thermocline down to 2000 m during the stratified period and in whole water column during the mixing pe-riod, and no permanent pycnocline exists (Marty, 2003). This site shows contrasted seasonal patterns of water column structure and biological production in the upper layer (Marty and Chiav ´erini, 2002), with the consequence that sinking POC fluxes are
20
higher from January to June and smaller from July to December (Miquel et al., 1993, 1994) and that DOC is accumulated in the surface mixed layer during the stratified period and exported during the winter mixing period (Copin-Mont ´egut and Avril, 1993; Avril, 2002). Annual fluxes of sinking POC and exported DOC in the mesopelagic layer (100–1000 m) are estimated to be 0.4 mol C m−2yr−1 and 1–1.5 mol C m−2yr−1,
25
respectively (Copin-Mont ´egut and Avril, 1993; Miquel et al., 1994; Avril, 2002). These fluxes correspond to 75% and ∼100% of those from the euphotic layer. It is reported
BGD
1, 413–428, 2004 Quantifying the structure of the mesopelagic microbial loop T. Tanaka et al. Title Page Abstract Introduction Conclusions References Tables Figures J I J I Back Close Full Screen / EscPrint Version
Interactive Discussion
© EGU 2004 that sinking POC was consumed by detritivorous zooplankton (Carroll et al., 1998) and
particle-attached bacteria (Turley and Stutt, 2000) during the sinking process at the same site.
3. Model
Our knowledge of the structure and function of the microbial loop is quite limited for the
5
aphotic layer due to the scarcity of direct measurements of biomass and rate process. If one assumes a food-web structure for carbon flow, and combines this with the as-sumption of an approximate steady-state over the depths (Thingstad, 2000), the data on biomass of microbial heterotrophs and bacterial production can be used to estimate carbon flows between microbial components and zooplankton over the mesopelagic
10
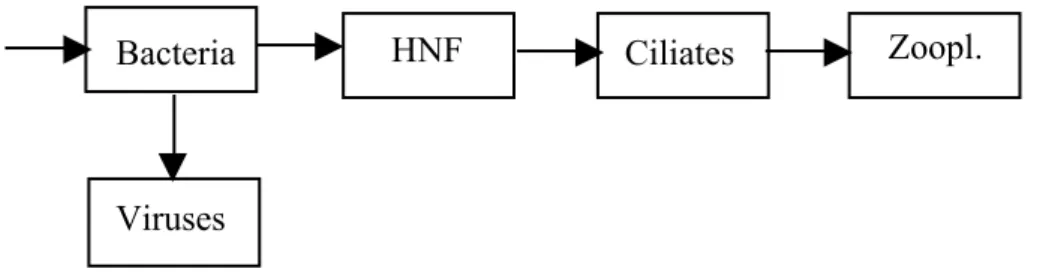
layer (hereafter 110-1000 m). Under the assumption that the mesopelagic food web consists of viruses, bacteria, HNF, ciliates and zooplankton and that only bacteria have two loss processes (viruses and HNF) (Fig. 1), the trophic interaction can be described as:
BP = αHB∗H∗+ δBVB∗ (1)
15
YHαHB∗H∗= αCH∗C∗ (2)
YCαCH∗C∗ = δCZC∗, (3)
where the asterisk denotes steady state biomass (nmol C L−1) of predator and prey,
V , B, H, C and Z are viruses, bacteria, HNF, ciliates and zooplankton, respectively, BP is bacterial production (nmol C L−1d−1), α is predator’s clearance rate for prey
20
(L nmol C−1d−1), Y is predator’s yield on prey (no dimension), and δ is prey’s mortality rate (d−1) by viruses or predators. Arranging the Eqs. (1) and (2) gives:
BGD
1, 413–428, 2004 Quantifying the structure of the mesopelagic microbial loop T. Tanaka et al. Title Page Abstract Introduction Conclusions References Tables Figures J I J I Back Close Full Screen / EscPrint Version
Interactive Discussion
© EGU 2004
BP/C∗ = (αC/ YH)H∗+ (αCδBV)/(YHαH). (5)
Because the biomass of HNF and ciliates was not measured simultaneously with bacte-rial production (see Tanaka and Rassoulzadegan, 2002, 2004), we used annual mean values in biomass of bacteria, HNF and ciliates obtained in 1999–2000, but the depths correspond to those of bacterial production. Two parameters (αH, δBV) are directly
5
estimated by linear regression analysis with the data of H∗ and BP/B∗. The other parameters (αC, YH and YC) can be derived by different ways, depending on the as-sumptions made. Growth yield is considered variable with environmental conditions, and no data are available for the mesopelagic layer. Clearance rate is assumed to be a function of prey density. It is reported that clearance rate of bacterivorous HNF was
10
∼10 times greater than that of ciliates preying on nanoplankton (Fenchel, 1987). Un-der the assumption of αC = 0.1 αH, YH is then calculated by αC/YH or (αCδBV)/(YHαH), which were 0.012 and 0.009, respectively. Since the estimated YH values were quite similar, the former, which was derived from αC/YH, was used for estimating carbon flow in the microbial loop. YC was arbitrarily assumed equal to YH.
15
4. Results and discussion
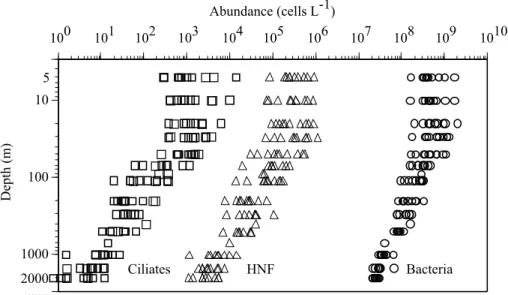
Tanaka and Rassoulzadegan (2002) demonstrated that bacteria, HNF and ciliates were always detected throughout the water column during an annual study, with one, two and three orders of magnitude of depth-dependent decrease (5–2000 m), respectively, at the DYFAMED site (Fig. 2). Under the assumption that the food web was close to
20
steady state, this suggests that rate processes (i.e. growth and loss rates) are less variable for bacteria than for protozoa over the depth, and that the density-dependent predator-prey relationship becomes less coupled between three microbial heterotrophs with increasing depth down to 2000 m. While bacterial biomass and production showed depth-dependent decreases over the 110–1000 m layer, both parameters were
season-25
BGD
1, 413–428, 2004 Quantifying the structure of the mesopelagic microbial loop T. Tanaka et al. Title Page Abstract Introduction Conclusions References Tables Figures J I J I Back Close Full Screen / EscPrint Version
Interactive Discussion
© EGU 2004 OC supply to these depths (Tanaka and Rassoulzadegan, 2004). In the 1000–2000 m,
bacterial production showed seasonal variations but did not decrease with depth (Tam-burini et al., 2002).
Controlling factors on bacteria at 500 m were assessed by the comparison in chang-ing rate of bacterial abundance in different treatments, which was designed to identify
5
effects of predation and substrate availability on bacteria at 500 m, and to evaluate rela-tive difference in substrate availability between 500 m and 110 m (Fig. 3). Results sug-gest that bacteria at 500 m were controlled by both bottom-up and top-down controls and that the availability of dissolved organic matter was seasonally variable (Tanaka and Rassoulzadegan, 2004).
10
Significant linear relationships in both Eqs. (4) and (5) suggest that the assumed food-web structure approximates the microbial loop in the mesopelagic layer of the study site (Table 1; Fig. 4). HNF growth efficiency on bacteria was estimated to be 1%. Since the study site is likely semi-enclosed, annual bacterial growth efficiency has been estimated to be 19–39% for the same layer by using the data of OC flux and
15
annual bacterial production (Tanaka and Rassoulzadegan, 2004). This suggests that the bacterial ingestion by HNF functions as remineralization rather than energy transfer to higher trophic levels.
A back-calculation, using the estimated parameters and the annual mean of inte-grated biomass of bacteria, HNF and ciliates, suggests a similar role of viruses and
20
HNF in bacterial mortality in the mesopelagic layer (Table 2). Note that effects of viruses and HNF on bacteria are functionally to produce dissolved and particulate or-ganic matter, respectively, in the food web. Of total bacterial production that is equiva-lent to bacterial mortality, 0.4% and 0.004% are transferred to ciliates and zooplankton, respectively, which suggests a distance of the trophic link between “viruses, bacteria
25
and HNF” and “ciliates and zooplankton”. This however may be contrary to a recent suggestion that virus-induced mortality of bacteria is low (3–6%) in the mesopelagic and bathypelagic layers at the same site (Weinbauer et al., 2003). Because the empirical model to estimate virus-induced mortality of bacteria is not derived from
BGD
1, 413–428, 2004 Quantifying the structure of the mesopelagic microbial loop T. Tanaka et al. Title Page Abstract Introduction Conclusions References Tables Figures J I J I Back Close Full Screen / EscPrint Version
Interactive Discussion
© EGU 2004 mesopelagic and bathypelagic layers and data on virus-induced mortality of bacteria in
the ocean aphotic layer have been limited to this study site (Weinbauer et al., 2003), it may be difficult to validate these estimates at present. Our estimate of clearance rate of HNF for bacteria is within the range reported for the upper 500 m of the East Sea (Cho et al., 2000), by using the mean cell volume of HNF 20 µm3 cell−1 (Tanaka
5
and Rassoulzadegan, 2002) and a carbon to volume conversion factor 183 fg C µm−3 (Caron et al., 1995). Conceptually, specialized zooplankton (e.g. appendicularians and salps) that can consume particles as small as bacteria may reconcile this discrepancy by making a shortcut between the microbial loop and zooplankton. The observation of pellet fluxes at 500 m at the study site suggested the presence of mesopelagic
ap-10
pendicularians (Carroll et al., 1998), which were dominant in the macrozooplankton community around 400 m near the study site (Laval et al., 1989). Due to the paucity of data on zooplankton distribution and feeding, effect of such specialized zooplankton on our model remains to be open. Precision in our estimates of carbon flow may have suffered from the relatively low precision in microscope-based biomass estimates.
15
Increase in number of trophic levels generally results in less efficient material transfer from lower to higher trophic levels or more efficient remineralization in the food web, which has been addressed as a function of the microbial loop in the euphotic layer (Azam et al., 1983). This context may be reflected in the mesopelagic layer, where all microbial heterotrophs and zooplankton exist and constitute the mesopelagic food
20
web. Our model analysis suggests that half of the mesopelagic bacterial production goes to “DOC-bacteria-viruses” circuit and the rest is “DOC-microbial loop” circuit with HNF as the important remineralizers. This may challenge to the current view of ocean biogeochemistry with bacteria as the principal remineralizers in the mesopelagic layer (Cho and Azam, 1988; Smith et al., 1992). Our results thus urge to measure not only
25
bacterial but also other biological rate processes in this layer.
Acknowledgements. This work was supported by the EC through contracts
EVK3-CT-1999-00009 (Cycling of Phosphorus in the Mediterranean) and EVK3-CT-2001-00049 (Detection and Analysis of Nutrient Limitation) and by the EU through contract HPRI-1999-CT-00056 (Bergen
BGD
1, 413–428, 2004 Quantifying the structure of the mesopelagic microbial loop T. Tanaka et al. Title Page Abstract Introduction Conclusions References Tables Figures J I J I Back Close Full Screen / EscPrint Version
Interactive Discussion
© EGU 2004 Marine Food Chain Research Infrastructure).
References
Andersen, V. and Prieur, L.: One-month study in the open NW Mediterranean Sea (DYNAPROC experiment, May 1995): overview of the hydrobiogeochemical structures and effects of wind events, Deep-Sea I, 47, 397–422, 2000.
5
Avril, B.: DOC dynamics in the northwestern Mediterranean Sea (DYFAMED site), Deep-Sea II, 49, 2163–2182, 2002.
Azam, F., Fenchel, T., Field, J. G., Gray, J. S., Meyer-Reil, L. A., and Thingstad, T. F.: The ecological role of water-column microbes in the sea, Mar. Ecol. Prog. Ser., 10, 257–263, 1983.
10
B ´ethoux, J.-P., Prieur, L., and Bong, J. H.: The Ligurian current off the French Riviera, Oceanol. Acta, 9, 59–67, 1988.
Caron, D. A., Dam, H. G., Kremer, P., Lessard, E. J., Madin, L. P., Malone, T. C., Napp, J. M., Peele, E. R., Roman, M. R., and Youngbluth, M. J.: The contribution of microorganisms to particulate carbon and nitrogen in surface waters of the Sargasso Sea near Bermuda,
15
Deep-Sea I, 42, 943–972, 1995.
Carroll, M. L., Miquel, J.-C., and Fowler, S. W.: Seasonal patterns and depth-specific trends of zooplankton fecal pellet fluxes in the Northwestern Mediterranean Sea, Deep-Sea I, 45, 1303–1318, 1998.
Cho, B. C. and Azam, F.: Major role of bacteria in biogeochemical fluxes in the ocean’s interior,
20
Nature, 332, 441–443, 1988.
Cho, B. C., Na, S. C., and Choi, D. H.: Active ingestion of fluorescently labeled bacteria by mesopelagic heterotrophic nanoflagellates in the East Sea, Korea, Mar. Ecol. Prog. Ser., 206, 23–32, 2000.
Copin-Mont ´egut, G. and Avril, B.: Vertical distribution and temporal variations of dissolved
25
organic carbon in the North-Western mediterranean Sea, Deep-Sea I, 40, 1963–1972, 1993. Fenchel, T.: Ecology of protozoa, Science Tech. Inc., USA, 1987.
Fowler, S. W. and Knauer, G. A.: Role of large particles in the transport of elements and organic compounds through the oceanic water column, Prog. Ocean., 16, 147–194, 1986.
BGD
1, 413–428, 2004 Quantifying the structure of the mesopelagic microbial loop T. Tanaka et al. Title Page Abstract Introduction Conclusions References Tables Figures J I J I Back Close Full Screen / EscPrint Version
Interactive Discussion
© EGU 2004 Harris, J. R. W., Stutt, E. D., and Turley, C. M.: Carbon flux in the northwest Mediterranean
estimated from microbial production, Deep-Sea II, 48, 2631–2644, 2001.
Laval, P., Braconnot, J. C., Carre, C., Goy, J., Morand, P., and Mills, C. E.: Small-scale distribu-tion of macroplankton and micronekton in the Ligurian Sea (Mediterranean Sea) as observed from the manned submersible Cyana, J. Plank. Res., 11, 665–685, 1989.
5
Martin, J. H., Knauer, G. A., Karl, D. M., and Broenkow, W. W.: VERTEX: carbon cycling in the northeast Pacific, Deep-Sea, 34, 267–285, 1987.
Marty, J.-C.: DYFAMED Observation Service, http://www.obs-vlfr.fr/jgofs2/sodyf/home/htm, 2003.
Marty, J.-C. and Chiav ´erini, J.: Seasonal and interannual variations in phytoplankton production
10
at DYFAMED time-series station, Northwestern Mediterranean Sea, Deep-Sea II, 49, 2017– 2030, 2002.
Marty, J.-C., Nicolas, E., Miquel, J.-C., and Fowler, S. W.: Particulate fluxes of organic com-pounds and their relationship to zooplankton fecal pellets in the northwestern Mediterranean Sea, Mar. Chem., 46, 387–405, 1994.
15
Miquel, J.-C., Fowler, S. W., and La Rosa, J.: Vertical fluxes in the Ligurian Sea, Ann. Inst. Oc ´eanogr, Paris, 69, 107–110, 1993.
Miquel, J.-C., Fowler, S. W., La Rosa, J., and Buat-Menard, P.: Dynamics of the downward flux of particles and carbon in the open northwestern Mediterranean Sea, Deep-Sea I, 41, 243–261, 1994.
20
Ridame, C. and Guieu, C.: Saharan input of phosphate to the oligotrophic water of the open western Mediterranean Sea., Limn. Ocean., 47, 856–869, 2002.
Smith, D. C., Simon, M., Alldredge, A. L., and Azam, F.: Intense hydrolytic enzyme activity on marine aggregates and implications for rapid particle dissolution, Nature, 359, 139–142, 1992.
25
Tamburini, C., Garcin, J., Ragot, M., and Bianchi, A.: Biopolymer hydrolysis and bacterial production under ambient hydrostatic pressure through a 2000 m water column in the NW Mediterranean, Deep-Sea II, 49, 2109–2123, 2002.
Tanaka, T. and Rassoulzadegan, F.: Full-depth profile (0-2000 m) of bacteria, heterotrophic nanoflagellates and ciliates in the NW Mediterranean Sea: Vertical partitioning of microbial
30
trophic structures, Deep-Sea II, 49, 2093–2107, 2002.
Tanaka, T. and Rassoulzadegan, F.: Vertical and seasonal variations of bacterial abundance and production in the mesopelagic layer of the NW Mediterranean Sea: Bottom-up and
top-BGD
1, 413–428, 2004 Quantifying the structure of the mesopelagic microbial loop T. Tanaka et al. Title Page Abstract Introduction Conclusions References Tables Figures J I J I Back Close Full Screen / EscPrint Version
Interactive Discussion
© EGU 2004 down controls, Deep-Sea I, 51, 531–544, 2004.
Thingstad, T. F.: Microbial Ecology of the Oceans, edited by Kirchman, D. L., Wiley-Liss, Inc., New York, 229–260, 2000.
Turley, C. M. and Stutt, E. D.: Depth-related cell-specific bacterial leucine incorporation rates on particles and its biogeochemical significance in the Northwest Mediterranean, Limn. Ocean.,
5
45, 419–425, 2000.
Weinbauer, M. G., Brettar, I., and H ¨ofle, M. G.: Lysogeny and virus-induced mortality of bac-terioplankton in surface, deep, and anoxic marine waters, Limn. Ocean., 48, 1457–1465, 2003.
BGD
1, 413–428, 2004 Quantifying the structure of the mesopelagic microbial loop T. Tanaka et al. Title Page Abstract Introduction Conclusions References Tables Figures J I J I Back Close Full Screen / EscPrint Version
Interactive Discussion
© EGU 2004 Table 1. Estimated parameter values in Eqs. (4) and (5) based on a linear regression model I.
Variables Model Slope Y-int. n r2 F Significance
(X , Y ) (±SE) (±SE) F -test
H∗, BP/B∗ Y = αHX 0.0007 0.0069 29 0.469 24.5 <0.0001
+δBV ±0.0001 ±0.002
H∗, BP/C∗ Y = (αC/ YH)X 0.0061 0.0733 29 0.291 11.5 0.0021 +(αCδBV)/(YHαH) ±0.0018 ±0.0244
BGD
1, 413–428, 2004 Quantifying the structure of the mesopelagic microbial loop T. Tanaka et al. Title Page Abstract Introduction Conclusions References Tables Figures J I J I Back Close Full Screen / EscPrint Version
Interactive Discussion
© EGU 2004 Table 2. Carbon flow estimates for the mesopelagic layer (110–1000 m), which are based on
the estimated parameters of αH (0.0007), αC (0.00007), δBV (0.0069). Data on annual mean
biomass are from Tanaka and Rassoulzadegan (2002).
Mean biomass (mmol C m−2) Carbon flow (mmol C m−2yr−1)
Bacteria 130 327 (to viruses)
249 (to HNF)
HNF 6.7 2.2 (to ciliates)
BGD
1, 413–428, 2004 Quantifying the structure of the mesopelagic microbial loop T. Tanaka et al. Title Page Abstract Introduction Conclusions References Tables Figures J I J I Back Close Full Screen / EscPrint Version
Interactive Discussion
© EGU 2004
Viruses
Bacteria HNF Ciliates Zoopl.
Fig. 1. Flow structure of the model used for analyzing carbon flow in the mesopelagic layer of the northwestern Mediterranean. The model consists of viruses, bacteria, HNF (heterotrophic nanoflagellates), ciliates, and zooplankton.
BGD
1, 413–428, 2004 Quantifying the structure of the mesopelagic microbial loop T. Tanaka et al. Title Page Abstract Introduction Conclusions References Tables Figures J I J I Back Close Full Screen / EscPrint Version Interactive Discussion © EGU 2004 G G G G G G G G G G G G G G G G G G G G G G G G G G G G G G G G G G 3000 1000 100 10 3 1x100 1x101 1x10² 1x10³ 1x10⁴ 1x10⁵ 1x10⁶ 1x10⁷ 1x10⁸ 1x10⁹ 1x10¹⁰ Abundance (cells L-1) Depth (m) Bacteria HNF Ciliates 101 102 103 104 105 106 107 108 109 1010 100 2000 5
Fig. 2. Distributions of bacteria, heterotrophic nanoflagellates (HNF) and ciliates. Measure-ments were monthly done at 13 depths between 5 and 2000 m from May 1999 to March 2000 at the DYFAMED site (Redrawn from Tanaka and Rassoulzadegan, 2002). Circles, triangles and squares denote bacteria, HNF and ciliates, respectively.
BGD
1, 413–428, 2004 Quantifying the structure of the mesopelagic microbial loop T. Tanaka et al. Title Page Abstract Introduction Conclusions References Tables Figures J I J I Back Close Full Screen / EscPrint Version
Interactive Discussion
© EGU 2004
Jan Jun Jul Sep Oct
0.00 0.05 0.10 0.15 0.20 0.25 0.30 0.35 0.40 (a) (b) (c) (d)
Changing rate (±SE: d
-1 )
2002
(b,c)<d (b,d)<c a<b<(c,d) (a,b)<(c,d) a<b<(c,d)
*
*
Fig. 3. Effects of substrate availability and predation on mesopelagic bacteria. Measurements were done from January to October 2002 at the DYFAMED site (Data from Tanaka and Ras-soulzadegan, 2004). Four different treatments were prepared, and bacterial abundance was measured at the start and the end of the incubation from separate triplicate bottles. Shown are mean changing rates ± standard errors (day−1) of bacterial abundance. Bars denote whole water from 500 m(a), filtrate of 0.8 µm from 500 m (b), filtrate of 0.8 µm from 500 m diluted by filtrate of 0.2 µm from 500 m(c), and filtrate of 0.8 µm from 500 m diluted by filtrate of 0.2 µm from 110 m(d). Changing rates were calculated by semi-log linear regression (n=6 except Treatment b in January, n=5). Comparison between treatments were shown (p <0.05, t-test). Asterisks denote insignificant changes of bacterial abundance during the incubation (p >0.05,
BGD
1, 413–428, 2004 Quantifying the structure of the mesopelagic microbial loop T. Tanaka et al. Title Page Abstract Introduction Conclusions References Tables Figures J I J I Back Close Full Screen / EscPrint Version Interactive Discussion © EGU 2004 0 0.01 0.02 0.03 0.04 0 5 10 15 20 25 0 0.01 0.02 0.03 0.04 0 5 10 15 20 25 0 0.1 0.2 0.3 0.4 0.5 0 5 10 15 20 25 0 0.1 0.2 0.3 0.4 0.5 0 5 10 15 20 25 BP / B * (d -1 ) H* (nmol-C L-1) BP /C * (d -1 ) H* (nmol-C L-1) (a) (b)
Fig. 4. Rate estimations by fitting the model-derived equations. (a): Relationship between
BP/B∗ and H∗, (b): Relationship between BP/C∗ and H∗ in the 110–1000 m. The lines were calculated with a linear regression model I.