HAL Id: insu-02399950
https://hal-insu.archives-ouvertes.fr/insu-02399950
Submitted on 9 Dec 2019
HAL is a multi-disciplinary open access
archive for the deposit and dissemination of
sci-entific research documents, whether they are
pub-lished or not. The documents may come from
teaching and research institutions in France or
abroad, or from public or private research centers.
L’archive ouverte pluridisciplinaire HAL, est
destinée au dépôt et à la diffusion de documents
scientifiques de niveau recherche, publiés ou non,
émanant des établissements d’enseignement et de
recherche français ou étrangers, des laboratoires
publics ou privés.
Are Paleomagnetic Records From U-Channels
Appropriate for Studies of Reversals and Excursions?
Édouard Philippe, Jean-Pierre Valet, Guillaume St-Onge, Anojh Thevarasan
To cite this version:
Édouard Philippe, Jean-Pierre Valet, Guillaume St-Onge, Anojh Thevarasan. Are Paleomagnetic
Records From U-Channels Appropriate for Studies of Reversals and Excursions?. Geochemistry,
Geophysics, Geosystems, AGU and the Geochemical Society, 2018, �10.1029/2018GC007803�.
�insu-02399950�
Are Paleomagnetic Records From U-Channels Appropriate
for Studies of Reversals and Excursions?
Édouard G. H. Philippe1,2 , Jean-Pierre Valet1 , Guillaume St-Onge2 , and Anojh Thevarasan1
1
Institut de Physique du Globe de Paris, Paris, France,2Institut des sciences de la mer de Rimouski, Canada Research Chair in Marine Geology and GEOTOP, Université du Québec à Rimouski, Rimouski, Quebec, Canada
Abstract
Sampling of sediment cores using plastic U-channels has made possible the acquisition of detailed records of paleomagnetic secular variation, geomagnetic polarity, environmental magnetic studies, and relative paleointensity over the past several million years. U-channel measurements provide the great advantage of rapid measurements of long sediment cores, but the signal resolution is attenuated by the response function of the magnetometer sensors, which therefore restrains the recovery of rapid and large-amplitudefield changes. Here we focus on the suitability of the dynamics of reversals and excursions derived from U-channel measurements. We compare successive individual paleomagnetic directions of 1.5 cm × 1.5 cm × 1.5 cm cubic discrete samples with those of a 1.5-m equivalent U-channel sample train obtained by placing the samples adjacent to each other. We use varying excursion and transition lengths and generate transitional directions that resemble those of the most detailed paleomagnetic records. Excursions with opposite polarity directions recorded over less than 7.5 cm are barely detected in U-channelmeasurements. Regarding reversals, U-channel measurements smooth the signal of low-resolution records and generate artificial transitional directions. Despite producing misleading similarities with the overall structure of transition records, longer transitional intervals fail also to reproduce the complexity offield changes. Finally, we test the convolution of magnetization by different response functions. The simulation reveals that even small response function changes can generate significant differences in results.
1. Introduction
Measurement of 1.5-m-long sedimentary samples enclosed in plastic tubes called U-channels was proposed by Tauxe et al. (1983) as an alternative to the traditional, time-consuming procedure based on single samples extracted from the sediment. Continuous sampling of 10 m of sediment provides at least 450 discrete sam-ples that are measured and stepwise demagnetized separately. This technique typically requires a 2-month laboratory effort, while it can take only a few days to measure the equivalent U-channel samples (Nagy & Valet, 1993; Weeks et al., 1993). U-channel measurements therefore have become a successful and standard practice, and U-channel facilities have now been developed in many laboratories. The most direct impact has been the proliferation of long and detailed geomagneticfield records and environmental magnetic studies with special interest for obtaining relative paleointensity records over time scales that range from several thousands to millions of years depending on sediment deposition rate (e.g., Barletta et al., 2010; Channell et al., 2000; Channell & Kleiven, 2000; Kissel et al., 1998; Macrì et al., 2010; Mazaud et al., 2012; Meynadier et al., 1992; Roberts et al., 1997; Stoner et al., 2000; Valet, 2003; Valet & Meynadier, 1993).
During measurement, the U-channel is placed on an automated horizontal sample holder and is translated in and out of the sensing region of a cryogenic magnetometer that is equipped with a set of three orthogonal pickup coils. The resolution of U-channel records depends on the accumulation rate of the sediment but also on the width of the magnetometer response function. The response function width depends essentially on the distance between the coils and sediment and is constrained by the diameter of the room temperature access of the instrument. Most laboratories with U-channel magnetometer systems are equipped with a 4.2-cm-diameter access, which is optimal for standard 4-cm2square cross-section U-channels. The resolution of the record then depends on the length of sediment detected by the pickup coils.
2. Measurement Resolution
To our knowledge, all cryogenic magnetometers adapted for U-channel measurements were built by 2G Enterprises, but the length of the response functions differs between different instruments and therefore
RESEARCH ARTICLE
10.1029/2018GC007803 Special Section:
Magnetism in the Geosciences - Advances and Perspectives
Key Points:
• U-channel measurements fail to detect rapid excursions, except in the presence of high deposition rates • U-channel fails to duplicate the
original features of thefield changes during polarity transitions • Discrete samples of small size are
thus required to fully reconstruct the detailed dynamics of reversals and excursions Supporting Information: • Supporting Information S1 • Data Set S1 Correspondence to: É. G. H. Philippe, edouard.philippe01@gmail.com Citation:
Philippe, É. G. H., Valet, J.-P., St-Onge, G., & Thevarasan, A. (2018). Are
paleomagnetic records from U-channels appropriate for studies of reversals and excursions? Geochemistry, Geophysics,
Geosystems, 19, 4130–4142. https://doi.
org/10.1029/2018GC007803 Received 2 JUL 2018 Accepted 27 AUG 2018
Accepted article online 9 OCT 2018 Published online 5 NOV 2018
©2018. The Authors.
This is an open access article under the terms of the Creative Commons Attribution-NonCommercial-NoDerivs License, which permits use and distri-bution in any medium, provided the original work is properly cited, the use is non-commercial and no modifications or adaptations are made.
between laboratories. In Figure 1, we show examples of response curves for various generations of magnetometers. We excluded the large 15–20 cm half-width response curves inherent to the 760-R series that was designed for whole-core measurements. The optimal resolution was provided by the 755-R series equipped with the so-called high-resolution (HR) sensors with a half-window width as short as 4.5–5.5 cm (Figure 1a; Guyodo et al., 2002; Nagy & Valet, 1993; Weeks et al., 1993) that were initially installed in a few laboratories. The next generation of 2G magnetometers introduced direct current (d.c.) superconducting quantum interference devices (SQUIDs) and was characterized by relatively homogeneous responses with half-widths of 6–7 cm (Figures 1b and 1c). The most recent liquid helium-free magnetometers are characterized by larger smoothing windows of the order of 7–8 cm (Figure 1d). Note that these values can change between magnetometers of the same generation depending on various technical constraints. Summarizing, except the HR coils of thefirst series, the models presently available on the market do not have half-width response functions shorter than 6–7 cm (Figures 1a–1c). The magnetometer used for the present measurements was the 2G Enterprises Model 755-R located in the shielded room of the Institut de Physique du Globe de Paris. It is equipped with d.c. SQUIDs with a half-width response function of 7 cm (Figure 1b). We are aware that this is not the optimal available resolution and therefore results presented here are also discussed for smaller window widths.
For the optimal 5.5-cm half-width response functions of thefirst 755-R series, each sediment magnetization measurement is integrated over an equivalent interval. Consequently, variations with characteristic times longer than several kyr are recorded by U-channel measurements of sediments with deposition rates between 2 and 5 cm/kyr that make up a significant part of the global database. This is the reason why dipolar variations dominate published relative paleointensity records. If we deal with deposition rates between 10 and 15 cm/kyr the resolution is evidently improved (Roberts & Winklhofer, 2004). Only a few long-term studies (e.g., Channell, 2017; Channell & Lehman, 1997; Laj et al., 2006; Verosub et al., 2001) have relied on
Figure 1. Response functions of model 755-R (2G Enterprises) magnetometers with different sets of sensing coils. The type and location of the magnetometers are mentioned in each panel. IPGP (Institut de Physique du Globe de Paris), LSCE (Laboratoire des Sciences du Climat et de l’Environnement), and ISMER (Institut des sciences de la mer de Rimouski).
10.1029/2018GC007803
Geochemistry, Geophysics, Geosystems
U-channel measurements of such rapidly deposited sediments to investigate detailed variations associated with geomagnetic excursions and reversals.
The question is to determine the extent to which detailed U-channel records properly document rapidfield changes during these periods that are also characterized by low dipolefield intensities. In the present study, we investigate this aspect by using a direct approach that relies on testing the coherency of paleomagnetic individual sediment slice records with the corresponding synthetic U-channel record obtained when the discrete samples are placed side by side in a continuous manner. Alternatively, we also calculate the convo-lution induced by the response curve of the magnetometer on the single sample train and test the results against actual U-channel measurements.
3. Experimental Protocol
The direct way to compare U-channel measurements is to place a succession of sediment slices adjacent to each other to mimic a 150-cm-long U-channel. A similar approach has been used previously for various pur-poses (Guyodo et al., 2002; Nagy & Valet, 1993; Roberts et al., 1996; Weeks et al., 1993). In the present case, we used 1.5-cm-wide plastic cubes to optimize the resolution of discrete samples. Each cube wasfilled with mod-eling clay to which we added a small amount of pure magnetite powder. Care was taken tofill each cube with a similar amount of magnetite that was weighed so that each specimen has similar magnetic properties. Owing to the difficulties inherent to detrital remanent magnetization acquisition in the laboratory for a large number of specimens, we produced an anhysteretic remanent magnetization (ARM) in the synthetic sedi-ment samples. The ARM was imparted by inserting each cube within the demagnetization coil of a Schönstedt demagnetizer (60 mT) alternatingfield (a.f.) surrounded by an external coil to produce a d.c. field (50μT). Each specimen was inserted within a home-made sample holder that can be oriented in the vertical and horizontal planes so that samples can record anyfield direction and, thus, simulate reversed, intermedi-ate, and normal polarities. Magnetization intensity was controlled by the concentration of magnetite in the modeling clay. We created eight different magnetite concentrations in more than 700 cubes, which allowed us to generate any combination of intensity variations.
The ARM for each cube was measured in the same conditions within the same 2G Enterprises magnetometer system used for the U-channel measurements. As afirst step, the discrete samples were measured separately and spaced from each other by a distance of 30 cm on the sample holder to avoid any interaction. The sam-ples were then positioned adjacent to each other along the magnetometer sample tray to mimic a U-channel and were measured again. Data treatment consisted of comparing the directions and intensities obtained from single samples before and after they were measured as a synthetic U-channel.
Magnetization stability was tested by monitoring the evolution of magnetic directions and intensities of the samples over a 1-day period. The procedure is analogous to a viscosity test and was aimed at checking that the magnetization did not change between successive measurements that were never separated by more than 3 hr. The magnetization remained largely unchanged except for a few variations (Figure 2a) that were likely due to a small viscous component. The sample magnetization is an ARM with coercivity as high as 60 mT, so some samples were demagnetized by a.f. The results (Figure 2b) confirm the overall stability of the magnetization that is removed at the same peak a.f. as used for ARM acquisition.
4. Simulation of Geomagnetic Excursions
4.1. Previous StudiesIntermediate or reverse polarity directions that correspond to geomagnetic excursions have been rarely detected in sedimentary records with accumulation rates lower than 5–6 cm/kyr, but the intensity minimum that accompanies these rapid events is frequently present. The reason for this is that directional changes occur over a short time period and in the presence of weakfields. In such conditions, even minor smoothing linked to magnetization acquisition in addition to resolution limits imposed by the sediment accumulation rate erases the imprint of reverse polarity or intermediate directions.
Nagy and Valet (1993) and Weeks et al. (1993) compared single sample results with U-channel measurements and reported that a few abrupt directional changes were smoothed out by pass-through measurements with high-resolution coils. Roberts et al. (1996) compared long-core measurements of Ocean Drilling Program core
halves and the equivalent set of discrete samples in a cube train. The magnetometer used for the experiments was the 2G Enterprises Model 760-R with a more than 15-cm-wide half-window response curve that is the consequence of the large diameter access needed for whole core measurements. It is, thus, considerably larger than the magnetometers mentioned above for U-channel measurements. Roberts et al. (1996) reported directional artifacts that were introduced by convolution of the intensity changes, especially for regions characterized by large intensity changes.
Roberts and Winklhofer (2004) simulated the effects of postdepositional remanent magnetization (pDRM) lock-in on a high-frequency geomagnetic signal characterized by a succession of excursions with a 4.5-cm half-width response function for single samples and for U-channel measurements. For a pDRM lock-in depth of 10 cm where 95% of the signal is locked within 5 cm, a deposition rate of 8 cm/kyr is required to detect a
Figure 2. (a) Evolution of the remanent magnetization (intensity, declination, and inclination) of the synthetic samples as a function of time. The maximum duration of the experiments (3 hr) is indicated by the orange zone. (b) Alternatingfield demagnetization diagrams of the anhysteretic remanent magnetization (ARM) imparted to the synthetic samples. The solid symbols correspond to projections onto the horizontal plane, while the open symbols represent projections onto the vertical plane.
10.1029/2018GC007803
Geochemistry, Geophysics, Geosystems
1-kyr-long event using 2-cm-length single samples. The results from the study of Roberts and Winklhofer (2004) involved that smoothing associated with enhance acquisition and U-channel measurement makes it ideal to study sediments deposited at rates>10 cm/kyr in order to detect the presence of excursions. In stat-ing this, however, they did not consider whether U-channel measurements introduce directional artifacts. Here we used a similar approach, but with a 7-cm half-width response curve (Figure 1b). Before investigating the suitability of transitional directions derived from U-channel measurements, we focused on the detection of excursions. We did not consider smoothing effects due to pDRM acquisition.
4.2. Artifacts Induced by U-Channel Measurements
Following the previous studies mentioned above, we placed plastic cubes with opposite polarities next to each other. Normal (and reverse) polarity directions were given a declination close to 0° (and 180°, respec-tively) and inclinations of 45° (and 45°, respectively). We deliberately did not produce any intermediate direction in order to be in the most favorable situation, that is, a complete 180° directional change, to detect the event. A progressive intensity drop with magnetization intensity equal to 10% of the original normal polarityfield was also generated for the excursion.
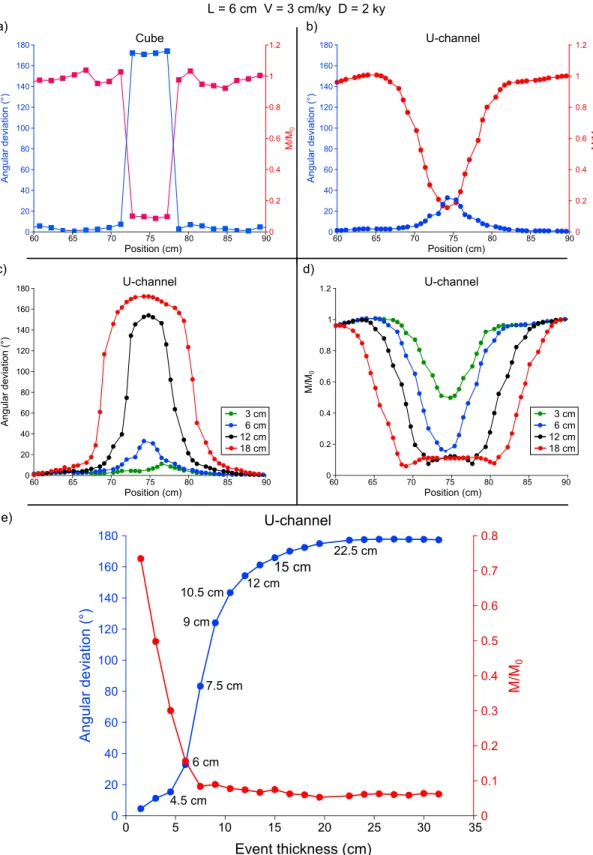
Afirst example involves four magnetized 1.5-cm reverse polarity cubes inserted within strongly magnetized specimens with the opposite polarity to simulate a 6-cm-long excursion (Figures 3a and 3b). The U-channel measurements (Figure 3b) fail to reproduce the magnetization changes of the discrete samples (Figure 3a). The directions do not deviate by more than 35° from the initial polarity direction in the U-channel measure-ments even though the magnetization intensity changed considerably. The U-channel intensity minimum is much longer and incorporates a succession of intermediate intensity values. If these results are interpreted in terms of duration based on sediment deposition rate, they indicate that 1- or 2-kyr-long events are difficult to detect with U-channel measurements for sediment accumulation rates lower than 6 cm/kyr or 3 cm/kyr, respectively, and that detection of 2-kyr-long events require deposition rates above 10 cm/kyr. Similar con-clusions were reached by Roberts and Winklhofer (2004). However, the data also illustrate that events can be identified easily with sedimentation rates above 10 cm/yr for 2-kyr-long events.
Results for increasing excursion lengths are plotted in Figures 3c and 3d, which demonstrate the evolution of angular deviation and magnetization intensity changes with measurement position. No significant polarity change is detected for intervals up to at least 6 cm, and in all cases the U-channel measurements generate artificial directions and magnetization intensities. The situation is summarized by changes in the angular deviation (defined as the angular change from the original normal polarity direction) in each U-channel record as a function of excursion length (Figure 3e). Large-scale deviations are not detected in U-channel measurements for excursion intervals lower than 7.5 cm. Above this value, U-channel measurements docu-ment the excursion, but the directional amplitude of the changes is considerably lower than the real changes. The opposite polarity is only detected for intervals larger than 15 cm. In contrast, a significant intensity mini-mum is observed for excursions as short as 3 cm in the U-channel records. This characteristic is consistent with the fact that transitional or reverse polarity directions are rarely detected in sedimentary excursion records, but significant intensity minima are observed frequently.
In summary, with the 7-cm half-width of the response curve used for our experiments, U-channel measure-ments do not reveal significant polarity changes for events recorded over <7.5 cm intervals and they contain no evidence for a 180° directional change for intervals<20–25 cm. These results indicate that sedimentation rates>20 cm/kyr are necessary to provide evidence for a 1-kyr-long event, while values >10 cm/kyr would be required for a 2-kyr event. Our most significant finding concerns the systematic lack of fidelity with respect to detecting the original magnetic directions of individual cubes.
In our cube-train measurements, no transitional direction was induced in the cube magnetizations, so virtual geomagnetic poles (VGP) lie to the north before and after simulated excursions and to the south during excursions. All simulated records, including the most detailed ones, are characterized by artificial transitional directions with VGPs that are absent from the initial data. In Figure 4, we plot VGP paths derived from measurements of excursions simulated over 4.5- and 24-cm intervals. The VGP trajectories define the transit to the opposite polarity and the return to the initial state. During these two phases the VGPs are almost antipodal and progress through a large loop. The length of the excursion controls the amplitude of the loop. For increasing excursion lengths, the VGPs reach higher southern latitudes
Figure 3. (a) Angular variation (blue squares) and intensity (red squares) changes measured for individual cubes for a 6-cm-long excursion simulated by four rever-sely magnetized cubes. (b) Same as (a) for the equivalent U-channel. (c) Angular deviation for excursions recorded over increasing length intervals. (d) Same as (c) for magnetization intensity. (e) Maximum angular deviation from the original polarity and minimum moment variation measured in U-channel samples as a function of excursion length. The maximum angular deviation does not reach 180° for events smaller than 20 cm.
10.1029/2018GC007803
Geochemistry, Geophysics, Geosystems
and therefore produce a larger loop. Recurring loops with different amplitudes and similar VGP paths can, thus, be artificially generated by U-channel measurements.
In thisfirst experiment, we did not use cubes with transitional magnetic directions. However, the smearing of weakly magnetized transitional directions by U-channel measurements raises questions about intermedi-ate or transitional directions even in high-resolution records. This aspect is investigated below from simulations of polarity transitions.
5. Simulations of Polarity Transitions
Following the same approach, we investigated the evolution of transi-tional directions induced in different sample sets sandwiched between intervals with normal and reverse polarity. We generated successive tran-sitional directions that are similar to the most detailed volcanic records of reversals, keeping in mind that these changes may be distinct from reality because the magnetization of each 1.5-cm cube represents a time-averaged direction that integrates a significant field history, including pos-sibly rapid changes. However, this is not critical for investigating the effect of U-channel measurements on successions of rapidly changing directions during transitional periods and determining whether suitable transitional directions can be obtained.
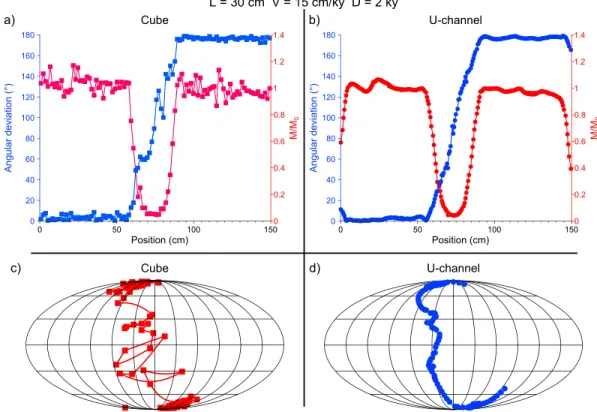
From the above results, we emphasize the importance of a long transition interval to recover transitional directions that are not generated artificially by signal smearing. We simulated reverse to normal polarity reversals (the sense of the transition is not critical). Thefirst reversal was defined by eight transitional cubes (for a 12-cm transitional interval) with angular devia-tions more than 10° away from full polarity (Figure 5a) and identified also the intermediate VGP positions. Associatedfield intensity variations involve 12 cubes over an 18-cm interval. Smoothing generated by the U-channel has changed the intermediate directions (Figure 5b) and their latitudinal distribution with evident consequences for the limits of the reversal. The initial VGP path (Figure 5c) is characterized by two deviations across a large range of longitudes that resemble features found in paleomagnetic records. VGPs for the U-channel (Figure 5d) fail to duplicate the short-period changes and evolve smoothly and gradually in latitude between the two polarities. The apparent duration (or interval length) of the transition is unchanged. A second reversal was simulated over a 30-cm-long interval of sediment with 20 transitional directions (Figure 6a). It represents a 2-kyr transition duration recorded by sediment with a 15 cm/kyr accumulation rate (or a 3-kyr transition at 10 cm/kyr). As in the previous case, successive transitional directions (Figure 6b) are heavily smoothed and their number has increased. The initial VGPs (Figure 6c) have a smoother variation than in the previous case, with two small amplitude loops in the southern hemisphere and a cluster at mid-northern latitudes. The VGP path derived from the U-channel measurements is confined strictly in longitude with no VGP looping and no significant VGP clustering (Figure 6d). Again, the apparent transition duration is unchanged. In both situations, smearing of transitional directions by U-channel measurements generates smooth VGP paths. The degree of longitudinal confinement evidently depends on the initial VGP configura-tion. U-channel measurements of transitions with poorly scattered VGPs in longitude produce a smooth and regular transit between the two polarities that resemble a simple dipole rotation, while they tend to reduce the longitudinal confinement of transitions with scattered VGPs, but still have a smooth change in latitude. In all cases, the apparent complexity offield changes has been smoothed in the U-channel records.
The third simulation applies to a reversal recorded over the same interval thickness, but with a more complex dynamical structure (Figure 7a). The directions of the cubes are characterized by rapid and large amplitude changes that have completely disappeared in the U-channel record (Figure 7b). The transitional VGPs (Figure 7c) cross a wide range of longitudes and are characterized by large latitudinal variations that can be described roughly by two latitudinal loopings referred to as loops 1 and 2 in Figure 7c. Atfirst glance, the U-channel results (Figure 7d) bear some similarities to the initial record, but in reality, they do not
Figure 4. Artificial VGP paths derived from U-channel measurements for (a) 4.5-cm and (b) 12-cm events.
Figure 6. Same as Figure 5 for a 30-cm simulated transitional interval recorded in sediment with 15 cm/kyr deposition rate and a 2-kyr transition.
Figure 5. Simulations of a 2-kyr polarity transition recorded over an 18-cm stratigraphic interval. (a) Angular deviation (blue squares) and magnetization intensity (red squares) of individual cubes as a function of their position in the simulated sequence, and (b) angular deviation (blue dots) and magnetization intensity (red dots) derived from the corresponding U-channel. (c) Initial VGP path derived from the single samples, and (d) VGP path obtained from the U-channel measurements.
10.1029/2018GC007803
Geochemistry, Geophysics, Geosystems
reproduce any major feature of the transition and they alter its dynamical pattern. Overall, the VGP trajectory has a regular transit from south to north followed by a large loop that could be erroneously interpreted as a rebound. Neither the amplitude of the changes nor the overall geometry of the path is reproduced. U-channel measurements fail to recover thefirst loop, and they amplify considerably the second loop. They have also artificially generated VGP clusters (e.g., at 30°N and within the VGP loop).
Based on the results in Figure 6, an optimistic view would be to consider that provided that sedimentation rates are high enough, U-channel measurements can discriminate between simple transitional paths and more complex dynamic transitional behavior, but any interpretation remains uncertain and dependent on the amount of smoothing, which is generated by the geometry of the SQUIDs. It is worth noting that U-channel measurements amplify the distortion generated by changes in deposition rates during the short transitional period.
6. U-Channel Measurements and Signal Convolution
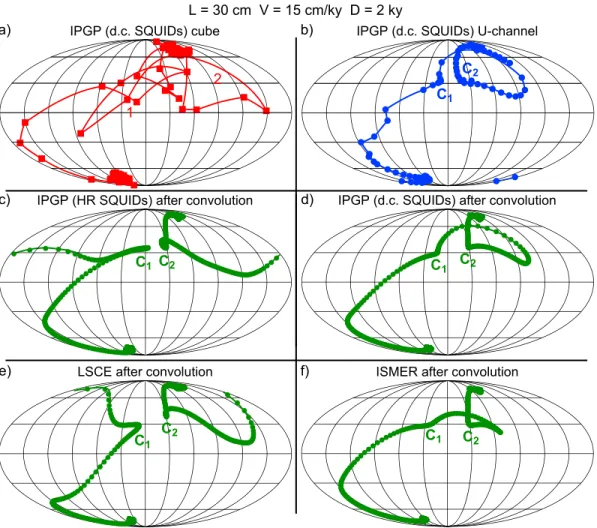
Each magnetometer has characteristics that yield different measurement resolutions, so it is useful to inves-tigate further the sensitivity to the width of the response curve. In this test, we compare whether transitional directions derived from U-channel measurements are identical to those obtained after convolution of the cube train by the magnetometer response. We simply use each response curve to simulate the measurement of the equivalent U-channel. We used the discrete sample measurements of the third simulation, which is characterized by the most complex dynamical transition structure (Figures 7 and 8a). We added a 20-cm-long void on both sides of the mimicked U-channel and convolved the measured data by the response function of the magnetometer (Figure 1b). The U-channel measurements and convolution results are compared in Figures 8 and 9 in terms of intensity, angular variation, and VGPs, respectively.
The good (expected) coherence between the measured and simulated U-channels indicates that this simple convolution has captured the required details and therefore that it can be used further to test the impact of other response curves. Wefirst used the response functions of the HR magnetometer at Institut de Physique du Globe de Paris (IPGP) with a 5.5-cm half-width response curve (Figure 1a), then the d.c. SQUIDs of the later
IPGP (Figure 1b) and Laboratoire des Sciences du Climat et de l’Environnement (LSCE) magnetometers (Figure 1c), which have similar 6- to 7-cm half-width response curves, andfinally the response of the liquid helium free magnetometer from the Institut des sciences de la mer de Rimouski (ISMER) paleomagnetic laboratory (Figure 1d). As expected, the resolution of the HR SQUIDs provides the best agreement with the original samples but fails to reproduce the complexity of the directional changes (Figure 8c). The
Figure 8. Convolution of measurements for successive discrete samples recording a 2-kyr polarity transition over 30 cm. (a) Angular deviation (blue dots) and magnetization intensity (red dots) for measurements of individual 1.5-cm
samples. (b) Angular deviation (blue dots) and magnetization intensity (red dots) obtained from U-channel measurements. (c) Angular deviation (green) and magnetization intensity (purple) after convolution of discrete sample measurements by the Institut de Physique du Globe de Paris (IPGP) high-resolution (HR) superconducting quantum interference device (SQUID) response functions. (d) Same as (c) with the IPGP direct current SQUIDs. (e) Same as (c) using the Laboratoire des Sciences du Climat et de l’Environnement (LSCE) magnetometer response. (f) Same as (c) using the Institut des sciences de la mer de Rimouski (ISMER) magnetometer response.
10.1029/2018GC007803
Geochemistry, Geophysics, Geosystems
convolution distorted the VGP path and considerably amplified the c2 loop (Figure 9c). The half-width
response curve of the HR IPGP magnetometer is 1.5 cm smaller than with the d.c. SQUIDs at IPGP and 0.5 cm for LSCE, while the ISMER (Rimouski) magnetometer has a 1-cm wider response (Figure 1). Our simulation reveals that intensity (Figures 8d and 8e) changes are similar for both kind of magnetometers, but that angular deviations (Figures 8d and 8e) and VGP trajectories (Figures 9d and 9e) obtained for IPGP and LSCE benefit from the 1-cm difference in resolution (Figure 9e). Notwithstanding this, both magnetometers fail to reproduce the complexity of the original single sample measurements. Therefore, despite improvement of resolution, the major characteristics of transitional changes are not correctly reproduced by U-channel measurements. As expected, the measurements obtained with the larger response of the ISMER magnetometer amplified the smearing (Figure 8f) and generated a much smoother VGP trajectory (Figure 9f). The loop has almost disappeared and looks more like a small hairpin, while the existence of VGP clusters is less obvious.
Overall, our simulations illustrate the sensitivity of U-channel transitional directions to the width of the magnetometer response function. Differences, as small as 1 cm in the half-width of the response function, can generate different VGP paths with different configurations that are also different from the original field and, thus, lead to erroneous interpretations in terms offield behavior. Deconvolution of U-channel data is commonly considered as an alternative way to recover original directions and to improve resolution. Several deconvolution techniques have been proposed with various levels of success (Constable & Parker, 1991; Guyodo et al., 1999; Jackson et al., 2010; Oda & Shibuya, 1996; Oda & Xuan, 2014; Weeks et al., 1993). The difficulty inherent to this approach is to restore variations with durations that are shorter than the win-dow length of the magnetometer sensors but also to account for rapid changes in magnetization intensity.
The most recent and successful method by Xuan and Oda (2015) proposes a statistical correction that addresses these aspects.
7. Conclusions
We have investigated whether U-channel samples are appropriate for recovering high-fidelity records of large-amplitude rapid geomagneticfield changes that are typical of excursions or polarity reversals. We used a direct approach that consisted of testing successive measurements of individual 1.5-cm synthetic samples against measurements of equivalent synthetic U-channels constructed by placing the same samples in a con-tinuous row using a 2G Enterprises magnetometer with 7-cm half-length response function. This experiment was exempt from disturbances due to sampling and did not take into account any additional smearing induced by magnetization acquisition. We simulated excursions (including at least four directions with oppo-site polarity) over increasingly thicker intervals. Events shorter than 7.5 cm were not revealed by U-channel measurements. Longer events were detected, but the amplitude of variations was attenuated considerably. We found that a 20-cm excursional interval was required to detect paleomagnetic directions with opposite polarity. The remanence intensity for U-channel measurements decreases within excursion thickness, which could be used to indicate the presence of an excursion, but lack of detection of directional changes prevents interpretation of directional behavior. When available, VGP paths describe a large looping during excursions that result from smoothing of preexcursional and postexcursional directions.
Reversal simulations also failed to reproduce the original VGPs, even for long transitional intervals. Signal smoothing inherent to U-channel measurements tends to constrain VGPs in longitude and generates artificial directions. VGP loops are not reproduced, while a few geographically nearby VGPs can give the appearance of a VGP cluster.
Results of U-channel measurements are consistent with a simple convolution of a discrete sample train by the IPGP magnetometer response curves. We tested further the impact of other magnetometer response curves and found that transitional directions and therefore the pattern of the transition are sensitive to the widths of the response curves, even for differences as small as 1 cm.
Even though U-channel measurements are appropriate and extremely useful for documenting long-term dipolarfield features and provide excellent records of field behavior (magnetostratigraphy, relative paleoin-tensity) and pertinent environmental studies, for sedimentation rates lower than ~10 cm/kyr, they fail to detect directional changes inherent to excursions or polarity transitions. Smearing of directions with opposite and/or intermediate polarities generate directional artifacts that are not representative of the magnetic vector. High-frequencyfield changes are recovered better in high deposition rate records, but transitional directions are also affected by smoothing.
Finally, we demonstrate that U-channel measurements fail to duplicate rapidly changingfield features during polarity transitions, even for rapid deposition rates and are therefore not appropriate for reversal studies. This is exemplified by dissimilarities between single samples and U-channel directions reported in detailed high-resolution records of excursions (Channell, 2017; Laj et al., 2006) and reversals (Channell et al., 2017). We do not deny that there are situations with high sedimentation rates where U-channel measurements do not appear to provide large distortions. However, there is no other way to assess the reliability of the directional changes than by comparing the u-channel results with single sample measurements. We infer that the U-channel measurement technique is not appropriate for extracting significant information about detailed field morphologies during reversals and excursions and that such records should be systematically accompa-nied by discrete samples provided that the resolution of the record is sufficient and tested against the decon-volution of U-channel measurements (Channell, 2017).
References
Barletta, F., St-Onge, G., Stoner, J. S., Lajeunesse, P., & Locat, J. (2010). A high-resolution Holocene paleomagnetic secular variation and relative paleointensity stack from eastern Canada. Earth and Planetary Science Letters, 298(1–2), 162–174. https://doi.org/10.1016/j. epsl.2010.07.038
Channell, J. E. T. (2017). Complexity in Matuyama–Brunhes polarity transitions from North Atlantic IODP/ODP deep-sea sites. Earth and
Planetary Science Letters, 467, 43–56. https://doi.org/10.1016/j.epsl.2017.03.019
Channell, J. E. T., & Kleiven, H. F. (2000). Geomagnetic palaeointensities and astrochronological ages for the Matuyama–Brunhes boundary and the boundaries of the Jaramillo Subchron: Palaeomagnetic and oxygen isotope records from ODP Site 983. Philosophical Transactions
10.1029/2018GC007803
Geochemistry, Geophysics, Geosystems
Acknowledgments
This study was supported by the ERC Advanced grant GA 339899-EDIFICE under the ERC’s 7th Framework Program (FP7-IDEAS-ERC) and by an NSERC Discovery Grant. The authors acknowledge Fernando Lopes and Nabil Garoum for contributions at various stages of the study. We are deeply grateful to Andrew Roberts for his exhaustive review and for considerably improving the manuscript and acknowledge an anonymous reviewer. Data are available in the supporting information. This is IPGP contribution number 3984.
of the Royal Society of London A: Mathematical, Physical and Engineering Sciences, 358(1768), 1027–1047. https://doi.org/10.1098/ rsta.2000.0572
Channell, J. E. T., & Lehman, B. (1997). The last two geomagnetic polarity reversals recorded in high-deposition-rate sediment drifts. Nature,
389(6652), 712–715. https://doi.org/10.1038/39570
Channell, J. E. T., Stoner, J. S., Hodell, D. A., & Charles, C. D. (2000). Geomagnetic paleointensity for the last 100 kyr from the sub-antarctic South Atlantic: A tool for inter-hemispheric correlation. Earth and Planetary Science Letters, 175(1–2), 145–160. https://doi.org/10.1016/ S0012-821X(99)00285-X
Channell, J. E. T., Vázquez Riveiros, N., Gottschalk, J., Waelbroeck, C., & Skinner, L. C. (2017). Age and duration of Laschamp and Iceland Basin geomagnetic excursions in the South Atlantic Ocean. Quaternary Science Reviews, 167, 1–13. https://doi.org/10.1016/j.
quascirev.2017.04.020
Constable, C., & Parker, R. (1991). Deconvolution of long-core palaeomagnetic measurements—Spline therapy for the linear problem.
Geophysical Journal International, 104(3), 453–468. https://doi.org/10.1111/j.1365-246X.1991.tb05693.x
Guyodo, Y., Channell, J. E. T., & Thomas, R. G. (2002). Deconvolution of u-channel paleomagnetic data near geomagnetic reversals and short events. Geophysical Research Letters, 29(17), 1845. https://doi.org/10.1029/2002GL014927
Guyodo, Y., Richter, C., & Valet, J.-P. (1999). Paleointensity record from Pleistocene sediments (1.4–0 Ma) off the California Margin. Journal of
Geophysical Research, 104, 22,953–22,964. https://doi.org/10.1029/1999JB900163
Jackson, M., Bowles, J. A., Lascu, I., & Solheid, P. (2010). Deconvolution of u channel magnetometer data: Experimental study of accuracy, resolution, and stability of different inversion methods. Geochemistry, Geophysics, Geosystems, 11, Q07Y10. https://doi.org/10.1029/ 2009GC002991
Kissel, C., Laj, C., Mazaud, A., & Dokken, T. (1998). Magnetic anisotropy and environmental changes in two sedimentary cores from the Norwegian Sea and the North Atlantic. Earth and Planetary Science Letters, 164(3-4), 617–626. https://doi.org/10.1016/S0040-1951(98)00223-6
Laj, C., Kissel, C., & Roberts, A. P. (2006). Geomagneticfield behavior during the Iceland Basin and Laschamp geomagnetic excursions: A simple transitionalfield geometry? Geochemistry, Geophysics, Geosystems, 7, Q03004. https://doi.org/10.1029/2005GC001122 Macrì, P., Sagnotti, L., Dinarès-Turell, J., & Caburlotto, A. (2010). Relative geomagnetic paleointensity of the Brunhes Chron and the
Matuyama–Brunhes precursor as recorded in sediment core from Wilkes Land Basin (Antarctica). Physics of the Earth and Planetary
Interiors, 179(1-2), 72–86. https://doi.org/10.1016/j.pepi.2009.12.002
Mazaud, A., Channell, J. E. T., & Stoner, J. S. (2012). Relative paleointensity and environmental magnetism since 1.2 Ma at IODP site U1305 (Eirik Drift, NW Atlantic). Earth and Planetary Science Letters, 357-358, 137–144. https://doi.org/10.1016/j.epsl.2012.09.037
Meynadier, L., Valet, J.-P., Weeks, R., Shackleton, N. J., & Hagee, V. L. (1992). Relative geomagnetic intensity of thefield during the last 140 ka.
Earth and Planetary Science Letters, 114(1), 39–57. https://doi.org/10.1016/0012-821X(92)90150-T
Nagy, E. A., & Valet, J.-P. (1993). New advances for paleomagnetic studies of sediment cores using U-channels. Geophysical Research Letters,
20, 671–674. https://doi.org/10.1029/93GL00213
Oda, H., & Shibuya, H. (1996). Deconvolution of long-core paleomagnetic data of Ocean Drilling Program by Akaike’s Bayesian Information Criterion minimization. Journal of Geophysical Research, 101, 2815–2834. https://doi.org/10.1029/95JB02811
Oda, H., & Xuan, C. (2014). Deconvolution of continuous paleomagnetic data from pass-through magnetometer: A new algorithm to restore geomagnetic and environmental information based on realistic optimization. Geochemistry, Geophysics, Geosystems, 15, 3907–3924. https://doi.org/10.1002/2014GC005513
Roberts, A. P., Lehman, B., Weeks, R. J., Verosub, K. L., & Laj, C. (1997). Relative paleointensity of the geomagneticfield over the last 200,000 years from ODP Sites 883 and 884, North Pacific Ocean. Earth and Planetary Science Letters, 152(1-4), 11–23. https://doi.org/10.1016/S0012-821X(97)00132-5
Roberts, A. P., Stoner, J. S., & Richter, C. (1996). Coring-induced magnetic overprints and limitations of the long-core paleomagnetic mea-surement technique: some observations from Leg 160, Eastern Mediterranean Sea. In K.-C. Emeis, A. H. F. Robertson, & C. Richter (Eds.),
Proceedings of ODP initial reports (Vol. 160, pp. 497–505). College Station, TX: Texas A & M University Ocean Drilling Program. https://doi.
org/10.2973/odp.proc.ir.160.115.1996
Roberts, A. P., & Winklhofer, M. (2004). Why are geomagnetic excursions not always recorded in sediments? Constraints from post-depositional remanent magnetization lock-in modelling. Earth and Planetary Science Letters, 227(3-4), 345–359. https://doi.org/10.1016/j. epsl.2004.07.040
Stoner, J. S., Channell, J. E. T., Hillaire-Marcel, C., & Kissel, C. (2000). Geomagnetic paleointensity and environmental record from Labrador Sea core MD95-2024: Global marine sediment and ice core chronostratigraphy for the last 110 kyr. Earth and Planetary Science Letters,
183(1–2), 161–177. https://doi.org/10.1016/S0012-821X(00)00272-7
Tauxe, L., LaBrecque, J. L., Dodson, R., & Fuller, M. (1983). U-channels-a new technique for paleomagnetic analysis of hydraulic piston cores.
Eos, Transactions American Geophysical Union, 64, 219.
Valet, J.-P. (2003). Time variations in geomagnetic intensity. Reviews of Geophysics, 41(1), 1004. https://doi.org/10.1029/2001RG000104 Valet, J.-P., & Meynadier, L. (1993). Geomagneticfield intensity and reversals during the past four million years. Nature, 366(6452), 234–238.
https://doi.org/10.1038/366234a0
Verosub, K. L., Harris, A. H., & Karlin, R. (2001). Ultrahigh-resolution paleomagnetic record from ODP Leg 169S, Saanich Inlet, British Columbia: Initial results. Marine Geology, 174(1-4), 79–93. https://doi.org/10.1016/S0025-3227(00)00143-2
Weeks, R., Laj, C., Endignoux, L., Fuller, M., Roberts, A., Manganne, R., et al. (1993). Improvements in long-core measurement techniques: Applications in palaeomagnetism and palaeoceanography. Geophysical Journal International, 114(3), 651–662. https://doi.org/10.1111/ j.1365-246X.1993.tb06994.x
Xuan, C., & Oda, H. (2015). UDECON: Deconvolution optimization software for restoring high-resolution records from pass-through paleo-magnetic measurements. Earth, Planets and Space, 67(1), 183. https://doi.org/10.1186/s40623-015-0332-x