HAL Id: hal-01576176
https://hal.archives-ouvertes.fr/hal-01576176
Submitted on 23 Aug 2017
HAL is a multi-disciplinary open access
archive for the deposit and dissemination of
sci-entific research documents, whether they are
pub-lished or not. The documents may come from
teaching and research institutions in France or
abroad, or from public or private research centers.
L’archive ouverte pluridisciplinaire HAL, est
destinée au dépôt et à la diffusion de documents
scientifiques de niveau recherche, publiés ou non,
émanant des établissements d’enseignement et de
recherche français ou étrangers, des laboratoires
publics ou privés.
EFFECT OF VISCOSITY MODIFYING AGENT ON
THE MECHANICAL AND TRANSPORT
PROPERTIES OF HEMP AND RAPESEED STRAW
CONCRETE
J Sheridan, M Sonebi, S Taylor, S Amziane
To cite this version:
J Sheridan, M Sonebi, S Taylor, S Amziane. EFFECT OF VISCOSITY MODIFYING AGENT ON
THE MECHANICAL AND TRANSPORT PROPERTIES OF HEMP AND RAPESEED STRAW
CONCRETE. ICBBM 2017, 2nd International Conference On Bio-Based Building Materials, Sofiane
AMZIANE And Mohammed SONEBI, Jun 2017, Clermont Ferrand, France. �hal-01576176�
EcoGRAFI
2nd International Conference on Bio-based Building Materials & 1st Conference on ECOlogical valorisation of GRAnular and FIbrous materials
June 21th - 23th 2017 Clermont-Ferrand, France
EFFECT OF VISCOSITY MODIFYING AGENT ON THE MECHANICAL AND
TRANSPORT PROPERTIES OF HEMP AND RAPESEED STRAW CONCRETE
J. Sheridan¹, M. Sonebi¹, S. Taylor¹, S. Amziane²
1Queen’s University Belfast, School of Natural and Built Environment, Belfast, BT7 1NN, UK 2 Université Blaise Pascal, Institut Pascal, Polytech Clermont-Ferrand, 63174, Aubière, France
*Corresponding author; e-mail: jsheridan08@qub.ac.uk
Abstract
In recent decades sustainability, carbon footprint and pollution have become significant issues on a global scale. It is widely recognised that the carbon footprint of the construction industry is something that can be reduced and this has led to sustainable materials being used more and more widely to meet emissions targets. Two of these materials are hemp concrete and rapeseed-straw concrete which are bio-composites made of the bio-aggregate, water and a lime binder; in this investigation Vicat prompt natural cement (PNC). The addition of a viscosity modifying agent (VMA) is studied for its effect on the mechanical and water transport properties. It was found that the use of a VMA was very effective at countering the two biggest weaknesses of bio-aggregates as it reduced the capillarity absorption of the concrete significantly and also greatly increased the compressive strength and modulus of elasticity of the material.
Keywords:
Hemp; Rapeseed straw; viscosity modifying agent; mechanical properties; capillarity.
1 INTRODUCTION
Due to the significant issues of sustainability, carbon footprint and pollution that have recently come to the forefront of global public concern sustainable materials and a greener future have become a large focus for research. It is widely recognised that the human race needs to revise its stance on these key sustainability issues as areas such as industry, construction and energy and transport cause degradation to the environment and the planet as a whole.
Energy use in the building sector can and needs to also be reduced and has led to a focus in research on more sustainable building materials. Energy use in buildings can be greatly reduced simply by better insulation. It is reported by the European Environment Agency [2015] that 26.8% of all energy used in the European Union in 2013 was in households, slightly ahead of industry (25.06%) and behind only transport (31.58%). It is reported by the UK Department of Energy & Climate Change that in the UK the amount of household energy that is used in heating space amounted to 62% [Palmer & Cooper 2013]. Thus, based on these figures roughly 16.6% of all energy used in the UK was in the heating of space which is a number that has potential to be lowered in the form of new and better building materials that are both sustainable to produce and also provide excellent levels of insulation.
One such material that achieves both of these things is bio-based building materials [Amziane & Sonebi 2016].
This concrete is most commonly made up of chopped hemp shiv, a lime binder and water. However, this paper also presents an alternative novel aggregate for comparison in the form of chopped rapeseed straw. Hemp is already well known to be a great insulator [Amziane & Sonebi 2015]. And initial testing indicates that the same can be said for rapeseed concrete [Laidoudi et al. 2015].
The two biggest issues with bio-based building materials have been identified as their mechanical performance and their water absorption. Although the water absorption of the material is linked to its porosity which bestows advantageous properties such as good thermal and acoustic performance, thus the challenge is to try and overcome the problem of water absorption whilst also maintaining the advantageous properties of the material’s porosity. Problems around the interfacial transition zone (ITZ) have been identified as the primary reason for these weaknesses as the binder and the aggregate do not interact well. This was investigated by Sedan [2008] who highlighted the ability of pectin to ‘trap’ and form complex molecules with calcium (Ca ions. Another factor in the complex ITZ of this material is again the aggregate’s ability to absorb large amounts of water. The high porosity of this material allows the aggregate to transport water using capillary forces and also diffuse it. Leading to a hydration deficit [Nozahic & Amziane 2012] which, combined with the trapping of calcium ions results in
ICBBM 2017 retarding of the binder hydration; thus limiting the
mechanical performance of the material.
Numerous techniques have been studied in the literature to try and overcome this problem; primarily involving surface treatment or coating of the aggregate or additive addition into the mixture. Khazma [2008] investigated using sucrose as an aggregate pretreatment and Monreal [2011] investigated the use of linseed oil. Other things such as paraffin wax and calcium hydroxide [Nozahic & Amziane 2012], NaOH treatment [Sedan et al. 2008] and EDTA [Le Troedec et al. 2008] have been studied. Another solution proposed in this paper is the use of a polysaccharide based viscosity modifying agent (VMA) into the mix. Thus, experiments are carried out in this investigation to study the effect of adding VMA into a rapeseed and hemp concrete mix.
2 MATERIALS, METHODS AND EXPERIMENTAL PROCEDURES
2.1 Materials
As mentioned above the two aggregates that were used in this investigation were hemp shiv and chopped rapeseed straw. The hemp shiv is grown and packed in Driffield, East Yorkshire in the UK and the rapeseed straw is chopped and packed in Co. Kildare in Ireland. The binder that was used was Vicat Prompt Natural Cement which is a lime binder mined from a seam of argillaceous limestone in Grenobles, France. The VMA that was used was a polysaccharide based VMA from Chemtec, UK.
2.2 Methodology
The first thing that was conducted was the characterisation of the aggregates. This was done by determining the bulk density, the water absorption and the particle size distribution (PSD) of the rapeseed and hemp straw. These tests allowed us to better understand and explain the results that were obtained. And directly compare the two aggregates independent of the binder and additive that was used. Prior to these tests being conducted, however, the aggregates were dried in an oven at 50°C until the mass variation was +/-0.1% of the day before. Then the aggregates were removed from the oven and stored in laboratory conditions (20°C and 50% humidity) for at least one day before anything else was done.
The PSD of the samples were determined using both the mechanical sieve method as well as the image analysis method proposed by Picandet [2012]. This involves using a computer software called ImageJ to analyse the individual particles for measurements like length, width, perimeter and area. In this investigation the major and minor axis were used as well as the equivalent diameter (ED) which was calculated using equation (1).
(1) The mechanical properties were also investigated and the properties chosen were the compressive strength and elastic modulus. The compressive strength of the samples were determined using 50mm cubes and a Zwick Roell static materials testing machine with a 100kN load cell. Similarly the elastic modulus of the samples were also determined using the Zwick Roell
machine but this time with 200x100Ømm cylinders. Both of these properties were tested at 7 and 28 days. All of the samples in this investigation used the same aggregate:binder:water ratio and that was 1:2:3. They were also cast using the same procedure and this was to add the aggregate and 65% of the mixing water first and mix for 2 minutes and 30 seconds. The binder was then added and mixed for a further 30 seconds before the remaining 35% of the mixing water and the additive (if one was used) was added. The amount of VMA added to the mixture was dictated by the amount of water as the ratio of water to VMA was 10:1 by mass. Mixing was done for a further 2 minutes to achieve homogeneity for a total mixing time of 5 minutes. The mixes were then cast in steel moulds in layers (3 for cylinders and 100mm cubes and 2 for 50mm cubes) using manual compaction hammers (Fig. 1) and were then allowed to mature in laboratory conditions for 3 days before demoulding. In regards to mechanical testing the samples were left in these conditions without cover until testing.
The water capillarity of the samples was also tested and these tests were conducted on 100mm cubes. The mixing and casting of the samples was exactly the same as for the mechanical property testing however the storage of the samples was slightly different. The test was adapted from the recommendations for ordinary concrete by the International Union of Testing and Research Laboratories for Materials and Structures [1994]. To this point the samples were tested after 14 and 28 days and were stored in an oven with a temperature of 50°C for 14 days prior to testing.
Fig. 1 – Compaction Procedure [Page et al. 2015]
2.3 Experimental Procedure
Bulk Density
The test should be carried out in laboratory conditions in order to ensure the bulk density results are reliable. 3 tests were conducted in order to analyse reliability The method is as follows:
1. Put an amount of the dried aggregate in a glass cylinder 10cm to 20cm in diameter and at least twice the diameter in height. The amount of material should be adjusted to be approximately half the volume of the container, at which point the mass should be taken.
2. Upend the cylinder 10 times.
3. Gently shake the cylinder in order to obtain a horizontal surface.
4. Mark the level.
5. Empty the cylinder and measure the marked volume with water.
6. Calculate the bulk density using equation (2).
0 10 20 30 40 50 60 70 80 90 100 0.1 1 10 100 % P a ss in g Log(Particle Size) (mm) H Equivalent Diameter H Major Axis H Minor Axis RS Eq Diameter RS Major Axis RS Minor Axis Water Absorption
Again for each aggregate, 3 tests were conducted in order to analyse the repeatability of the test and prior to testing the aggregates were homogenized as in a 20kg bag the aggregate would naturally segregate. The method was as follows:
1. Completely wet the permeable bag that will be used in the experiment.
2. Spin the wet permeable bag in a salad spinner 100 times at roughly twice per second.
3. Note the weight of the bag.
4. Weigh 25g of dry sample (denoted ) and put in the bag.
5. Submerge the bag and sample in the water for 1 minute.
6. Return the bag to the salad spinner and spin 100 times.
7. Weigh the bag and note the value for .
8. Repeat steps 5-7 with increasing time intervals and calculate the absorption value using equation (3).
100 (3)
Compressive Strength and Elastic Modulus
1. Weigh the sample and measure the height, width and thickness to be able to calculate the density. 2. Position the sample in the Zwick machine and
lower the crosshead until the compression pad is in contact with the top surface of the sample.
3. The loading rate was set to 0.6 N/s and the samples were tested up to 20% strain. The strength of the sample was also noted at 5% strain for the purposes of serviceability limits.
4. In regards to elastic modulus the test was conducted using cyclic loading. Three cycles were used, the first was loading from 0% to 1% strain and back to 0 N of force. The second cycle was up to 2% strain and back to 0 N of force and the third cycle was up to 3% strain and back to 0 N of force. Finally the samples were then loaded up to 20% strain.
5. Due to the fact that elastic modulus is defined as the change in stress over the change in strain it could be calculated using the resultant stress/strain graph from the cyclic experiment. The modulus was taken as the average of the three cyclic loading lines on the graph as detailed by Niyigena [2016]
Water Capillarity
1. 100mm cubes were prepared by applying a layer of waterproof tape around the circumference of the sample at the base to ensure the sample is only exposed to the water at its base.
2. A container of water was prepared and steel bars were set at the bottom of the container so as to prop up the samples. The amount of water in the container was also of the volume that an 8mm imbibition level was maintained between the top of the steel bar and the surface of the water (Fig. 2). 3. The samples were weighed when dry and then
added to the container and exposed to the water. The samples were removed from the water and weighed at set intervals of 1, 2, 3, 5, 10, 15, 30, 60, 120, 180 and 300 minutes.
4. It is critical to note that the level of the water was measured regularly to ensure the 8mm imbibition was maintained.
Fig. 2 – Water Capillarity test setup
3 RESULTS AND DISCUSSION
3.1 Aggregate Characterisation
Bulk Density
The bulk densities of both of the aggregates were first calculated using the average of three tests and the results can be seen in tab. 1.
Tab. 1 – Bulk Density of Aggregates
Sample Bulk Density (kg/m^3) Hemp 102.4
Rapeseed 79.5
Tab. 1 shows that the bulk density of the rapeseed is lower than that of the hemp and this is due to the fact that the rapeseed particles have been chopped down to a smaller size. As can be seen the bulk density of the hemp sample was 102.4 kg/m^3 which is similar to the results found in the literature [Chabannes et al. 2014 & Nguyen et al. 2010]
Particle Size Distribution
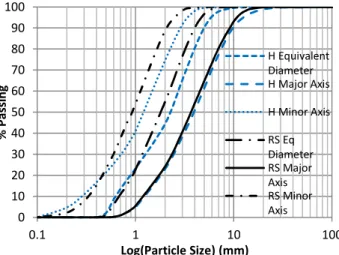
Fig. 3 shows the ImageJ analysis for the rapeseed and hemp straw. The ImageJ analysis was used to log measurements of the major axis of each particle as well as the minor axis (taken as the axis perpendicular to the major axis) and the equivalent diameter (Equation (1)).
ICBBM 2017 0 20 40 60 80 100 0.1 1 10 100 % P a ss in g Log(Particle Size) (mm) (b) Equivalent Diameter Major Axis Minor Axis Mechanica l Sieve 0 20 40 60 80 100 0.1 1 10 100 % P a ss in g Log(Particle Size) (mm) (a) Eq Diameter Major Axis Minor Axis Mechanical Sieve 0 50 100 150 200 250 300 350 400 450 0 240 480 720 960 1200 1440 W a te r A b so rp ti o n ( % ) Time (mins) Hemp Rapeseed As can be seen the rapeseed straw is smaller in all
directions. Although the rapeseed particles appear to be much thinner than the hemp particles whereas the rapeseed is only slightly smaller in terms of length. This larger decrease in width also leads to the larger decrease in ED. The reduction in width leads to a reduction in area and so a reduction in the ED. This can also be fairly easily seen in Fig 4.
(a) (b)
Fig. 4 – Size Comparison Between Hemp shiv and Rapeseed Straw
As mentioned above particle size distribution was conducted using both the traditional mechanical sieve method as well as analysis using ImageJ. The mechanical sieve method was by far the faster method however there are significant issues in using it to characterize hemp shiv and rapeseed straw. Due to the fact that the aggregate particles are anisotropic when mechanical sieving is conducted the particles are essentially sorted according to their width which leads to problems when trying to use sieves to analyse particles with an elongated shape [Picandet et al. 2012].
Fig. 5 – Mechanical Sieve and ImageJ Comparison (a) Rapeseed (b) Hemp
Fig. 5 illustrates the difference between the mechanical sieve method and the results from ImageJ. It can be seen that the mechanical sieve results align closest to the minor axis results for the ImageJ analysis. This puts limitation on the relevance of mechanical sieving for natural fibers because the fibers are anisotropic. The straw is roughly chopped after the stems have been harvested which leads to the elongated nature of the fibers and thus a more detailed analysis of the PSD is needed than what mechanical sieving can offer in order to obtain a comprehensive understanding of the difference in sizes of the particles between the hemp and rapeseed samples.
Water Absorption
The water absorption of the aggregates on their own was also tested as part of the characterisation process as described previously. A direct comparison between the two aggregates can be seen in fig. 6.
Fig. 6 – Water Absorption of Both Aggregates Raw Data
It can be seen in Fig. 6 that both aggregates absorb most of their water over the 24 hour testing period in the first minute. This is the initial rate of absorption (IRA) and is the amount of water that is absorbed after 1 minute of exposure and represents the initial water suction from a free water surface [Groot 1999]. It can be seen that the rapeseed aggregate absorbs more water than the hemp; after 24 hours the rapeseeds sample has absorbed 394 % of its own weight in water whereas the hemp absorbed 363 %. Both of which are very high. The results were then plotted against the log of time and expression (4) was used to describe the absorption characteristics of both materials.
#$% & ' ()* (4) The IRA is the amount of water that is absorbed after 1 minute of exposure as described previously and the diffusion rate within cells is described by the term K . This is more related to the secondary absorption or internal adsorption step of capillarity; it is this term that is closely linked to the essential porosity of the material.
0 100 200 300 400 500 600 700 Untreated VMA D e n si ty ( kg /m ³) Hemp Rapeseed 0 100 200 300 400 500 600 700 Untreated VMA D e n si ty ( kg /m ³) Hemp Rapeseed 0.00 0.20 0.40 0.60 0.80 1.00 1.20 Untreated VMA f' c (M P a ) Hemp Rapeseed (a) y = 17.407ln(x) + 227.66 y = 23.904ln(x) + 217.69 150 200 250 300 350 400 450 1 10 100 1000 10000 W a te r A b so rp ti o n ( % ) Log(time) (Mins) Hemp Rapeseed 0.00 0.50 1.00 1.50 2.00 Untreated VMA f' c (M P a ) Hemp Rapeseed (b)
Fig. 7 – Sorption Coefficients for Both Aggregates
Fig. 7 again illustrates that the IRA of the rapeseed sample was higher and also shows in more detail that the sorption coefficient of the rapeseed sample was also higher. Meaning that the rapeseed sample is more susceptible to absorbing water at the micro and macro level.
3.2 Mechanical Properties
Cube Density
The treatment of the two aggregate types with VMA was also studied in regards to mechanical performance. But prior to that, density measurements were taken. The results of these can be seen in Fig. 8.
Fig. 8 – Density Comparison for both Aggregates Treated and Untreated at 7 days
Fig. 8 illustrates the fact that the use of rapeseed straw as an aggregate results in higher density material. This is likely because the rapeseed straw that was used in this investigation was smaller (Fig. 5) resulting in more material fitting into the same volume and smaller pores being left in between the aggregate particles resulting in the material being better compacted. The figure also shows that the addition of the VMA also leads to an increase in density of the concrete. This is consistent when the results at 28 days are analysed (Fig. 9 You can also see in figure that with time density decreases, which agrees with the literature [Colinart et al. 2012]. .
Fig. 9 – Density Comparison for both Aggregates treated and Untreated at 28 days Compressive Strength
As was described the compression tests were done on 50 mm cubes and the results are plotted in Fig. 10. The figure illustrates that for both aggregate types the addition of a VMA greatly increases the strength (141 % and 59 % for hemp and rapeseed respectively). It can also be seen that the use of the rapeseed aggregate also leads to an increase of the compressive strength when directly comparing the two aggregate types. This is a strong promotion of its use within the field of bio-based building materials, however could be explained when looking at the size distribution of the aggregate particles. Because the rapeseed particles are smaller along the minor axis, an increase in density is seen in the concrete samples. And as is well known the mechanical properties are strongly linked to the density; the higher the density, the stronger the material (Elfordy et al. 2008). This will need to be investigated further; although it does seem that if the increase in strength was caused solely by the slightly smaller width causing a slightly higher density for the rapeseed concrete then this increase would be disproportionate as the increase in strength in significant. This leads the author to believe that the size distribution of the particles is not the only cause of the increase and, although it may be a factor, the type of aggregate used also causes an effect.
Fig. 10 – Compressive Strength after (a) 7 Days and (b) 28 Days
ICBBM 2017 0 5 10 15 20 25 30 35 40 0 1 2 3 4 5 M a ss o f W a te r A b so rb e d ( % ) Time (hrs) (a) Hemp Untreated Hemp VMA Rapeseed Untreated Rapeseed VMA 0 5 10 15 20 25 30 Untreated VMA M o d u lu s o f E la st ic it y ( M P a ) Hemp Rapeseed 0 0.2 0.4 0.6 0.8 1 1.2 1.4 1.6 0 7 14 21 28 35 C o m p re ss iv e S tr e n g th ( M P a ) Age (Days) Hemp Untreated Hemp VMA Rapeseed Untreated Rapeseed VMA 0 20 40 60 80 100 120 Untreated VMA M o d u lu s o f E la st ic it y ( M P a ) Hemp Rapeseed The trend continues when investigating the strength
after 28 days as can be seen in Fig. 10. And the strength development over time can be seen in Fig 11.
Fig. 11 – Strength Development of All Mixes
Fig. 11 illustrates again that the rapeseed samples have higher compressive strength but it also highlights the fact that the rapeseed samples gain more strength between the period of 7 and 28 days when compared to the hemp samples. This is interesting and will be examined further with compressive testing being conducted at 90 days
Elastic Modulus
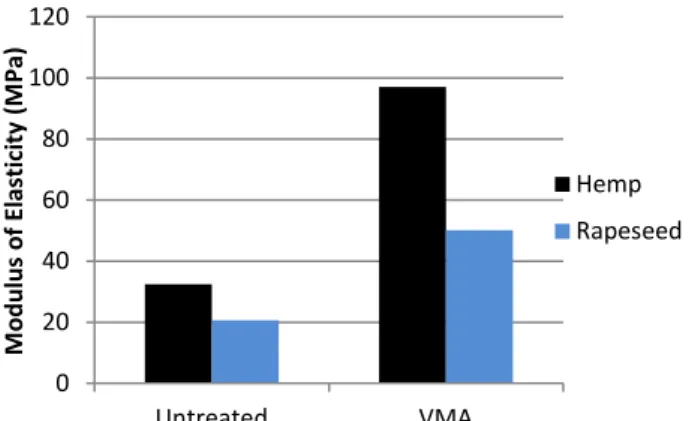
The specimen size that was chosen for investigating the elastic modulus of the material was 200x100Ø mm cylinders. The results of the elastic modulus after 7 and 28 days are shown in Fig. 12 and 13.
Fig. 12 – Elastic Modulus after 7 Days
The results clearly show that the elastic modulus for both the untreated samples and VMA treated hemp samples are higher than the equivalent rapeseed mixes. This is interesting given the fact that the compressive strength of the rapeseed mixes were higher, meaning that the hemp samples can be described as weaker but stiffer whereas the rapeseed samples are stronger but more ductile. It can also be seen that for both aggregate types the addition of VMA into the mix leads to an increased modulus of elasticity. This trend continues after 28 days and is indeed more extreme. The elastic modulus of the hemp sample with VMA addition increases by 247 % to 97.1 MPa whereas the equivalent rapeseed sample increases by 140 %.
Fig. 13 – Elastic Modulus after 28 Days
3.3 Water Capillarity
As mentioned previously the water capillarity test was done after 14 and 28 days. This was to determine if the maturity of the binder had any impact on the porosity of the concrete; in this case most likely through the mechanism of carbonation. The results are presented in two different ways; by percentage of weight and also in kg/m^3. This represents the fact that due to the test setup water could only be absorbed with capillary forces through the bottom face of the cube only. Fig. 14 shows the amount of water absorbed by percentage of mass for both 14 and 28 days. In both cases it can be seen that the addition of the VMA greatly reduces the amount of water that is absorbed by the sample; by roughly 22% in the case of the rapeseed samples after 14 days. It should also be noted that this effect is exaggerated further when analyzing the results after 28 days. Again for the rapeseed samples, the VMA causes a 27% reduction in the mass of water absorbed although as can be seen in the figures the water absorption increases between 14 and 28 days. Also interestingly the increase in water absorption is much larger in the hemp samples compared to the rapeseed samples. Between 14 and 28 days there is an 18.5 and 7.7 % increase in the mass of water absorbed for the untreated and VMA rapeseed samples respectively, whereas for the hemp samples the increase is much larger; 69.4 and 187 %. This indicates a better aptitude for durability resistance to weathering for the rapeseed samples and is something that will be investigated further.
0 5 10 15 20 25 30 35 40 0 1 2 3 4 5 M a ss o f W a te r A b so rb e d ( % ) Time (hrs) (b) Hemp Untreated Hemp VMA Rapeseed Untreated Rapeseed VMA y = 1.8861x + 3.3009 y = 0.3147x + 0.1445 y = 1.3407x + 10.966 y = 0.6081x + 2.1068 0 2 4 6 8 10 12 14 16 18 0 0.5 1 1.5 2 2.5 W a te r A b so rp ti o n p e r S u rf a ce U n it (kg /m ^ 2 ) Time (hr^0.5) Hemp Untreated Hemp VMA Rapeseed Untreated Rapeseed VMA y = 2.0068x + 6.3184 y = 0.485x + 0.8213 y = 1.2208x + 13.884 y = 0.6547x + 2.3521 0 2 4 6 8 10 12 14 16 18 0 0.5 1 1.5 2 2.5 W a te r A b so rp ti o n p e r S u rf a ce U n it ( kg /m ^ 2 ) Time (hr^0.5) Hemp Untreated Hemp VMA Rapeseed Untreated Rapeseed VMA 0 5 10 15 20 25 30 35 450 500 550 600 M a ss o f W a te r A b so rb e d ( % ) Density (kg/m^3) Hemp Untreated Hemp VMA Rapeseed Untreated Rapeseed VMA
Fig. 14 – Percentage of Water Absorbed by Mass (a) 14 days (b) 28 days
The figures also show, and in particular after 28 days, that whereas the rapeseed sample has saturated by the time the 5 hour test was concluded, the untreated hemp sample is still absorbing water. This highlights the potential that the hemp samples could be retested for a longer period of time to see how long it takes for the samples to saturate and also how much water is needed for saturation to occur.
Fig. 15 highlights the sorption coefficient of the material. As recommended by Amziane et al. [2017] the results of the capillarity test are converted into kg/m^2 using the known dimensions of the bottom face of the cube and plotted against log(time). This allows a best fit line to be plotted for the data set and this can be used to find the amount of water absorbed, W, at a specified time, t, using expression (4);
Fig. 15 – Sorption Coefficients for all Samples after 14 days
Fig. 15 shows more clearly using the first point of each data set that the untreated rapeseed sample is the most susceptible to absorbing liquid water through capillarity. However when directly comparing the hemp and rapeseed untreated samples it can be seen that the sorption coefficient is higher for the hemp sample despite the fact that the IRA is lower. This indicates that the hemp samples are more susceptible to absorbing water through diffusion of water vapour through the cell wall of the aggregate (the secondary absorption step). This fact is even more pronounced
for the 28 day untreated samples; the coefficient of absorption for the rapeseed sample is actually lower after 28 days however is greatly increased for the untreated hemp sample. Fig. 16 also illustrates in more detail that the water absorption increases overall for all of the samples. The IRA increases for all four mixes and the coefficient of absorption increases for both the hemp mixes however lowers for both of the rapeseed samples. Again giving an indication that the rapeseed samples may be more resistant to long term weathering.
Fig. 16 – Sorption Coefficients for all Samples after 28 days
Finally Fig. 17 plots the total amount of water absorbed after 5 hours against the density after 14 days. The graph shows a reasonably strongly negative correlation between density and total water absorption across all of the mixes. As mentioned previously the addition of VMA into the mix results in an increased density. Which in turn leads to a lower amount of water absorbed due to the fact that an increase in density leads to a decrease in porosity. It is also interesting to note that the addition of VMA into the rapeseed mix leads to a greater reduction of absorbed water with less of an increase in density when compared to the hemp mix. The addition of VMA into the rapeseed concrete better maintains the lightweight nature of the concrete whilst also more greatly reduces one of its biggest weaknesses, which can be viewed as highly promising for this mix type. Although it should be noted in the compressive testing it was found that the Rapeseed VMA mix had a higher density than the hemp VMA mix, highlighting the variability of this property for bio-based building materials which will be studied further.
Fig. 17 – A plot of Water Absorbed by Percentage Against that Sample’s Density
ICBBM 2017
4 CONCLUSION
The addition of a VMA into the mixture of two bio-based building materials was studied in regards to mechanical and transport properties. It was found that the use of the novel aggregate rapeseed straw has a future in the industry as a bio-based building material and is especially promising as a solution in the UK due to the geographical convenience and abundance of the material there. It was found that the rapeseed is even lighter than the very lightweight hemp and does not suffer any comparative mechanical performance restrictions because of it.
During mechanical testing it was found that the hemp samples were weaker in compression and yet exhibited a higher elastic modulus, this will be investigated further but indicates that the hemp samples were more brittle and exhibited a stronger plastic nature in the early stages of loading. Whereas the rapeseed samples were able to endure greater loading at higher strains. It was also found that the addition of VMA into the mix greatly increased both the compressive strength and elastic modulus of the mixes with both aggregate types. This trend was exhibited at both testing ages, and it was also concluded that the rapeseed samples gained compressive strength faster than the equivalent hemp mixes.
With regards to water capillarity and its indication for durability performance rapeseed concrete shows a higher initial rate of water absorption. However after the initial 1 minute period of absorption the hemp concrete seems to be most affected by water as the untreated hemp samples had a higher water absorption coefficient when compared to the untreated rapeseed samples. This lower rate of absorption after the initial 1 minute period could give potential indication of the superior durability performance of rapeseed concrete in regards to weathering.
The addition of VMA showed extremely promising results for water absorption. For both rapeseed and hemp concrete the addition of VMA drastically reduced the amount of water that was absorbed by the samples in both absorption phases (IRA and sorption coefficient) and, coupled with the drastic improvement of the mechanical properties of these concretes, gives VMA an extremely promising future in the field of bio-based building materials.
Future work will include more detailed analysis of the interfacial transition zone to fully understand the mechanical results obtained and also to design and carry out experiments to evaluate the weathering resistance of all of these mixes.
5 REFERENCES
[Amziane 2016] Amziane, S., Sonebi, M. “Overview on Bio-Based Building Material Made with Plant Aggregate,” 2016, 31–38.
[Amziane 2017] Amziane, S., Collet, F., Lawrence, M., Picandet, V., et al. “Round Robin Test for Hemp Shiv Characterisation: Committee Report of TC - 236 Bio-Based Building Materials.” 2017.
[Amziane 2015] Amziane, S., Nozahic, V., Sonebi, M. “Design of Mechanically Enhanced Concrete Using Hemp Shiv.” In First International Conference on
Bio-Based Building Materials, 2015, 422–26.
Clermont-Ferrand, France: RILEM.
[Amziane 2015] Amziane, S., Sonebi, M. 1st
International Conference on Bio-Based Building Materials. 2015.
[Chabannes 2014] Chabannes, M., Bénézet, J. C., Clerc, L., Garcia-Diaz, E. “Use of Raw Rice Husk as Natural Aggregate in a Lightweight Insulating Concrete: An Innovative Application.” Construction and
Building Materials 70. Elsevier Ltd: 2014, 428–38.
[Colinart 2012] Colinart, T., Glouannec, P., Chauvelon, P. “Influence of the Setting Process and the Formulation on the Drying of Hemp Concrete.”
Construction and Building Materials 30. Elsevier Ltd:
2012, 372–80.
[Elfordy 2008] Elfordy, S., Lucas, F., Tancret, F., Scudeller, Y., et al. “Mechanical and Thermal Properties of Lime and Hemp Concrete (‘hempcrete’) Manufactured by a Projection Process.” Construction
and Building Materials, 2008 22 (10): 2116–23.
[European Energy Agency 2015] European Energy Agency. “Final Energy Consumption by Sector and Fuel.” European Energy Agency. 2015.
[Groot 1999] Caspar, G. “The Influence of Water Flow ( Reversal ) on Bond Strength Development in Young Masonry” 1999, 44 (2): 63–78.
[International Union of Testing and Research Laboratories for Materials and Structures 1994] International Union of Testing and Research Laboratories for Materials and Structures. “Absorption of Water by Concrete by Capillarity.” In RILEM
Technical Recommendations for the Testing and Use of Construction Materials, 1994, 34–35. Taylor and
Francis.
[Khazma 2008] Khazma, M., El Hajj, N., Goullieux, A., Dheilly, R. M., et al. “Composites : Part A Influence of Sucrose Addition on the Performance of a Lignocellulosic Composite with a Cementious Matrix.”
Composites Part A 2008, 39 (12). Elsevier Ltd: 1901–
8.
[Ladouidi 2015] Laidoudi, B., Flamin, C., Crigny, A., Ferrari, J., et al. “Bio Based Concrete with Crushed Rape Straw, a Good Alternative to Develop an Affordable Bio Based Concrete for Construction and Renovation.” In First International Conference on
Bio-Based Building Materials, 2015, 23–30.
Clermont-Ferrand, France: RILEM.
[Le Troedec 2008] Le Troedec, M., Sedan, D., Peyratout, C., Bonnet, J. P., et al. “Influence of Various Chemical Treatments on the Composition and Structure of Hemp Fibres.” Composites Part A: Applied
Science and Manufacturing 2008, 39 (3): 514–22.
[Monreal 2011] Monreal, P., Mboumba-Mamboundou, L. B., Dheilly, R. M., Quneudec, M. “Effects of Aggregate Coating on the Hygral Properties of Lignocellulosic Composites.” Cement and Concrete
Composites 33 (2). Elsevier Ltd: 2011, 301–8.
[Nguyen 2010] Nguyen, T. T., Picandet, V., Carre, P., Lecompte, T., et al. “Effect of Compaction on
Mechanical and Thermal Properties of Hemp Concrete.” European Journal of Environmental and
Civil Engineering, 2010, 14 (5): 545–60.
[Niyigena 2016] Niyigena, C., Amziane, S., Chateauneuf, A., Arnaud, L., et al. “Variability of the Mechanical Properties of Hemp Concrete.” Materials
Today Communications. 2016.
[Nozahic 2012] Nozahic, V., Amziane, S. “Influence of Sunflower Aggregates Surface Treatments on Physical Properties and Adhesion with a Mineral Binder.”
Composites Part A: Applied Science and
Manufacturingm, 2012, 43 (11). Elsevier Ltd: 1837–49.
[Page 2015] Page, J., Sonebi, M., Amziane, S. “Experimental Investigation on the Performance of Hybrid Hemp-Flax Composite Materials.” In First
International Conference on Bio-Based Building Materials, 2015, 243–50. Clermont-Ferrand, France:
RILEM.
[Palmer 2013] Palmer, J. (DECC), Cooper, I. (DECC). “Housing Energy Fact File.” Department of Energy &
Climate Change, 2013, 171.
[Picandet 2012] Picandet, V., Tronet, P., Baley, C. “Caractérisation Granulométrique Des Chènevottes.” 2012.
[Sedan 2008] Sedan, D., Pagnoux, C., Smith, A., Chotard, T. “Mechanical Properties of Hemp Fibre Reinforced Cement : Influence of the Fibre / Matrix Interaction” 2008, 28: 183–92.
Colinart, T., P. Glouannec, and P. Chauvelon. 2012. “Influence of the Setting Process and the Formulation on the Drying of Hemp Concrete.”
Construction and Building Materials 30. Elsevier
Ltd: 372–80.
![Fig. 1 – Compaction Procedure [Page et al. 2015]](https://thumb-eu.123doks.com/thumbv2/123doknet/14650042.551239/3.892.460.771.615.739/fig-compaction-procedure-page-al.webp)