MSc HES-SO en Business Administration
Orientation :
Management et Ingénierie des Services
ENERGY CONSUMPTION BEHAVIORS
Done by
Nathalie Uwase Turin
Under the direction of
Prof. Emmanuel Fragnière
« Le spécialiste des sciences sociales est comparable à un pêcheur,
qui a délimité sa zone de pêche, c’est-à-dire son sujet de départ et
son terrain, mais qui ne sait pas quel poisson il va attraper. »
Attestation
Je déclare sur l’honneur, que j'ai effectué ce Travail de Master seul, sans autre aide que celles dûment signalées dans les références, et que je n'ai utilisé que les sources expressément mentionnées. Je ne donnerai aucune copie de ce rapport à un tiers sans l'autorisation conjointe du Responsable de l’Orientation et du Professeur chargé du suivi du Travail de Master et de l’institution ou entreprise pour laquelle ce travail a été effectué.Nyon, August 31, 2012.
Acknowledgments
My sincere thanks go to my family and friends who always supported me throughout my studies, especially when I was tired and maybe irritable.I truly thank Professor Emmanuel Fragnière for supporting me and always believing in my capacity to achieve this goal. Thanks also the whole team of the Geneva School of Business Administration Survey Lab (Laboratoire d’Etude de Marché) and to my dream team of students.
A special thanks also goes to Professor Denis Lavigne who guided me through my discovery of energy models and for his guidance throughout my analysis. Thanks also to the E2G GERAD team in Montreal who welcomed me and gave me a taste of research.
Abstract
This paper focuses on end-user energy consumption behaviors with the objective to gather information in order to give more explicit knowledge about demand side. The author chose to adopt a qualitative method for the first part so as to collect an in depth comprehension of energy consumption behavior. Semi-directive interviews addressed different energetic topics such as water, heating, electricity but also communication and population knowledge about energy issues. A quantitative survey through a questionnaire completed the qualitative part with the objective to confirm or invalidate the hypotheses of the first part. The aim of the paper is to provide energy models with more precise elements about demand, as at the moment it is estimated through non-behavioral parameters such as Gross Domestic Product or demography. The author concludes this paper by proposing lines of thought in order to build guidelines to enable the introduction of behavioral components in the models.Table of Contents
Acknowledgments iv
Abstract v
Abbreviations vii
List of Figures viii
List of Tables ix
List of Graphs x
1. Introduction 1
1.1. Aim of Study 1
1.2. Scope and Limitation of Study 2
2. Literature Review 3 3. Methodology 6 3.1. Etude qualitative 6 3.2. Paper Methodology 9 4. Qualitative Research 10 4.1. Data analysis 10 4.1.1. Ethnology questions 10 4.1.2. Thematic issues 11
4.1.3. Analysis of recurrent themes 16
4.2. Main findings 17 5. Quantitative Research 18 5.1. Data analysis 18 5.1.1. Ethnology questions 18 5.1.2. Thematic issues 21 5.2. Main findings 35
6. Data Introduction in TIMES-Canada 37
6.1. TIMES-Canada 37
6.2. Preliminary research 38
7. Synthesis & Conclusions 42
8. References 44
8.1. Publications 44
8.2. Web Site 46
Abbreviations
ETSAP Energy Technology System Analysis ProgramGERAD Groupe d'études et de recherche en analyse des décisions IEA International Energy Agency
MARKAL MARket ALlocation RES Reference Energy System
List of Figures
Figure 2.1 – Partial view of a simple Reference Energy System ... p. 3 Figure 5.1 – Question 11 – What does a car represent for you? Word cloud ... p. 33 Figure 5.2 – Questions 11 and 12 – What does a car represent for you? andDo you own a car? Word cloud ... p. 33 Figure 6.1 – 13 Canadian provinces and territories ... p. 36 Figure 6.2 – TIMES-Canada model global structure... p. 37
List of Tables
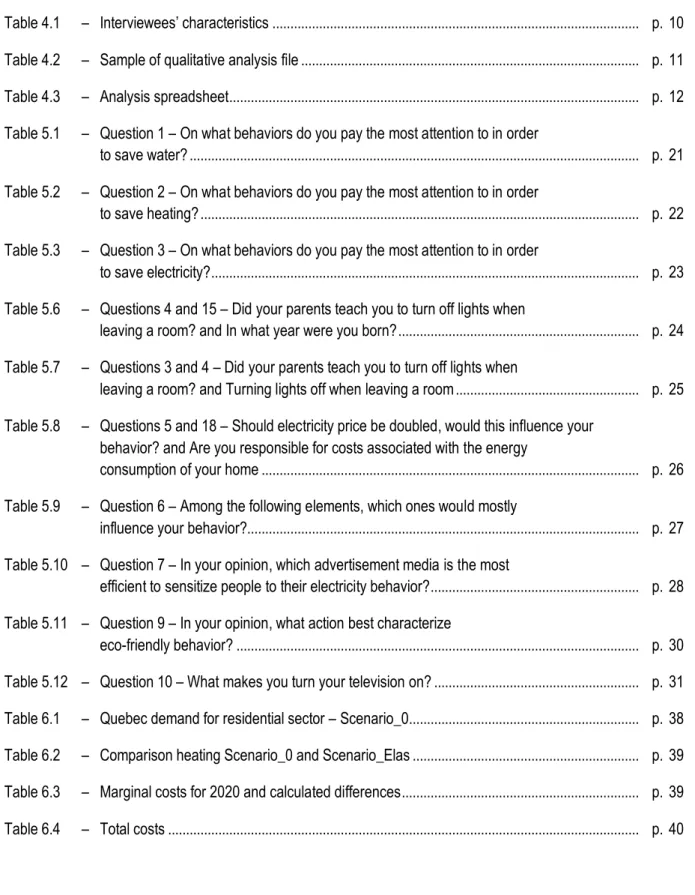
Table 4.1 – Interviewees’ characteristics ... p. 10 Table 4.2 – Sample of qualitative analysis file ... p. 11 Table 4.3 – Analysis spreadsheet ... p. 12 Table 5.1 – Question 1 – On what behaviors do you pay the most attention to in orderto save water? ... p. 21 Table 5.2 – Question 2 – On what behaviors do you pay the most attention to in order
to save heating? ... p. 22 Table 5.3 – Question 3 – On what behaviors do you pay the most attention to in order
to save electricity?... p. 23 Table 5.6 – Questions 4 and 15 – Did your parents teach you to turn off lights when
leaving a room? and In what year were you born? ... p. 24 Table 5.7 – Questions 3 and 4 – Did your parents teach you to turn off lights when
leaving a room? and Turning lights off when leaving a room ... p. 25 Table 5.8 – Questions 5 and 18 – Should electricity price be doubled, would this influence your
behavior? and Are you responsible for costs associated with the energy
consumption of your home ... p. 26 Table 5.9 – Question 6 – Among the following elements, which ones would mostly
influence your behavior?... p. 27 Table 5.10 – Question 7 – In your opinion, which advertisement media is the most
efficient to sensitize people to their electricity behavior?... p. 28 Table 5.11 – Question 9 – In your opinion, what action best characterize
eco-friendly behavior? ... p. 30 Table 5.12 – Question 10 – What makes you turn your television on? ... p. 31 Table 6.1 – Quebec demand for residential sector – Scenario_0... p. 38 Table 6.2 – Comparison heating Scenario_0 and Scenario_Elas ... p. 39 Table 6.3 – Marginal costs for 2020 and calculated differences ... p. 39 Table 6.4 – Total costs ... p. 40
List of Graphs
Graph 5.1 – Question 14 – Gender ... p. 18 Graph 5.2 – Question 17 – Owner or Tenant? ... p. 18 Graph 5.3 – Question 18 – Are you responsible for costs associated with energyconsumption of your home? ... p. 18 Graph 5.4 – Question 20 – What is your current job profile? ... p. 19 Graph 5.5 – Question 21 – What is the annual gross income of your household? ... p. 19 Graph 5.6 – Question 15 – In what year were you born?... p. 20 Graph 5.7 – Question 5 – Should electricity price be doubled, would this influence
your behavior?... p. 26 Graph 5.8 – Question 8 – Let’s suppose government has no choice but to ration quantity
of distributed electricity. Would you pay more in order to consume more? ... p. 29 Graph 5.9 – Question 12 – Do you own a car? ... p. 32 Graph 5.10 – Question 13 – Do you know the production source of your electricity? ... p. 34 Graph 5.11 – Question 13a – Would you like to know the production of your electricity? ... p. 34 Graph 5.12 – Question 13b – What is in your opinion the ratio of each energy sources
1. Introduction
Since the 1973 oil crisis, concerns about energy issues never stopped growing. Many models have been developed to evaluate energy resources but also consumption. After Fukushima’s 2011 accident, debates about nuclear energy have been more virulent than ever and most of European countries re-thought of ways to leave this type of production because of risks that is associated to it. In Switzerland, nuclear represents around 40% of consumption1currently produced by five central. In 2011, Swiss government set up not to replace old central so
country should be nuclear free by 2034. At the same time, the Swiss Federal Office of Energy considers that consumption should grow from 58.6 TWh in 2011 to 86.3 TWh in 20502. Of course, all those elements forced government to re-think energy policies and scenarios and their plan is to set up more sustainable energy policies and encourage renewables.1.1. Aim of Study
Developed under the aegis of the Energy Technology Systems Analysis Program (ETSAP) of the International Energy Agency (IEA), the TIMES/MARKAL family of models takes into consideration technological and economic data to build energy scenarios. Such scenarios are important decision tools and are currently used worldwide3 with specialists continually working on data collection and model improvement.
Aim of study is to keep on with previous researches on way to include social behavior in TIMES/MARKAL model. This paper will try to explain some of end users’ energy consumption behavior through both qualitative and quantitative methods.
First part will consist in semi-directives interviews. This qualitative method will help to get in depth findings about elements that influence interviewee’s behavior. Analysis will enable the author to highlight motivation and habits of respondents regarding their energy consumption. Based on qualitative results, research hypotheses will be issued.
Second part will be using a quantitative methodology. A survey will be addressed to Geneva area’s inhabitants in order to confirm or deny research hypotheses issued in the first part, but also from previous work done at the Geneva School of Business Administration (Haute Ecole de Gestion de Genève). The author will process analysis using SPPS, a statistic program.
The aim of this paper is to focus on end user consumer to understand their behavior’s influence on regional or global energy consumption. In fact, individual behaviors have often been neglected in diverse studies on energy problem. The objective is to give real understanding key of those behaviors, propose tools to build effective communication on energy issues and provide guidelines to integrate behavioral components in the model.
1.2. Scope and Limitation of Study
The study will focus on end-users in order to understand their behavior, factors that influence them and possible area of change. In fact, in Switzerland in 2011, household’s account approximately for one third of total final energy consumption4. Study has been addressed to the Geneva area population but author will try to implement them in the TIMES-Canada model.
Limitation remains in the accuracy of data collected and ability to integrate them directly in the model. In fact, at the end of the paper, author will present preliminary research on how to find relevant data, starting from the model.
2. Literature Review
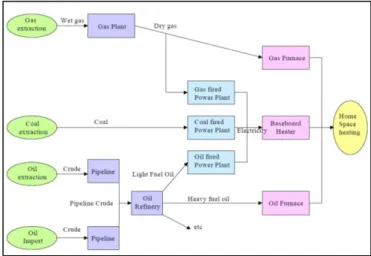
In this section, the author briefly presents the TIMES/MARKAL energy-economy model that data collected are willing to supply and main limitations of such models by outlining the strong sociological dimension characterizing energy consumption and the behavior of consumers. Author will present a few papers that already analyzed consumption structure and potential of saving and how politics and companies communicate to end users in order to lower energy consumption. Initiatives developed by energy suppliers will be presented as well and this section will conclude on studies that analyzed action affecting energy consumption in order on enhance the relevance of a sociological approach to the existing TIMES/MARKAL family of models.The MARKAL (an acronym for MARKet ALlocation) family of models has been developed under the aegis of the Energy Technology Systems Analysis Program (ETSAP) of the International Energy Agency (IEA). Firstly built at a country level and then extended to groups of countries bound by international trade, some models also assess smaller area and are defined at regional, city or community level. Cubizolle et al. (2007) presented their development of a specific SOCIO-MARKAL model for Nyon area, a mid-sized city in Switzerland whereas GERAD (Groupe d'études et de recherche en analyse des decisions) developed TIMES-Canada5, a model that addresses the whole country. TIMES (an acronym for The Integrated MARKAL-EFOM System) is a new version of the model which offers new possibilites. It defers in some aspects with MARKAL but general idea is the same. TIMES/MARKAL model includes variables, equations and in equations including all data of a Reference Energy System (RES), namely energy sources, conversion technologies, technologies meeting demand and useful demand to satisfy which makes it a bottom-up technology-based dynamic linear programming (LP) model (Lavigne and Fragnière, 2011).
Figure 2.1. Partial view of a simple Reference Energy System
TIMES/MARKAL models allows researchers and decision makers to face multiple choices situations and develop long-term energy scenarios. Goal of TIMES/MARKAL models is to determine the optimum energy mix and networks that can meet a specific demand, subject to user-defined constraints (Weijemars, Taylor, Bahn, Das and Wei, 2011). Full description of TIMES/MARKAL family of models can be found on the ETSAP website6. Even if TIMES/MARKAL models take into consideration several external factors, consumer’s behavior has not yet been introduced as an important factor to determine energy efficiency, savings, and emission reduction (Kanala, Turin and Fragnière, 2012). In the early 2000, EURECO project showed a 38% potential of reduction for electricity consumption in household’s, mainly by very common intervention (European Community, Assessment of the Potential Electricity Savings, 2002 cited in Desmedt, Van Beal and Vekemans, 2009). A few years later, a report of the United Nations Environment Program (UNEP, 2008) showed that 80% of total energy consumption takes place during the use of buildings. Such results highlight the importance of household’s energy consumption and behavior. In France, the CREDOC (2011) realized a survey and showed that 93% of French people think that their individual behavior can have an impact on environment and 78% admit that they could do more or better with their lifestyle to look after sustainable development.
The growing use of electronic devices and time spent on using them shows us the importance of educating people. Beside that there are some elements which make it difficult to influence or even evaluate. Faburel (2004, cited in Rocci 2007) points out three major tensions brought by climate change: (1) social, with a gap between individual and collectivity; (2) spatial, between local and global; (3) temporal, between short and long term. Moreover, Boulanger (2007) has developed the concept of energy efficiency barriers to try and explain the gap between economic efficiency and effective behavior.
Regarding sensitization to energy issues, some authors focused on communication tools and how it reaches people. Desmedt, Van Bael and Vekemans (2009) have shown that they are numerous but hardly catch any attention. Moreover, Bottrill (2007) has shown that tools used to promote energy conservation lack the ability to give people advice to accurately monitor their energy use and provide them with meaningful feedback and guidance for modifying their energy consumption. Rydin et al. (2007) and Nye and Burgess (2008) insisted on the importance of engaging root practice(s) and the context in which those practices take place. Gyberg and Palm (2009) identified four different categories of material: (1) individual choices; (2) creating incentives; (3) creating a measurable world; (4) technological improvements. In between, they also show important facts and limitations for each categories, namely (1) alternatives are limited, and the information and knowledge about them varies greatly; (2) incentives focusing on price have limited influence (Aune, 2004 cited in Gyberg and Palm 2009); (3) to live a more efficient life demands control; (4) detailed studies on households’ energy consumption are not so common.
Hydro One, an energy supplier active in Canada conducted a test in order to create a measurable world. They gave real-time electricity monitors to 17’000 customers and results showed that it helped homeowners reduce their consumption of electricity by up to 15%, with an average reduction of 6.5% (Chartwell’s best practices, 2007). In Geneva area, the energy supplier launched a vast campaign named Eco21 with different promotion tools focusing on the four points cited above7.
Previous studies have discussed some specific action that affects energy consumption. Gyberg and Palm (2009) highlighted that people provide two motivations for changing their behavior: lower energy costs and a reduced impact on environment. But Wallenborn et al. (2006) research found that even if behavior is influenced by many criteria and constraints, financial issues are often less important than other personal criteria. Ouyang and Hokao (2009) shown that improving consumption behavior can save up to 10% of energy use by studying the relationship between electricity consumption and household lifestyle. Moreover, Diamond (1984, cited in Wilhite et al. 2000) showed that there could be a variation of 10-to-1 in total energy use among identical apartments. This literature review showed that energy-use behavior depends on our culture and on socio-economic aspects. In that sense, understanding behavior is primordial. Information and how it is communicate also influence citizens’ behavior. This paper aims to analyze different aspects and themes on energy consumption, focusing on behavioral aspects. It will cover day to day activity but also knowledge and point of view of interviewees on energy in general.
3. Methodology
This section will present methodology used to complete this study. It relies on quantitative and qualitative methods, but as qualitative methods are not very developed in TIMES/MARKAL family of models, author will present them more thoroughly. For practical reason, this part will be written in French.3.1. Etude qualitative
Lorsque l’on parle d’études de marché dans notre quotidien, le premier exemple qui nous vient en tête est celui du sondage téléphonique ou encore mené dans la rue. Celui-ci permet de collecter des données précises permettant de généraliser les observations à l’ensemble d’une population à partir d’un échantillon. Les résultats de ce type d’enquête sont souvent repris dans la presse car ils font ressortir des chiffres clés qui permettent une bonne compréhension des phénomènes. Ce type de recherche fait appel à des méthodes quantitatives.
Cependant, les études de marché ne se limitent pas à ce type de méthode. Ainsi, comme le relève Miles & Hubermann (1994), «Toute recherche possède une base qualitative». Alors que les études quantitatives répondent majoritairement à des questions fermées et aboutissent à des résultats chiffrés généralisables, les études qualitatives cherchent à analyser en profondeur des phénomènes sociaux et offrent souvent comme résultats des mots.
La méthodologie présentée ici place la recherche qualitative en amont d’une deuxième phase quantitative. Elle doit nous permettre de découvrir des éléments menant à la construction de l’étude quantitative. Notons ici qu’une étude qualitative peut se suffire à elle-même et que la méthode de recherche utilisée doit avant tout être choisie en fonction de l’objet étudié.
Recherche documentaire
Pour commencer, il s’agit de se documenter un maximum sur la thématique abordée. En effet, il est sans doute possible de trouver des articles de journaux ou même des articles scientifiques traitant d’un sujet proche du votre. Cette première prise de contact permet d’élargir le champ ; nous partons parfois avec des idées préconçues sur notre objet de recherche. De plus, on peut alors connaître les moyens utilisés par d’autres personnes ayant travaillé sur le même thème et cela peut nous orienter dans notre travail.
Afin d’effectuer ces recherches, il s’agit de choisir différents moyens adaptés à ses propres besoins. En plus d’Internet, il existe des bases de données, payantes ou gratuites, qui compilent les références autour de thématiques précises. Il est aussi intéressant d’utiliser les modes de recherche avancée des différents moteurs de recherches. Ceux-ci permettent de spécifier une période, un nom de domaine ou encore un format de document spécifique de recherche pour ne citer que quelques possibilités. Les bibliothèques, souvent abonnées à des journaux ou magazines, regorgent elles aussi d’informations pouvant vous être utiles.
Cette première prise de contact avec votre objet de recherche vous donne des pistes de réflexion et vous permettra de préciser les questions auxquelles vous souhaiter obtenir des réponses. On peut alors passer à la partie de terrain avec les entretiens.
Recherche terrain
Après cette première phase de recherche documentaire, il est temps de se lancer sur le terrain. Il existe plusieurs méthodes de recherche qualitative présentées au début de ce chapitre. Cependant, nous avons choisi de privilégier celle de l’entretien semi-directif sur laquelle nous reviendrons donc plus en détails.
1. Méthodes de recherche qualitative
Il existe quatre grandes familles de recherche : a. Entretien non-directif
Mené comme une discussion libre, il s’agit d’un échange entre l’interviewé et l’intervieweur autour d’un thème générique. Ce type de discussion va donc suivre librement le raisonnement de l’interviewé.
b. Entretien de groupe
Aussi connu sous le nom de « focus group », ce procédé consiste à rassembler plusieurs personnes autour d’une thématique et de lancer une discussion. Un modérateur est présent afin d’organiser le débat.
c. Observation
Cette méthode se veut très révélatrice des phénomènes qui nous entourent dans notre vie de tous les jours. Elle permet de décortiquer ce que l’on voit à travers une grille d’analyse. L’observation peut être participante ou non. Dans le cadre d’une observation participante, le chercheur interagit avec l’environnement étudié et devient donc partie intégrante de l’observation puisqu’il en modifie la nature. Au contraire, si la méthode retenue est celle de l’observation non participante, l’enquêteur se fait le plus discret possible et se tient en dehors du champ observé.
d. Entretien semi-directif
Fondée sur le même type d’interaction que l’entretien non-directif, celui de l’interview en face à face, cette méthode se veut tout de même plus construite. A travers l’élaboration d’une grille d’entretien préconstruite selon les axes de recherche retenus, l’intervieweur va diriger en partie l’entretien et s’appliquer à ce que chaque thème soit abordé.
Il est cependant important de ne pas être trop directif et de laisser le temps à l’interviewé de s’exprimer. Comme indiqué en début de chapitre, c’est ce type de méthode qui est privilégiée dans notre approche. Dans les parties suivantes, nous allons revenir sur l’élaboration de cette grille puis, sur la manière de conduire un entretien.
2. Construction de la grille d’entretien
A l’issue de la recherche documentaire, nous aurons dégagé différents axes de recherche. Il va maintenant s’agir de les exprimer sous forme de questions ouvertes. Contrairement aux questions fermées rencontrées en majorité dans les sondages quantitatifs, les questions ouvertes doivent permettre de lancer la discussion sur une thématique. On cherchera à savoir le « pourquoi » ou le « comment » d’un phénomène.
Il ne faut pas que la grille d’entretien soit trop longue, au risque de décourager l’interviewé… et l’intervieweur ! Une moyenne idéale se situe entre cinq et sept questions. Un moyen relativement facile est de procéder par axe. On cherche alors une ou deux questions par thématiques retenues puis, au besoin, on effectue un tri.
Avant de débuter la collecte effective des entretiens, il est important de tester sa grille. En effet, étant plongé dans le sujet de recherche, il peut arriver que l’on manque de distance et que certaines choses nous échappent. On peut par exemple avoir recours à un vocabulaire très spécifique ne correspondant pas à tous les publics. Ces tests doivent donc nous permettre de confronter notre grille à une situation réelle d’entretien et de détecter d’éventuel(s) problème(s) dans sa conception. A partir du moment où on estime que tout est au point, on peut débuter la récolte des données !
3. Echantillon et conduite d’entretien
Dans un premier temps, il est nécessaire de réfléchir aux personnes que l’on cherche à atteindre pour notre recherche. Par exemple, si l’on fait une étude sur les goûts musicaux chez les adolescents, on veillera à retenir des personnes issues d’horizons musicaux différents et à garder un certain équilibre entre les groupes. Pour une étude de ce type, on peut considérer avoir des résultats consistants en réalisant vingt à trente entretiens.
Lors de l’entretien, il faut toujours bien garder en tête les différentes questions composant notre grille. En effet, même s’il s’agit de questions ouvertes et que le but est d’amorcer le dialogue avec l’interviewé, il ne faut jamais perdre ses objectifs de vue. De plus, plus on connaît sa grille d’entretien, plus on peut prêter une réelle attention aux propos de la personne en face de nous. Il est très important de valoriser la personne interviewée ; c’est elle le centre de notre étude et ce sont ses opinions, motivations, comportements qui nous intéressent.
4. Analyse des entretiens
Une fois les entretiens réalisés et retranscrits, il s’agit d’analyser leur contenu. Ici, nous utiliserons les méthodes d’analyse de discours en recherchant les mots ou thèmes les plus récurrents. Il existe différents types d’outils pouvant aider à l’analyse de texte, plus ou moins ludiques, tels que le logiciel Sphinx ou encore Tagxedo qui permet de créer des nuages de mots. Néanmoins, ce type d’analyse ne nécessite pas l’utilisation de telles applications et peut aussi être mené manuellement ou à l’aide d’un tableur Excel comme présenté à la section 4.1.2 de ce travail.
3.2. Paper Methodology
In order to focus on individual behaviors, the author chose to use both qualitative and quantitative methodology in a complementary way. In fact, they don’t aim to achieve the same goal. Whereas quantitative authorizes to describe trends and generalize results from a sample to a population, qualitative tools aim to gain diversity and give the broadest view of a phenomenon.
Research started with a literature review on energy and behaviors topics in order to build a semi-directive interview schedule. Twenty-four semi-directive interviews of seven questions each have been submitted to people living in the Geneva area during months of October and November 2011. Questionnaire addressed perceptions, attitudes, information and behavior of the consumers. Objective of semi-directive interview technique consists of open-ended questions that give the interviewee the opportunity to talk and give his/her point of view, submit his/her habits, reflect on his/her behaviors, etc. The author aimed to obtain in-depth findings about consumer behavior from their perspective. A special attention has been put on interviewing men and female, house owners and tenants but also diverse ages in order to reach every part of the population. Author then analyzed all data to outline main topics and hypotheses were built from a synthesis.
After constructing these hypotheses, they were then tested in the quantitative part of our survey. It resulted in a 21-question questionnaire, including seven ethnology questions for statistical purposes such as age, sex, occupation, and house tenants or owners. The size of the sample was 495 questionnaires collected during the month of December 2011. We questioned people on their consumption habits of water, heating, and lighting, impact of an increase in prices for their consumption, elements that influence their attitude toward energy, use of electrical appliances and, finally, their knowledge of energy production sources.
4. Qualitative Research
To start the research and get in depth finding about people’s behavior, author started by using qualitative method. More specifically, it consisted in semi-directive interviews. This section will present data analysis and then propose hypotheses to be tested in the quantitative part of this paper.4.1. Data analysis
This section will start by presenting our sample characteristics and will address thematic issues, question by question after presenting how the author analyzed and classified qualitative data.
4.1.1. Ethnology questions
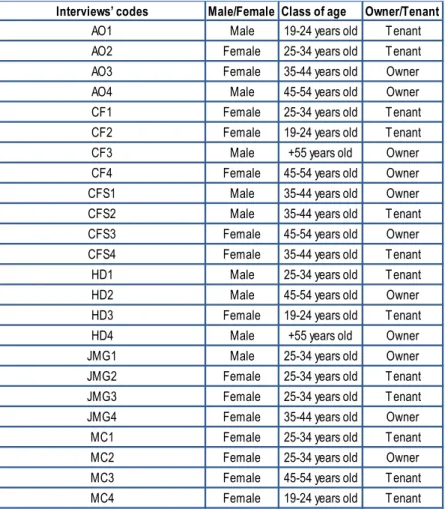
The interview schedule (Appendix I) consisted in 6 open-ended questions, plus a secondary one. It has been submitted to 24 people living in the Geneva area paying attention to their gender, age and whether they were owners or tenants. Table below sums up interviewees’ characteristics. As all interviews were anonymous, author used a code formed by interviewers’ initials and numbers.
Table 4.1. Interviewees’ characteristics
Interviews’ codes Male/Female Class of age Owner/Tenant
AO1 Male 19-24 years old Tenant
AO2 Female 25-34 years old Tenant
AO3 Female 35-44 years old Owner
AO4 Male 45-54 years old Owner
CF1 Female 25-34 years old Tenant
CF2 Female 19-24 years old Tenant
CF3 Male +55 years old Owner
CF4 Female 45-54 years old Owner
CFS1 Male 35-44 years old Owner
CFS2 Male 35-44 years old Tenant
CFS3 Female 45-54 years old Owner
CFS4 Female 35-44 years old Tenant
HD1 Male 25-34 years old Tenant
HD2 Male 45-54 years old Owner
HD3 Female 19-24 years old Tenant
HD4 Male +55 years old Owner
JMG1 Male 25-34 years old Owner
JMG2 Female 25-34 years old Tenant
JMG3 Female 25-34 years old Tenant
JMG4 Female 35-44 years old Owner
MC1 Female 25-34 years old Tenant
MC2 Female 25-34 years old Owner
MC3 Female 45-54 years old Tenant
4.1.2. Thematic issues
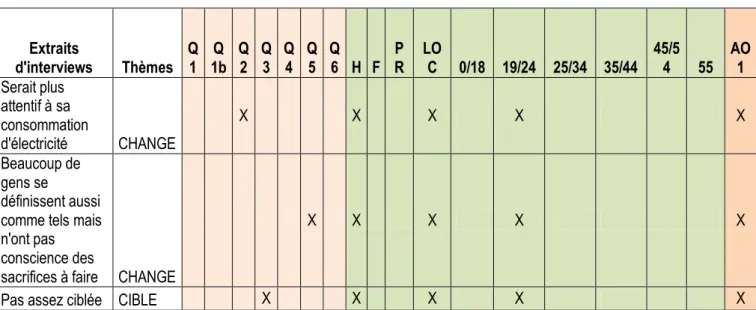
To carry out analysis of semi-directive interviews, the author used an Excel chart referencing interviews extract. Work consisted in a lexical analysis. As shown in Table 4.2 below, the author assigned a theme to each of them and also pointed out which interview and question it referred to.
Table 4.2. Sample of qualitative analysis file
Extraits d'interviews Thèmes Q 1 1b Q Q 2 Q 3 Q 4 Q 5 Q 6 H F PR LOC 0/18 19/24 25/34 35/44 45/54 55 AO 1 Serait plus attentif à sa consommation d'électricité CHANGE X X X X X Beaucoup de gens se définissent aussi comme tels mais n'ont pas conscience des
sacrifices à faire CHANGE
X X X X X
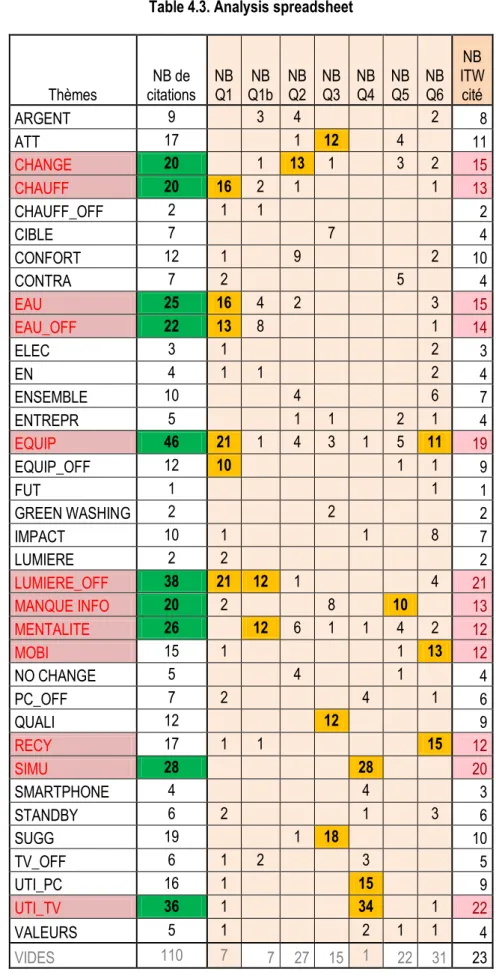
Pas assez ciblée CIBLE X X X X X Once all data compiled, the author summarized the whole collection on an analysis spreadsheet to facilitate an overall view as shown as in Table 4.3. He chose to highlight three different things:
Questions in which a theme was mentioned more than ten times (in orange) Themes that were mentioned more than twenty times (in green)
Themes mentioned by more than half of the interviewees (in red)
This ranking method enabled the author first to analyze data question per question and then, find out which of the themes were recurrent and more cited.
List of themes with labels’ definition is presented on Appendix II. As interviews have been conducted in French, analysis file and labels are also in French.
Table 4.3. Analysis spreadsheet Thèmes citations NB de NB Q1 Q1b NB Q2 NB NB Q3 NB Q4 NB Q5 NB Q6 NB ITW cité ARGENT 9 3 4 2 8 ATT 17 1 12 4 11 CHANGE 20 1 13 1 3 2 15 CHAUFF 20 16 2 1 1 13 CHAUFF_OFF 2 1 1 2 CIBLE 7 7 4 CONFORT 12 1 9 2 10 CONTRA 7 2 5 4 EAU 25 16 4 2 3 15 EAU_OFF 22 13 8 1 14 ELEC 3 1 2 3 EN 4 1 1 2 4 ENSEMBLE 10 4 6 7 ENTREPR 5 1 1 2 1 4 EQUIP 46 21 1 4 3 1 5 11 19 EQUIP_OFF 12 10 1 1 9 FUT 1 1 1 GREEN WASHING 2 2 2 IMPACT 10 1 1 8 7 LUMIERE 2 2 2 LUMIERE_OFF 38 21 12 1 4 21 MANQUE INFO 20 2 8 10 13 MENTALITE 26 12 6 1 1 4 2 12 MOBI 15 1 1 13 12 NO CHANGE 5 4 1 4 PC_OFF 7 2 4 1 6 QUALI 12 12 9 RECY 17 1 1 15 12 SIMU 28 28 20 SMARTPHONE 4 4 3 STANDBY 6 2 1 3 6 SUGG 19 1 18 10 TV_OFF 6 1 2 3 5 UTI_PC 16 1 15 9 UTI_TV 36 1 34 1 22 VALEURS 5 1 2 1 1 4 VIDES 110 7 7 27 15 1 22 31 23
Now, the author will carry out data analysis question per question and will discuss after recurring themes. Question 1
What are the reflexes you have in saving energy (water/electricity/heating)?
Two topics are mainly mentioned by interviewees with both 21 quotes: turning lights off and types of electrical appliances they decide to buy.
Turning lights off is often the first element given by interviewees and it seems like a large part of the population has really integrated this gesture in their behavior. Here are some relevant quotes to illustrate this observation: “Without hesitation: turn off the light” (Interview CF3)
(He snaps his fingers) It is to ensure turning off lights when leaving a room (Interview CFS2)
Regarding electrical appliances, people mentioned different topics. Firstly, they talk about the fact they have installed low consumption bulbs. Pay attention here that, as in many countries, you cannot find incandescent bulbs anymore on the market. Secondly, they refer to the use of power strip in order to completely switch off equipment when not used. The use of such equipment has also been classified in the “turning off electrical appliances”. Interviewees also referred to diverse appliances such as refrigerators, washing machines or dishwasher. They told that they prefer to buy more efficient appliances, talking about European Union Energy Label8. Even if prices can be higher, they believe that they would make sustainable savings. Owners also talked about the installation of photovoltaic panel.
Third and fourth topics have been raised sixteen times and concern water and heating savings. Regarding water, it is important to note that this theme refers to water consumption but does not include the gesture of turning off water which is another theme in itself that will be discussed later. The habit people talk about the most is the fact that they prefer to take shower instead of bath saying it saves a lot. It is also important to note that a few people do not make any effort towards water saving as interviewee CFS 2 who says “We have a lake full of water, why deprive?”.
Owners are more concerned with heating savings as they represent ¾ of quotes referring to that theme. They talk about using the sun when possible to warm their houses or cutting off heating in rooms where it is not necessary. A few tenants also talk about heating but it is obvious that they have less control on it except in buildings equipped with individual radiators “I rule on 3/5 thermostatic valves of my radiators” (Interview CFS2).
At the end, we find the two habits of turning water and electrical appliances off. Interviewees think of turning off water when brushing their teeth or washing dishes and speak about standby mode when mentioning electrical appliances but also “ghost energy” loss (Interview JMG4). Some of them especially mentioned energy consumed by cellular phones remained plugged in when not used.
It is interesting to point out that no one talked about money saving while evoking energy saving. Question 1b
Which of them have you received during your childhood?
That question reveals two main themes: “turning off the light” and “mentality”. In fact, both have been quoted 12 times.
As observed in question 1, turning off the light seems to be perfectly integrated since childhood. But the interesting finding of that question relies on the fact that people saying they haven’t received any reflex during their childhood mentioning “mentality” as a factor of education, are aged of 35 years old or more and/or referred to the specific area they grew up in. The author would like to highlight that there may be a link with the fact that first big concerns on energy savings started after the 1973 gas crisis. We can consider that it took a few years for people to integrate new behaviors.
Question 2
How would you handle the introduction of a quota of electricity? You would be entitled to a certain amount of electricity at a fixed price and then, beyond this threshold, you would be charged more for each unit consumed. (Would you be more careful? Would you change your behavior?)
A majority of people say they would make a change if needed. In the meantime they often consider that their actual behavior is already appropriate and they would only have to make small changes “Interviewee would make 2-3 efforts without radically change his lifestyle” (Interview CF1).
A few interviewees mentioned the importance of comfort and the fact that it could lead to a change in mentality. For some person, it is also really important to set on something that is fair and take into consideration specificity from each home (m2, number of adults and children, sick people, etc.).
Question 3
What do you think of the communication made today about energy consumption? (Technology, behavior ...) (Economy and reduction) (Are you sensitive? Is there enough? Is it attractive? Do you have a specific example?) Almost half of interviewees declare that they do not really pay attention to the communication made about energy consumption. Interviewee CFS4 for instance “doesn’t find the subject very attractive”. Regarding quality, people say that it has improved past years but it can still be more. It is important to point out that there are 8 quotes talking about a lack of information towards energy sources, tips to save energy or risks related to energy consumption.
In that question people evoked a few ideas to improve communication about energy. Firstly, three quotes suggest that communication should be more fun and involve people “It's good to educate people in a fun way with images and brochures” (Interview JMG2).
Secondly, some interviewees highlight the need to see what could result from a better use of energy “SIG (Geneva area energy provider) should educate us and show one how much waste of energy cost him” (Interview CFS1). Thirdly people mention the fact that there should be more advertisement or educational program on television, considering that nowadays, most of the people watch it daily especially at news time.
Question 4
Why do you turn on your TV / PC? (When?) (Some people leave the TV to simulate the presence or boost the mood, what do you think of this behavior?)
Most of the interviewee says they turn on TV when they want to watch something. Often, it is at night, back from work, to watch news and/or entertainment programs. 8 people say they really don’t understand people who leave their television on when not watching it while 7 say that if even if they don’t do it, they can imagine why a person would act that way. 5 interviewees say they keep television turning when they are alone at home.
People say they use more and more their PC’s, mainly to work, study, check their emails or go on social networks. The interesting thing to note here is that a few interviewees say they now use a lot their smartphones and this tend to substitute their PC’s for different type of tasks.
Question 5
We use more and more electrical appliances while at the same time, we speak of a nuclear phase-out. What do you think?
It is interesting to highlight the fact that many interviewees say they miss information to answer that question. Interviewee MC3 says that “he only heard about Fukushima” while interviewee HD1 just says “I have no idea”. It is hard for them to figure out the link between nuclear production and energy consumption. They don’t know that around 40% of Swiss energy consumption results from nuclear activity.
Some express the desire of a better communication on how politics think that nuclear can be replaced arguing that we should find a solution before planning to get rid of nuclear.
Question 6
How would you define an eco-friendly behavior?
There are three behaviors that seem to define eco-friendly behavior. Firstly, interviewees mention recycling, then mobility and finally electrical appliances. Mobility refers to the fact that eco-friendly person use bikes or public transportation instead of personal cars and electrical appliances refers to the number of devices owned by a
It is relevant to highlight here that this question is, with question 1, the one that had the most various answers with 22 of main themes quoted and 31 non-classified answers. This highlight the fact that eco-responsibility is the fact of paying attention to one’s whole behavior, energy consumption, water, mobility, recycling, equipment, etc.
4.1.3. Analysis of recurrent themes
In this section, the author will shortly presents themes that have been mentioned 20 times or more and/or by more than half of interviewees.
Themes mentioned more than 20 times (second column number highlighted in green in Table 4.3) : CHANGE CHAUFF EAU EAU_OFF EQUIP LUMIERE_OFF MANQUE INFO MENTALITE SIMU UTI_TV
Among those themes, it is important to distinguish those that came spontaneously in interviewees’ mind and those that were suggest by the question. SIMU and UTI_TV are part of that second category, thus author will not take them into consideration as important themes revealed by interviews.
First theme that has been the most cited is EQUIP, highlighting the fact that people are aware that there are different technologies to satisfy their need. Most of the time they also mention the fact that buying more efficient appliances leads to spending more money.
CHAUFF, EAU, EAU_OFF and LUMIERE OFF can be grouped in one category that is types of household energy consumption. CHAUFF_OFF and LUMIERE can be added to those categories. The interesting thing to note is that behaviors related to heating are the less mentioned during interviews. In fact, 22 quotes talk about this theme, while 47 talk about water and 40 about lightning.
Related to state of mind, MENTALITE has been quoted 26 times and CHANGE 20 times. This shows that consumption behaviors are linked with time period in which people have been raised up or in which they live. CHANGE seems to suggest that nowadays people are aware that there is a need for change and they seem to be ready for it.
Lastly, with 20 quotes, MANQUE_INFO is a crucial theme which reveals that interviewees often consider they do not have access to information about energy consumption but also about energy in general. There are two main reasons for that lack of knowledge: they do not know where to find the information or they do not have interest for information they receive.
To conclude this section, author will now list themes cited by half or more of the interviewees, trying to show trends in discussion about energy consumption. Those data are in red in Table 4.3’s last column.
CHANGE CHAUFF EAU EAU_OFF EQUIP LUMIERE_OFF MANQUE INFO MENTALITE MOBI RECY SIMU UTI_TV
Again, author chooses to exclude SIMU and UTI_TV themes that are suggested by the question. One can see that other themes are the same as most quoted except MOBI and RECY. This shows that people consider energy consumption in a large way and are aware that the way they travel or how they recycle has an influence on total energy consumption.
4.2. Main findings
In this section, author sums up findings of question analysis. Lexical analysis enabled us to highlight seven main ideas regarding interviewees’ behavior. Here are the seven findings:
a) People tend to pay more attention to their energy consumption when it’s visible b) Behaviors learned during childhood are the one people retain through their adult life c) People are ready to make little changes to avoid paying more
d) Television is the best media to inform people about energy saving e) People make rational use of television and computer
f) People lack information about their energy production sources g) Being eco-friendly means thinking about every types of consumption
In the next chapter, author will use a quantitative questionnaire in order to test those findings and see if they can be generalized.
5. Quantitative Research
After analyzing qualitative data and proposed different hypotheses to be tested, author developed a quantitative survey. Questionnaire consisted on 12 close-ended question, 1 open-ended question and 7 ethnology questions for statistical purposes such as age, sex, occupation, and house tenants or owners. It has been submitted to 495 people living in the Geneva area.5.1. Data analysis
First of all, author will take on question per question and give descriptive statistic results. When relevant, there will be crossed analysis but first, we will start by presenting our sample with ethnology questions’ results.
5.1.1. Ethnology questions
This section presents results of questions 14 to 21. Ethnology questions enabled the author to check if there were any personal factors that affect energy consumptions behaviors, such as age or earning for instance. Those data will be used lately when relevant.
Graph 5.1. Question 14 – Gender Graph 5.2. Question 17 – Owner or Tenant
We questioned people if they were fully, partly or not responsible for costs associated with energy consumption. The aim was to find if there is a link between the way people behave and what they pay for.
Graph 5.3. Question 18 – Are you responsible for costs associated with energy consumption of your home?
52% 48% Female Male 74% 26% Tenant Owner 54% 26% 20% Fully Partly No
Graph 5.4. Question 20 – What is your current job profile?
In the above graphpeople who checked “Other” are all part-time students.
Next question ask for interviewees’ revenue. It will help the author to see if there is a link between financial factors and energy consumption behavior. As this question was facultative, sampling is downsized to 291 valid questions.
Graph 5.5. Question 21 – What is the annual gross income of your household? 3% 21% 53% 10% 4% 5% 2% 3% 0.0 10.0 20.0 30.0 40.0 50.0 60.0 15% 21% 25% 12% 11% 15% 0.0 5.0 10.0 15.0 20.0 25.0 30.0 Less than CHF 50'000 CHF 50'000to CHF 75'000 CHF 75'000 CHF 100'000 CHF 100'000to CHF 125'000 CHF 125'000 to CHF 150'000 More than CHF 150'000
Last ethnographic question asked people their age. When comparing results with those from Geneva Statistic Office, author noted sampling gaps. In order to have results one can really rely on, this sampling gap should be corrected by statistic methods. Gross results will be used for this analysis.
Graph 5.6. Question 15 – In what year were you born?
1% 19% 30% 18% 17% 15% 0.0 5.0 10.0 15.0 20.0 25.0 30.0 35.0 1993-1997 1987-1992 1977-1986 1967-1976 1957-1966 1956 and before
5.1.2. Thematic issues
This section presents results, question per question, grouping them in themes as done during questionnaire’s construction.
Questions 1, 2 and 3
1) On what behaviors do you pay the most attention to in order to save water? 2) On what behaviors do you pay the most attention to in order to save heating? 3) On what behaviors do you pay the most attention to in order to save electricity?
Author chose to group the first three questions as they all refer to the a) hypothesis saying that:
People tend to pay more attention to their energy consumption when it’s visible.
Before explaining how they are related to that hypothesis, we will have a look separately on each question with descriptive statistics, starting with question 1 focusing on water saving.
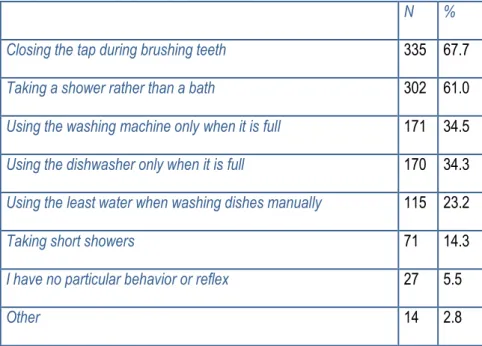
Table 5.1. Question 1 – On what behaviors do you pay the most attention to in order to save water?
N %
Closing the tap during brushing teeth 335 67.7
Taking a shower rather than a bath 302 61.0
Using the washing machine only when it is full 171 34.5
Using the dishwasher only when it is full 170 34.3
Using the least water when washing dishes manually 115 23.2
Taking short showers 71 14.3
I have no particular behavior or reflex 27 5.5
Other 14 2.8
Around two thirds of respondents say they close the tap during washing their teeth and around the same percentage say the prefer taking a shower rather than a bath. Approximately one third of the sample then mention the way they use washing appliances, both for dishes and clothes. Only 5.5% declare they have no particular reflex regarding that topic.
Question 2 was formulated the same way but was addressing heating savings behaviors.
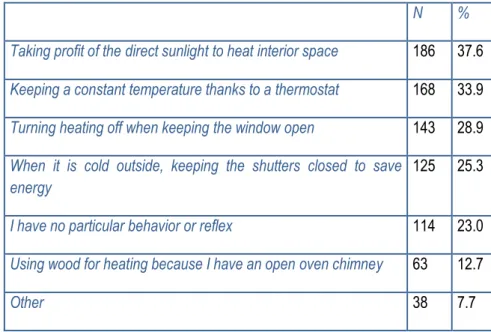
Table 5.2. Question 2 – On what behaviors do you pay the most attention to in order to save heating?
N %
Taking profit of the direct sunlight to heat interior space 186 37.6
Keeping a constant temperature thanks to a thermostat 168 33.9
Turning heating off when keeping the window open 143 28.9
When it is cold outside, keeping the shutters closed to save energy
125 25.3
I have no particular behavior or reflex 114 23.0
Using wood for heating because I have an open oven chimney 63 12.7
Other 38 7.7
One can note that there are less differences between respondents’ answers, which means that there is not one specific behavior that really takes advantage on other. It is important to observe that 23% of sample declare they have no particular reflex in order to save heating.
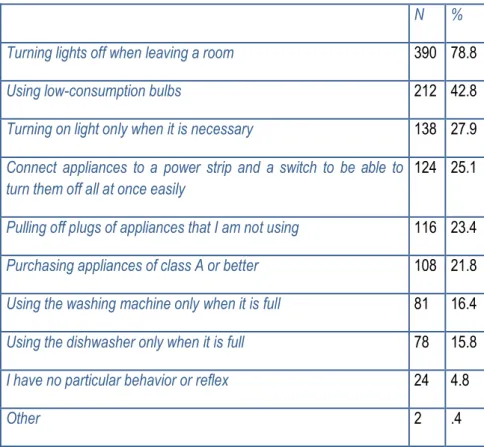
Finally, question 3 also addressed savings behaviors but regarding electricity. Here, as in question 1, there are again big differences in answers. Turning off light when leaving a room comes first with around 80% and using low-consumption is second with around 40%. The four next answers come with 30% to 20% and then one find use of washing appliances with around 15%. Only 4.8% declare they have no particular behavior regarding electricity savings.
Table 5.3. Question 3 – On what behaviors do you pay the most attention to in order to save electricity?
N %
Turning lights off when leaving a room 390 78.8
Using low-consumption bulbs 212 42.8
Turning on light only when it is necessary 138 27.9
Connect appliances to a power strip and a switch to be able to turn them off all at once easily
124 25.1
Pulling off plugs of appliances that I am not using 116 23.4
Purchasing appliances of class A or better 108 21.8
Using the washing machine only when it is full 81 16.4
Using the dishwasher only when it is full 78 15.8
I have no particular behavior or reflex 24 4.8
Other 2 .4
Regarding hypothesis a) in section 4.2, advancing that people tend to pay more attention to their energy
consumption when it’s visible, it is interesting to look at people answering they have no particular behavior to
those three questions.
For water and electricity, that are the two visible energy consumptions, we had respectively 5.5% and 4.8% of people ticking that answer. When it comes to heating, which is the invisible energy consumption, there are 23% of answerers saying they have no particular reflex. It seems we can conclude visibility of energy is an important factor to facilitate savings.
Question 4
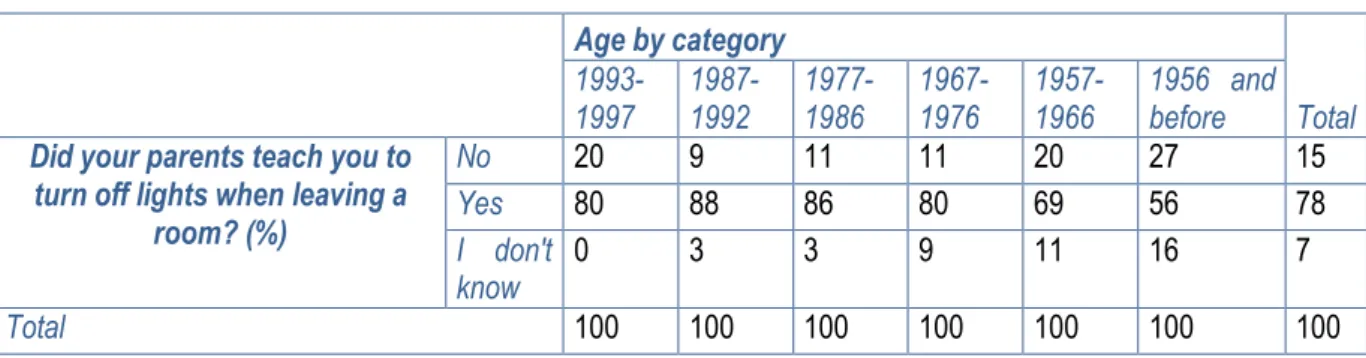
Did your parents teach you to turn off lights when leaving a room?
That question had the purpose to find out whether turning off lights when leaving a room is an educational gesture or not. As one can see in Table 5.6below, 78% of respondents said their parents taught them this habit during their childhood while only 7% said they didn’t.
Table 5.6. Questions 4 and 15 –
Did your parents teach you to turn off lights when leaving a room? and In what year were you born?
Age by category
Total
1993-1997 1987-1992 1977-1986 1967-1976 1957-1966 1956 and before
Did your parents teach you to turn off lights when leaving a
room? (%) No 20 9 11 11 20 27 15 Yes 80 88 86 80 69 56 78 I don't know 0 3 3 9 11 16 7 Total 100 100 100 100 100 100 100
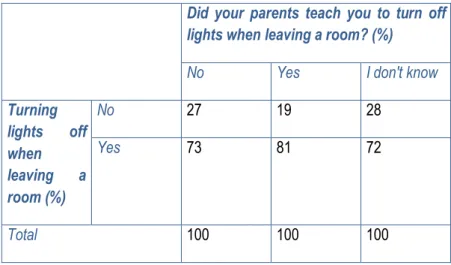
After crossing question 4 with ages of respondents, it seems like there has been a growing attention through years regarding energy consumption for lightning. In fact, only 56% of people born in 1956 or before said they learned that habit when they were children. For people born from 1967, this percentage rises up to 80% or more. Author then crossed question 4 with question 3 answer “Turning off lights when leaving a room” to verify the hypothesis b) advancing that behaviors learned during childhood are the one people retain through their adult life.
Table 5.7. Questions 3 and 4 – Did your parents teach you to turn off lights when leaving a room? and Turning lights off when leaving a room
Did your parents teach you to turn off lights when leaving a room? (%)
No Yes I don't know
Turning lights off when leaving a room (%) No 27 19 28 Yes 73 81 72 Total 100 100 100
There is a bigger percentage of respondents turning lights off also answering their parents taught them that habit when they were children. Nevertheless, the difference with people declaring they didn’t get that habit during their childhood is too little to confirm the above hypothesis b) formulated in section 4.2.
Question 5
Should electricity price be doubled, would this influence your behavior?
As there is a broad range of literature arguing price is not anymore a good incentive to change people’s behavior, we wanted to discuss that question.
Graph 5.7. Question 5 – Should electricity price be doubled, would this influence your behavior?
Results seem to show that people are still sensitive to prices. Around 80% say they would likely or most likely change their behavior for a doubling of prices. Such results show that people are ready to make little changes to avoid paying more. Nevertheless, when crossing this question with question 18 asking if people are fully, partly or not in charge of costs associated, one can note that the more people pay for energy, the more they are ready to change.
Table 5.8. Question 5 and 18 – Should electricity price be doubled, would this influence your behavior? and Are you responsible for costs associated with the energy consumption of your home?
Q. 18 - Are you responsible for costs associated with the energy consumption of your home? (%)
Fully Partly No Q.5 - Should electricity price be doubled, would this influence your behavior? Most likely 40 36 33 Likely 36 45 59 It is unlikely 19 14 5 I wouldn't change anything 5 5 3 Total 100 100 100 38% 43% 15% 5%
Question 6 and 7
6) Among the following elements, which ones would mostly influence your behavior?
7) In your opinion, which advertisement media is the most efficient to sensitize people to their electricity consumption?
Author choses to group results of those two questions as both tend to address hypothesis d) arguing that television is the best media to inform people about energy saving.
First, question 6 tried to understand which vector was the most influential for one’s behavior. Table 5.9. Question 6 – Among the following elements, which ones would mostly
influence your behavior?
Effectives Percentage
Valid percentage
Cumulative percentage Valid Friends / Family
advices 67 13.5 13.6 13.6 Education 120 24.2 24.3 37.9 Advertisement 9 1.8 1.8 39.7 Information’s (TV, radio, newspapers) 88 17.8 17.8 57.5 My personal values 198 40.0 40.1 97.6 Other 12 2.4 2.4 100.0 Total 494 99.8 100.0
Missing Missing system 1 .2
Total 495 100.0
People say that their personal values (40.1%) and their education (24.3%) are the two elements influencing the most their behavior towards energy consumption. It is interesting to note that 17.8% declare that information is the third vector that influences them.
Question 7 focused more on the information category mentioned above. It aimed to find out which media was the best to communicate and sensitize people to energy consumption in order to know if television was the most recurrent answer.
Table 5.10. Question 7 – In your opinion, which advertisement media is the most efficient to sensitize people to their electricity consumption?
Effectives Percentage Valid percentage Cumulated percentage Valid Television 335 67.7 67.8 67.8 Internet 27 5.5 5.5 73.3 Radio 18 3.6 3.6 76.9 Providers' advertisement 82 16.6 16.6 93.5 Advertisement in public transportation 11 2.2 2.2 95.7 Other 21 4.2 4.3 100.0 Total 494 99.8 100.0 Missing Missing system 1 .2 Total 495 100.0
Clearly, television is said to be the best way to communicate with people. In Switzerland, there is a very little communication through that media.
Author crossed this question with age’s categories as we might expect difference of favorite media for different generation. This didn’t lead to relevant results.
Question 8
Let's suppose government has no choice but to ration quantity of distributed electricity. Would you pay more in order to consume more?
This question, as question 5, also addressed prices. It wanted to find out whether people would prefer to pay more and keep the same comfort or change their behavior. Author crossed those two questions in order to check if people who would agree to pay more are the same who won’t change their behavior if electricity price should be doubled, and vice-versa. This crossing didn’t give any consistent results but this might be related to question’s formulation.
Graph 5.8. Question 8 – Let's suppose government has no choice but to ration quantity of distributed electricity. Would you pay more in order to consume more?
A majority (55%) of respondents say they are not ready to pay more. This may suggest that they are ready to adjust their behavior in order to consume only the amount they would receive.
As there is around 30% saying they don’t know, we can consider that this question may be a little too vague for people to take position.
55% 17% 27% No Yes I don't know
Question 9
In your opinion, what actions best characterize eco-friendly behavior?
There is a big trend about eco-friendly behavior. But what does this term evokes for people? That is the purpose of that question. In the qualitative part, we have seen that people think there are a lot of things to care about to act in a eco-friendly way. This leaded to hypothesis g) arguing that being eco-friendly means thinking about every
types of consumption.
Table 5.11. Question 9 – In your opinion, what actions best characterize eco-friendly behavior?
N %
Sorting waste 400 80.8
Educate future generations 265 53.5
Using public transportation 176 35.6
Using car as little as possible 176 35.6
Taking shower rather than bath 109 22.0
Using a bicycle 76 15.4
Consuming organic products 53 10.7
Buying second-hand products 22 4.4
Other 14 2.8
First answer comes far before others and is related to waste management. In fact, Switzerland is known to pay a lot of attention to that point and people are used to sort waste.
Around 50% think that being eco-friendly also means educating future generation. We can relate this answer to the theme of MENTALITE mentioned in the qualitative part.
As in the qualitative interviews, mobility concerns come right after with around 30% of answers for “Using public transportation” and “Using car as little as possible”. Water savings concern 22%.
Question 10
What makes you turn your television on?
People often make irrational use of devices. Author wanted to question the “relation” people have with their television, namely if they turn it on to watch it or if they just let it on to simulate a presence. Qualitative survey enabled author to draw the hypothesis e): people make rational use of television and computer.
Table 5.12. Question 10 – What makes you turn your television on?
N %
Entertainment (movies, series, variety show, etc.) 356 71.9
Need for information 275 55.6
Need for company 48 9.7
I turn it on without thinking, as a daily activity 44 8.9
Other 36 7.3
To keep children busy 20 4.0
Results clearly show that “Entertainment” and “Need for information” are the two main reasons for which people turn on their television (respectively 71.9% and 55.6%). Only 9.7% ticked “Need for company”.
In that way, one can consider that as proposed by the above hypothesis, people tend to make a rational use of their television.
It is also interesting to note that television is firstly associated to entertainment. This remark has to be associated with previous results suggesting television is the best media to communicate on energy consumption and that this communication has to be entertaining and funny (qualitative survey, question 3).
Question 11 and 12
11) What does a car represent for you? (Give maximum 3 elements) 12) Do you own a car?
We know that mobility plays a huge role in energy consumption. But with hundreds of existing model, car cannot anymore be considered just as a mean of transport. In order to understand how people consider cars we asked them to give 3 elements to express what a car means to them in question 11. Then, in question 12, we asked them whether they own a car or not.
Graph 5.9. Question 12 – Do you own a car?
The percentage we got is close to official statistics for Geneva area. In fact, in 2005, 24% of households owned at least one car9
.
In order to address open-ended question 11, author used the online word cloud tool Tagxedo
10. This
tool aggregates the list of all words and gives them a weight according to their number of occurrences.
After copying all the words on the window, you can select the ones you want to take off (determinant for
instance) and it gives you all the words from the most used to the least one. Then it results in a word
cloud.
9 STATISTIQUES CANTONALES. REPUBLIC ET CANTON DE GENEVE. Coup d’œil, Juin 2009. (accessed May 10, 2012) 10 TAGXEDO. http://www.tagxedo.com/ (accessed August 20, 2012)
27%
73%
No Yes
Here is the word cloud including everyone’s answers:
Figure 5.1. Question 11 – What does a car represent for you? Word cloud
The first ten words that people use (whether they have a car or not) are:
1. Transport
2. Freedom
3. Travel
4. Independence
5. Comfort
6. Work
7. Autonomy
8. Practice
9. To travel
10. Fast
In a previous research, Rocci (2007) determined five words representing car: freedom, sensation,
pleasure, flexibility and control. Our results go in the same direction. When it comes to differentiate
answers from people who own a car or not, one can note a difference of perception when people do not
have a car. Words like “pollution”, “city” or “nothing” appears on top of the list.
Figure 5.2. Question 11 and 12 – What does a car represent for you? and Do you own a car? Word cloud
Question 13
13) Do you know the production source of your electricity?
13a) If not, would you like to know the production source of your electricity? 13b) If yes, what is in your opinion the ratio of each source? Total = 100 %
Last question addressed the hypothesis that people lack information about their energy production sources. This question seems important while Switzerland, as many other countries, is facing debates about nuclear energy production and eventual substitute.
First, we asked respondents if they know the production source of their electricity. Around 75% of them say they don’t. Those 75% where then asked if they would like to get that kind of information and 66% say they would. It is clearly a will of getting more information about that topic.
Graph 5.10. Question 13 – Do you know the Graph 5.11. Question 13a – Would you like to know production source of your electricity? the production source of your electricity?
The 25% of respondents who answered they knew the production sources of their electricity were asked to number the three production sources represented by:
fossil energy (coal, oil, gas), nuclear energy,
renewable energy (hydro, solar, wind, biomass)
Author calculated the mean of every answer. Results are presented on Graph 5.12. 74% 26% No Yes 34% 66% No Yes
Graph 5.12. Question 13b – What is in your opinion the ratio of each energy sources in your electricity?
As categories in official statistics are stated differently, it is hard to make precise comparison. Nevertheless, renewables are underestimated as hydroelectricity accounts for 53.7% of energy consumption in Switzerland in 201111.
5.2. Main findings
In this section, author sums up findings of quantitative questionnaire data analysis. We will also draw links with hypothesis obtained from qualitative data, presented in section 4.2.
Quantitative questionnaire examined different aspects of energy consumption behavior. With the first three questions, we found that people pay more attention to energy savings when their consumption is visible. This seems to confirm hypothesis a), which stated: People tend to pay more attention to their energy consumption
when it’s visible.
We also questioned people about their lighting behavior. Crossing education with ages seems to show a growing tendency through the years to sensitize children about turning off the light when leaving a room. When crossing adult behavior with education of turning light off, there is a bigger percentage of people who learned that gesture during their childhood that do it as an adult. However, this difference is not big enough to go in direction of hypothesis b): Behaviors learned during childhood are the one people retain through their adult life.
28%
31% 42%