HAL Id: tel-02897366
https://hal.archives-ouvertes.fr/tel-02897366
Submitted on 11 Jul 2020HAL is a multi-disciplinary open access archive for the deposit and dissemination of sci-entific research documents, whether they are pub-lished or not. The documents may come from teaching and research institutions in France or
L’archive ouverte pluridisciplinaire HAL, est destinée au dépôt et à la diffusion de documents scientifiques de niveau recherche, publiés ou non, émanant des établissements d’enseignement et de recherche français ou étrangers, des laboratoires
human visual perception modeling and applications
Lu Zhang
To cite this version:
Lu Zhang. Image Quality Assessment and Saliency Detection: human visual perception modeling and applications. Signal and Image Processing. Université de Rennes 1 (UR1), 2020. �tel-02897366�
HABILITATION
À DIRIGER DES RECHERCHES
Spécialité : Signal, Image, Vision
Présentée par :
Lu ZHANG
Image Quality Assessment and Saliency Detection:
human visual perception modeling and applications
soutenue le 07/02/2020 devant le jury composé de :
Ce ZHU, Professor, University of Electronic Science & Technology of China, China Frederic DUFAUX, DR, L2S - CentraleSupelec - Université Paris-Sud, France Daiqin YANG, Tenured associate professor, Wuhan University, China
Patrick LE CALLET, Professeur, Université de Nantes, France Olivier LE MEUR, MCF avec HDR, Université de Rennes 1, France Luce MORIN, Professeur, INSA Rennes, France
A
CKNOWLEDGEMENT
Via this synthesis document of my research in preparation for my Habilitation degree (Habilitation à Diriger des Recherches), I would like to express my sincere gratitude towards all the doctors I co-supervised: Shishun TIAN, Qiong WANG, Meriem Outtas, Ines Saidi, Maxime Bichon, as well as the PhD students I currently co-supervise: Fang-Yi Chao, Théo Ladune. I am also very thankful for the directors of these theses: Olivier Déforges, Luce Morin, and Kidiyo Kpalma, who helped a lot all along the way. Without them, nothing presented in this manuscript would have been possible.
Thanks also to all the researchers that I met/collaborated during thesis meetings, project meetings and conferences for sharing their knowledges and insightful thoughts. My appreciation also goes to all my colleagues from the VAADER team of IETR, for their friendships, the good working environment and the pleasure time.
I would also like to acknowledge all the foreigner researchers with whom I have closely collaborated, from Southeast University, Shenzhen university, East China Uni-versity of Technology, Cardiff UniUni-versity, for their friendships, fruitful discussions, and enjoyable collaborations.
Last but not least, I would like to thank my husband and my parents for their un-ceasing support, as well as my three children whose smiles and loves are worth it all.
L
IST OF
P
UBLICATIONS
Peer-reviewed journal papers [IF=Impact Factor]:
[1] Y. Gu, H. Tang, T. Lv, Y. Chen, Z. Wang, L. Zhang, et al. “Discriminative
fea-ture representation for Noisy image quality assessment”. Multimedia Tools and Applications; January 2020. [IF=2.101]
[2] A. F. Perrin, V. Krassanakis, L. Zhang, V. Ricordel, M. P. Da Silva, O. Le Meur.
“EyeTrackUAV2 : a Large-Scale Binocular Eye-Tracking Dataset for UAV Videos”. Drones; 2020.
[3] Q. Wang,L. Zhang, W. Zou, K. Kpalma. “Salient video object detection using a
virtual border and guided filter”. Pattern Recognition; Volume 97, January 2020, 106998. [IF=5.898]
[4] H. Zhu, D. Tong,L. Zhang, et al. “Temporally Downsampled Cerebral CT
Perfu-sion Image Restoration Using Deep Residual Learning”. International Journal of Computer Assisted Radiology and Surgery; October 2019; 1-9. [IF=2.155]
[5] Y. Gao, Y. Song, X. Yin, W. Wu, L. Zhang, Y. Chen, W. Shi, “Deep
learning-based digital subtraction angiography image generation”. International Journal of Computer Assisted Radiology and Surgery; July 2019; 1-10. [IF=2.155]
[6] L. Zhang, I. Saidi, S. Tian, V. Barriac, O. Déforges, “Overview of full-reference
video quality metrics and their performance evaluations for videoconferencing application”. J. Electron. Imaging; March 2019; 28(2), 023001. [IF=0.924]
[7] T. Wang, L. Zhang, H. Jia. “An effective general-purpose NR-IQA model using
natural scene statistics (NSS) of the luminance relative order”. Signal Processing: Image Communication; February 2019; 71:100-109. [IF=2.814]
[8] W. Zou, Z. Zhuang, S. Jiao,L. Zhang, K. Kpalma. “Image Steganography Based
on Digital Holography and Saliency Map”. Optical Engineering; January 2019; 58(1), 013102. [IF=1.209]
[IF=4.098]
[10] S. Tian, L. Zhang, L. Morin, O. Déforges. “A benchmark of DIBR Synthesized
View Quality Assessment Metrics on a new database for Immersive Media Ap-plications”. IEEE Transactions on Multimedia; October 2018; 21(5): 1235 - 1247. [IF=5.452]
[11] C. Xiang, L. Zhang, Y. Tang, W. Zou, C. Xu. “MS-CapsNet: A Novel Multi-Scale
Capsule Network”. IEEE Signal Processing Letters; October 2018; 25(12):1850-1854. [IF=3.268]
[12] M. Outtas,L. Zhang, O. Déforges, A. Serir, W. Hammidouche, Y. Chen.
“Subjec-tive and Objec“Subjec-tive Evaluations of feature selected Multi Output Filter for Speckle reduction on Ultrasound Images”. Physics in Medicine and Biology; August 2018; 63(18):185014. [IF=3.03]
[13] S. Tian,L. Zhang, L. Morin, O. Déforges. “NIQSV+: A No Reference Synthesized
View Quality Assessment Metric”. IEEE Transactions on Image Processing; De-cember 2017; 27(4):1652-1664. [IF=6.79]
[14] Y. Chen,L. Zhang, W. Yuan, et al. “Extended PCJO for the detection-localization
of hypersignals and hyposignals in CT images”. IEEE Access; June 2017; 5(99):24239-24248. [IF=4.098]
[15] T. Wang, L. Zhang, H. Jia, et al. “Multiscale contrast similarity deviation: an
ef-fective and efficient index for perceptual image quality assessment”. Signal Pro-cessing: Image Communication; April 2016; 45:1-9. [IF=2.814]
[16] T. Wang, L. Zhang, H. Jia, Y. Kong, B. Li, H. Shu. “Image quality assessment
based on perceptual grouping”. Journal of Southeast University (English Edition); March 2016; 32(1):29-34. [IF=0.12]
[17] L. Zhang, C. Cavaro-Ménard, P. Le Callet. “An overview of model observers”.
In-novation and Research in BioMedical engineering (IRBM); June 2014; 35(4):214-224. [IF=0.934]
[18] D. GE,L. Zhang, C. Cavaro-Ménard, P. Le Callet. “Numerical Stability issues on
Channelized Hotelling Observer under different background assumptions”. Jour-nal of the Optical Society of America A (JOSA A); April 2014; 31(5):1112-1117. [IF=1.861]
[19] L. Zhang, B. Goossens, C. Cavaro-Ménard, P. Le Callet, D. GE. “Channelized
model observer for the detection and estimation of signals with unknown ampli-tude, orientation, and size”. Journal of the Optical Society of America A (JOSA A); November 2013; 30(11):2422-32. [IF=1.861]
[20] L. Zhang, C. Cavaro-Ménard, P. Le Callet, J. Tanguy. “A Perceptually relevant
Channelized Joint Observer (PCJO) for the detection-localization of parametric signals”. IEEE Transactions on Medical Imaging; October 2012; 31(10):1875-1888. [IF=7.816]
International conference papers:
[1] J. Chen,L. Zhang, C. Bai, K. Kpalma. “Review of Recent Deep Learning Methods
for Image-Text Retrieval”. IEEE 3rd International Conference on Multimedia Infor-mation Processing and Retrieval (MIPR), April 2020, Shenzhen, China. (Invited Paper)
[2] Y. Zhang, L. Zhang, W. Hammidouche, O. Deforges. “Key Issues for the
Con-struction of Salient Object Datasets with Large-Scale Annotation”. IEEE 3rd Inter-national Conference on Multimedia Information Processing and Retrieval (MIPR), April 2020, Shenzhen, China.
[3] A. F. Perrin,L. Zhang, O. Le Meur. “How well current saliency prediction models
perform on UAVs videos?”. Computer Analysis of Images and Patterns (CAIP), September 2019, Salerno, Italy.
[4] I. Saidi,L. Zhang, O. Déforges, V. Barriac. “Laboratory and crowdsourcing
stud-ies of lip sync effect on the audio-video quality assessment for videoconferencing application”. ICIP, September 2019, Taipei, Taiwan.
and Image Processing (VCIP), December 2018, Taichung, Taiwan.
[6] F. Chao,L. Zhang, W. Hammidouche, O. Déforges. “SalGAN360: Visual Saliency
Prediction on 360 Degree Images with Generative Adversarial Networks”. ICME2018, July 2018, San Diego, California, USA.
[7] S. Tian,L. Zhang, L. Morin, O. Déforges. “Performance comparison of objective
metrics on free-viewpoint videos with different depth coding algorithms”. SPIE Optical Engineering + Applications, August 2018, San Diego, California, USA.
[8] I. Saidi,L. Zhang, O. Déforges, V. Barriac. “Machine learning approach for global
no-reference video quality model generation”. SPIE Optical Engineering + Appli-cations, August 2018, San Diego, California, USA.
[9] M. Bichon, J. Le Tanou, M. Ropert, W. Hammidouche, L. Morin, L. Zhang. “Low
Complexity Joint RDO of Prediction Units Couples for HEVC Intra Coding”. Pic-ture Coding Symposium (PCS), June 2018, San Francisco, California, USA.
[10] M. Outtas, L. Zhang, O. Déforges, W. Hammidouche, A. Serir. “Evaluation of
No-reference quality metrics for Ultrasound liver images”. QoMEX, May 29 - 31, 2018, Sardinia, Italy.
[11] L. Leveque, H. Liu, S. barakovic, J.B. Husic, A. Kumcu, L. Platisa, M. Martini,
R. Rodrigues, A. Pinheiro, M. Outtas,L. Zhang, A. Skodras. “On the Subjective
Assessment of the Perceived Quality of Medical Images and Videos”. QoMEX, May 29 - 31, 2018, Sardinia, Italy.
[12] M. Bichon, J. Le Tanou, M. Ropert, W. Hammidouche, L. Morin, L. Zhang. “Low
Complexity Joint RDO of Prediction Units Couples for HEVC Intra Coding”. ICASSP, April 2018, Calgary, Alberta, Canada.
[13] S. Tian,L. Zhang, L. Morin, O. Déforges. “A full-reference Image Quality
Assess-ment metric for 3D Synthesized Views”. Image Quality and System Performance Conference, at IS&T Electronic Imaging 2018, 28 January - 1 February 2018, Burlingame, California, USA.
[14] M. Outtas,L. Zhang, O. Déforges, A. Serir, W. Hammidouche. “Multi-output speckle
reduction filter for ultrasound medical images based on multiplicative multiresolu-tion decomposimultiresolu-tion”. ICIP, September 2017, Beijing, China.
[15] Q. Wang,L. Zhang, K. Kpalma. “Fast filtering-based temporal saliency detection
using minimum barrier distance”. ICME2017W, July 2017, Hong Kong, China.
[16] T. Xu,L. Zhang, Y. Chen, H. Shu, L. Luo. “Quality Assessment Based on PCJO
for Low-dose CT Images”. International Conference on Fully Three-Dimensional Image Reconstruction in Radiology and Nuclear Medicine (Fully3D), June 2017, Xian, China.
[17] I. Saidi, L. Zhang, O. Déforges, V. Barriac. “Evaluation of single-artifact based
video quality metrics in video communication context”. QoMEX, May 31 - June 2, 2017, Erfurt, Germany.
[18] M. Bichon, J. Le Tanou, M. Ropert, W. Hammidouche, L. Morin,L. Zhang.
“Inter-block dependencies consideration for intra coding in H.264/AVC and HEVC stan-dards”. ICASSP, March 2017, New Orleans, USA.
[19] S. Tian,L. Zhang, L. Morin, O. Déforges. “NIQSV: A No Reference Image
Qual-ity Assessment Metric for 3D Synthesized Views”. ICASSP, March 2017, New Orleans, USA.
[20] M. Outtas,L. Zhang, O. Déforges, W. Hammidouche, A. Serir, C. Cavaro-Menard.
“A study on the usability of opinion-unaware no-reference natural image quality metrics in the context of medical images”. 8th International Symposium on signal, Image, Video and Communications, November 2016, Tunis, Tunisia.
[21] I. Saidi,L. Zhang, V. Barriac, O. Déforges. “Audiovisual quality study for
videotele-phony on IP networks”. IEEE Workshop on Multimedia Signal Processing (MMSP), September 2016, Montreal, Canada.
[22] I. Saidi,L. Zhang, O. Déforges, V. Barriac. “Evaluation of the performance of
ITU-T G.1070 model for packet loss and desynchronization impairments”. QoMEX, June 2016, Lisbon, Portugal.
encing context”. QoMEX, June 2016, Lisbon, Portugal.
[24] L. Zhang, C. Cavaro-Ménard, P. Le Callet, D. GE. “A multi-slice model observer
for medical image quality assessment”. ICASSP, April 2015, Brisbane, Australia.
[25] T. Wang, H. Shu, H. Jia, B. Li,L. Zhang. “Blind Image Quality Assessment Using
Natural Scene Statistics in the Gradient Domain”. Asia Modelling Symposium, September 2014, Kuala Lumpur, Malaysia.
[26] C. Cavaro-Ménard, L. Zhang, P. Le Callet. “QoE for Telemedicine: Challenges
and Trends.” SPIE Optics + Photonics, August 2013, San Diego, USA.
[27] L. Zhang, C. Cavaro-Ménard, P. Le Callet. “Evaluation of HVS models in the
application of medical image quality assessment.” IS&T/SPIE Electronic Imaging, January 2012, California, USA.
[28] L. Zhang, C. Cavaro-Ménard, P. Le Callet. “Key issues and specificities for the
objective medical image quality assessment.” VPQM, January 2012, Scottsdale, Arizona, USA.
[29] L. Zhang, C. Cavaro-Ménard, P. Le Callet. “Using AUC to study perceptual
differ-ence model suitability for the detection task on MR image.” MIPS XIV Conferdiffer-ence, August 2011, Dublin, Ireland.
[30] L. Zhang, C. Cavaro-Ménard, P. Le Callet. “The effects of anatomical
informa-tion and observer expertise on abnormality detecinforma-tion task.” Proc. SPIE Medical Imaging, volume 7966, February 2011, San Diego, USA.
[31] C. Cavaro-Ménard, L. Zhang, P. Le Callet. “Diagnostic quality assessment of
medical images : Challenges and trends.” 2nd European Workshop on Visual Information Processing (EUVIP), July 2010, Paris, France.
French conference papers:
[1] I. Saidi,L. Zhang, O. Déforges, V. Barriac. “Evaluation de la qualité audiovisuelle
[2] M. Outtas, A. Serir, O. Déforges,L. Zhang. “Réduction de bruit multiplicatif dans
les images ultrasons basées sur la décomposition multiplicative multiresolution (MMD)”. CORESA, May 2016, Nancy, France.
[3] M. Schmidt, C. Cavaro-Ménard, L. Zhang, J. Tanguy, Le Callet. “Evaluation par
observateur numérique basé tâche de la qualité d’IRM compressées”. CORESA, May 2016, Nancy, France.
[4] L. Zhang, C. Cavaro-Ménard, P. Le Callet. “Pertinence des modèles du SVH pour
la sensation et la perception des images médicales.” Gretsi, September 2013, Brest, France.
[5] L. Zhang, C. Cavaro-Ménard, P. Le Callet. “Modèle numérique pour l’évaluation
objective de la qualité d’images médicales 2D.” Gretsi, September 2013, Brest, France.
The regularly updated list of my publications is available on: http://luzhang.perso.insa-rennes.fr/publications/.
T
ABLE OF
C
ONTENTS
Acknowledgement 1
List of Publications 3
Introduction 15
I
Image quality assessment
21
1 Image quality assessment basics 22
1.1 Subjective IQA basics . . . 22
1.1.1 Common elements in test protocols . . . 22
1.1.2 Test Methodologies . . . 23
1.1.3 Data Analyses . . . 24
1.2 Objective IQA basics . . . 25
1.2.1 Classifications of IQA methods . . . 25
1.2.2 Performance evaluation metrics . . . 27
2 Perceived quality for videophone application 29 2.1 Introduction . . . 29
2.2 Non-interactive subjective test . . . 30
2.2.1 Experimental set-up and recording . . . 30
2.2.2 Test conditions . . . 31
2.2.3 Methodology and test protocol . . . 32
2.2.4 Results and discussions . . . 33
2.3 Interactive subjective test . . . 35
2.3.1 Experimental set-up and recording . . . 35
2.3.2 Test conditions . . . 36
2.3.3 Methodology and test protocol . . . 37
2.4 Comparative study of existing FR VQA metrics . . . 43
2.4.1 Tested FR VQA metrics . . . 43
2.4.2 Test databases . . . 44
2.4.3 Performance comparison . . . 45
2.5 Conclusions and Perspectives . . . 49
2.6 Contributions in this field . . . 50
3 DIBR-synthesized view quality assessment 53 3.1 Introduction . . . 53
3.2 FR metrics: SC-DM and SC-IQA . . . 55
3.2.1 SC-DM . . . 55
3.2.2 SC-IQA . . . 58
3.3 NR metrics: NIQSV and NIQSV+ . . . 61
3.3.1 NIQSV . . . 61
3.3.2 NIQSV+: an extension of NIQSV . . . 63
3.4 Performance evaluation of four proposed metrics . . . 67
3.5 A new database for benchmarking DIBR algorithms . . . 70
3.5.1 Motivation of the new database . . . 70
3.5.2 Description of the new database . . . 71
3.5.3 DIBR algorithms benchmarking using our database . . . 76
3.6 Conclusions and Perspectives . . . 77
3.7 Contributions in this field . . . 77
II
Saliency detection
79
4 Saliency and salient object detection basics 80 4.1 Definitions . . . 804.2 Performance evaluation metrics for salient object detection . . . 81
4.3 Performance evaluation metrics for saliency detection . . . 82
5 Salient object detection in 2D natural videos 85 5.1 Introduction . . . 85
5.2 Comparative study of deep-learning based methods for video SOD . . . 86
5.2.1 Taxonomy of deep video SOD methods . . . 86
TABLE OF CONTENTS
5.3 Proposed methods for video SOD: VBGF and its extension VBGFd . . . 96
5.3.1 VBGF . . . 96
5.3.2 VBGFd . . . 105
5.3.3 Performance evaluation of VBGF and VBGFd . . . 105
5.4 Conclusions and Perspectives . . . 109
5.5 Contributions in this field . . . 110
6 Saliency prediction for omnidirectional images 111 6.1 Introduction . . . 111
6.2 SalGAN360: Saliency Prediction for omnidirectional images with Gener-ative Adversarial Network . . . 112
6.2.1 Multiple Cubic Projection . . . 113
6.2.2 Fine tuning of SalGAN . . . 113
6.2.3 Fusion method . . . 116
6.3 MV-SalGAN360: A multi-resolutional FoV extension of SalGAN360 with adaptive weighting losses . . . 117
6.3.1 Multi-resolutional FoV basis . . . 118
6.3.2 Adaptive Weighting . . . 120
6.4 Performance evaluation of two proposed methods . . . 121
6.4.1 Experimental Setup . . . 121
6.4.2 Ablation study for the MV-SalGAN360 . . . 123
6.4.3 Comparison with state-of-the-art . . . 125
6.5 Conclusions and Perspectives . . . 127
6.6 Contributions in this field . . . 130
III
Perspectives of research
131
7 Research project 133 7.1 Theme 1 Entertainment image quality assessment . . . 1347.1.1 Axis 1.1 Synthesized view quality assessment for light field images135 7.1.2 Axis 1.2 360◦ image/video quality assessment . . . 138
7.2 Theme 2 Saliency detection in images . . . 140
7.2.1 Axis 2.1 Salient objects detection in 360◦ image/video . . . 141
7.3 Theme 3 Medical image quality assessment . . . 145
7.3.1 State of the art . . . 145
7.3.2 Scientific challenges and Possible solutions . . . 145
7.3.3 Studied modalities . . . 146
7.4 Application - Image compression . . . 147
I
NTRODUCTION
This report, which constitutes a synthesis document of my research in preparation for my Habilitation degree (Habilitation á Diriger des Recherches), presents my research works since September 2013, when I joined the VAADER team of the IETR laboratory at INSA Rennes as a teacher-researcher (“Maître de conférences”).
Since I worked on the quality assessment of medical images based on human per-ception modeling during my PhD thesis (10/2009-11/2012), I have been going down along this research theme (human perception modeling and its applications), which did not exist yet in the VAADER team. The creation of this new theme is also desired by our team, since it has a strong relationship with two of the four main topics of our team:
• image analysis and understanding; • video representation and compression.
Note that whatever a new image analysis algorithm or a new video compression method is, it is necessary to use a quality assessment method to validate this new technique and "convince" the end-users. Meanwhile, the saliency information can benefit a wide range of applications related to the main topics of our team, e.g. image quality as-sessment, image segmentation, image compression, image rendering, object detec-tion and recognidetec-tion, visual tracking, etc. Thus I strengthened and extended the skills
in this theme within the team, by mainly working on the image quality assessment
and saliency detection. I taxonomically present my research themes and works in
Figure 1, as well as the postdocs, PhD students, master students I co-supervised (with a supervision rate > 33%) on each topic.
Forimage quality assessment, I have been working on four image/video types:
• Medical images: there are two schools for the medical image quality assessment, while one is the task-based approach, e.g. the anthropomorphic model observer (MO), the core of my PhD work; the other is the adaptation of natural image quality metrics. I then co-supervised three master students to further extend the MOs I proposed in the PhD thesis to more medical modalities and applications;
Image Quality Assessment for Medical Images M. Ou8as (2015-2018) M. Schmidt (2015) W. Yuan (2015) T. Xu (2016) for 2D Natural Images T. Wang (2014-2017) for Videophone ApplicaNons I. Saidi (2015-2018) for 3D Synthesized Views S. Tian (2015-2019) Saliency detecNon salient object for 2D Videos Q. Wang (2015-2019) for 360° Images F. Chao (2017-2020) for Drone Videos A. Perrin (2019-2020) applicaNon on Drone Video Compression G. Herrou (2019-2021)
Figure 1: Research work synthesis, where postdoc supervisions are indicated in purple, PhD supervisions are in red, non-official PhD supervisions (or collaborations) are in green, and non-official master supervisions are in blue.
as well as one PhD student to explore the adaptation of natural image quality metrics.
– with M. Schmidt, we worked on the application of the MO on the compression
of Magnetic Resonance (MR) images with JPEG2000. Three compression ratios were used and five radiologists had done the detection-localization di-agnostic task on the compressed images. The experimental results showed that the model observer worked in a similar way as the radiologists. This work is collaborated with my two PhD thesis supervisors and Angers Hos-pital in France. (1 conference paper is published and 1 journal paper is in preparation.)
– with W. Yuan, we worked on the mathematical extension of the
perceptu-ally relevant channelized joint observer (PCJO) to hyposignal task. While the abnormality can appear as a hypersignal or a hyposignal for different imaging modalities, sequences or organs, no MO has been proposed for the hyposignals detection-localization task in the literature. To improve the clin-ical relevance of the existing MO, we extended the PCJO’s capacity from hypersignal-only to both hypersignal and hyposignal. This work is
collabo-Introduction
rated with Prof. Chen from Southeast University and radiologists from Nan-jing First Hospital in China. (1 journal paper is published.)
– with T. Xu, we worked on the application of the MO on the comparison of
two different low-dose CT image reconstruction algorithms, a practical need of Prof. Chen from Southeast University and radiologists from Nanjing First Hospital. Since the abnormalities often appear as hyposignals on CT im-ages, e.g. the hepatocellular carcinoma (HCC) - the target pathology here, we recurred to the extended PCJO proposed in the previous work. (1 con-ference paper is published.)
– A limitation of the MOs I proposed was that they need reference images. In
our studies, we took images captured from healthy people as the reference images, which are not always possible and very time-consuming and expen-sive. With M. Outtas (Algerian PhD, but working within the VAADER team from 2015 to now), we explored firstly the usability of several no-reference metrics proposed originally for natural images in the context of medical im-ages. Then a modified Naturalness Image Quality Evaluator (NIQE) was pro-posed, and applied on the comparison of different speckle noise reduction methods and the image restoration oriented compression for ultrasound im-ages. The speckle noise reduction methods were also evaluated by radi-ologists from Nanjing First Hospital. Experimental results showed that the modified metric performed better than the direct use of other no-reference metrics proposed originally for natural images, but there is still plenty of room for improvement. (4 conference papers and 1 journal paper are published.) • 2D natural images: with T. Wang, we collaborated from 2014 when he was still
a PhD student in Southeast University until now when he is a lecturer in East China University of Technology. Two full-reference metrics (based on perceptual grouping and multi-scale representation) and two no-reference metrics (based on natural scene statistics) have been proposed during our collaboration. (2 confer-ence papers and 2 journal papers are published.)
• Videos in videophone applications: with I. Saidi, we conducted 2 laboratory ex-periments and 1 crowdsourcing study for the subjective evaluation of audiovisual quality in the videophone applications. We also compared the state-of-the-art full-reference objective video metrics, as well as distortion-specific no-reference
metrics in this context. In this report, several important works issued from this thesis will be presented in detail in Chapter 2. This is the first industry-oriented doctoral thesis (CIFRE PhDs) funding I got and the 1st thesis I co-supervised officially. (7 conference papers and 1 journal paper are published.)
• 3D synthesized view images: with S. Tian, funded by China Scholarship Council, we constructed a database focusing on the synthesizing distortions with more recent synthesizing algorithms, and proposed 2 full-reference objective metrics and 2 no-reference objective metrics. The details will be presented in Chapter 3. (4 conference papers and 2 journal papers are published.)
Concerning saliency detection, I actually worked on both salient object detection
and saliency detection (the two notations will be differentiated in Chapter 4) for different applications:
• Salient object detection for 2D videos: with Q. Wang, funded by China Scholar-ship Council, we firstly proposed a traditional method where the low-level features and priors are hand-crafted; then extended this method using a deep network which achieved much better performances compared to its traditional version. The usage of the deep network is based on our comparative/benchmarking study of the state-of-the-art deep learning based methods. The details will be presented in Chapter 5. (1 conference paper is published and 2 journal papers are submit-ted.)
• Saliency detection for 360◦ (or omnidirectional) images: with F. Chao, funded by
the Ministry of France, we began the study of saliency detection methods for 360◦
images from October 2017. In her first year of PhD thesis, we got the 1st place in ICME Grand Challenge “Prediction of Head+Eye Saliency for 360 Images” us-ing a model based on a Generative Adversarial Network. We then extended this model using multi-resolutional Field of View and adaptive weighting for the model training. In the rest one year and a half of her PhD study, we will further exploit
the saliency detection for 360◦ videos. The details will be presented in Chapter 6.
(1 conference paper is published and 1 journal paper is submitted up to now.) • Saliency detection for drone videos and its application on the drone video
com-pression: from 2018 to 2021, I’m leading the project “Automated Saliency Detec-tion from Operators’ Point of View and Intelligent Compression of Drone videos”,
Introduction
funded by the ANR (French National Agency for Research) ASTRID (Specific Support for Defence Research Projects and Innovation). This project allows our three partners to recruit a postdoc for each. I co-supervise two of them: with A. Perrin, who started from 01/2019, we are studying the usability of state-of-the-art 2D video saliency detection methods on the drone videos. Considering the specificities of the drone videos (including the bird-point-of-view, the loss of pic-torial depth cues...), a new model is certainly necessary and is the objective of this task; with G. Herrou, who will start from October 2019, we will work on the compression of drone video using the saliency as the guidance, i.e. allocate more bits on the saliency parts and less on other parts to optimize the rate-distortion. (1 conference paper and 1 journal paper are submitted up to now.)
This HDR report is organized into three parts, of which the first two correspond to my two research orientations mentioned above. But only four works issued from the four theses I co-supervised officially will be detailed, as exemplars, in this report. Each part begins with a short review of background material and then presents two works related to the research orientation in detail. At the end of each work, we give the list of our scientific contributions, as well as the perspectives. My research project for the further works will be given in the last part. Note that, to ease the reading, parts as well as chapters are self-contained.
PART I
I
MAGE QUALITY ASSESSMENT BASICS
The image quality assessment (IQA) occupies a very important position in numer-ous image processing applications, e.g. image acquisition, compression, transmission, restoration, etc. Since human beings are the ultimate receivers of the visual stimulus, the ultimate test is the subjective IQA in which the image quality is evaluated by a panel of subjects (human observers or participants). In this report, we focus on the IQA for natural images, where the average of the values obtained from human observers is known as Mean Opinion Score (MOS). The subjective IQA tests are however costly and time-consuming, thus it is also necessary to develop objective IQA models which can perform similarly to human observers and output quality scores closely related to the MOS.
1.1
Subjective IQA basics
1.1.1
Common elements in test protocols
The implementation of a subjective IQA test must comply with the ITU recommenda-tions [1, 2, 3] to ensure the reliability and reproducibility of the test. Although they are intended for different measurements, the standardized methodologies that we present share some common experimental protocols. These are the panel of observers, the test environment and the global conduct of the sessions.
For the same observed sequence, the evaluation is not stable from one individual to another. Several factors are responsible for this, such as the state of fatigue, knowledge of the images, the observer’s general experience in the IQA, or personal appreciation. In our subjective tests mentioned in this report we use only non-expert observers, i.e they are not confronted with the IQA in their professional activity. All participants are firstly examined for their visual acuity through the Snellen test and their color perception defects through the Ishihara test. The observers passing our test should have a visual
1.1. Subjective IQA basics
acuity of 10/10 for both eyes with or without correction. Moreover, we made sure that all the subjects reported having a normal audition. For greater reliability of the results, a panel larger than 15 participants will give statistically usable results [4, 5].
All the subjective tests mentioned in this report were performed in the laboratory environment, conforming with the ITU recommendations [1, 2, 3], including the general environment, the viewing conditions, and the device calibrations. We placed the display screen in a distance equal to 3 × H (screen height) from the subjects and adapted the ambient brightness of the rooms in order to limit the glare and the visual fatigue of the observers; in order to calibrate our display devices, we have used a tool to neutralize the display defects of the screen and to automatically adjust the hardware settings (brightness, contrast, white point, etc.) so that the display device ensures that it displays the widest range of possible colors.
Before the main test session, we should give an instruction to observers and con-duct a training session with them. The instruction is an explanation of the type of methodology, the scoring system, the presentation protocol and any useful elements. A training session is often conducted before the main test session with a few typical con-ditions to anchor the judgment of the observers. The scores of this training session are not taken into account in the final results. The main test session consists of a variable number of images, which corresponds to the evaluation of a perceived quality under different conditions. For videos, the test sequences have generally a duration between 8 and 10 seconds in order to leave a sufficient time for observers to give a stable score.
1.1.2
Test Methodologies
There are several test methodologies proposed in the ITU recommendations [1, 2, 3]: Absolute category rating (ACR) [P.910]; ACR with hidden reference (ACR-HR) [P.910]; Degradation category rating (DCR) [P.910]; Double-stimulus continuous quality-scale (DSCQS) [BT.500]; Pair Comparison (PC) [P.910]; Subjective Assessment of Multime-dia VIdeo Quality (SAMVIQ) [BT.1788]; Single stimulus continuous quality evaluation (SSCQE) [BT.500]... We will only detail the methodologies used in the subjective tests mentioned in this report in this section.
ACR : The ACR (also called single stimulus) method is a category judgment where
a category scale. The method specifies that after each presentation the subjects are asked to evaluate the quality of the sequence shown. This evaluation is performed on a five- or nine-grade categorical scale that is explained by five items (Excellent-Good-Fair-Bad-Poor). An illustration of 5-grade is given in Figure 1.1. The ACR method is an inexpensive method from the point of view of its application, treatment and analysis of the results. It also has the advantage of being able to qualify test systems and obtain their ranking according to the level of quality associated with them.
1 2 3 4 5 1 2 3 4 5 6 7 8 9 Bad Bad Poor Poor Fair Fair Good Good Excellent Excellent
Figure 1.1: Scale of quality assessment (MOS) at 9 and 5 levels.
SAMVIQ : In the SAMVIQ protocol, there is much more freedom for the observers
who can view each image several times and correct the notation at any time they want. The observers can compare the degraded versions with each other, as well as with the explicit reference. In each trial, there is also a hidden reference which helps to evaluate the intrinsic quality of the reference when the perceived quality of the reference is not perfect. Each observer moves a slider on a continuous scale graded from 0 to 100 annotated by 5 quality items linearly arranged (excellent, good, fair, poor, bad). The SAMVIQ results have a greater accuracy than the ACR scores for the same number of observers (on average 30% fewer observers were required for SAMVIQ than ACR for the same level of accuracy) [6].
1.1.3
Data Analyses
Subjects screening During a subjective quality assessment, a significant amount
of data is collected. It is then necessary to carry out some tests before translating this data into results. Thus, inter-observer coherence is evaluated. As a result of this
1.2. Objective IQA basics
verification, the assessment scores of some observers may be rejected. This screening step can therefore be critical in obtaining the results of a methodology since it requires a minimum number of observers. The screening method defined in BT.1788 [3] has been used for our subjective tests in this report.
Opinion Scores Once the tests are performed, the results are analyzed and
com-bined in a single note per image (or video sequence) describing its average quality. In this report, for the subjective tests conducted using ACR, we calculated the MOS, i.e. the average of the quality scores over the total number of participants; for the subjective tests conducted using SAMVIQ, we used the Differential Mean Opinion Score (DMOS), which is the difference between the score of the hidden reference image and the score of the tested image. The confidence interval associated with each MOS/DMOS score was also calculated. In order to easily compare each observer’s opinion about the quality of images, a linear transform that makes the mean and variance equal for all observers is often employed. The outcome of such transform is called Z-score.
Statistical test In order to evaluate if there is a significant difference between
differ-ent test conditions on the quality perception, statistical tests should be used. The data should firstly be checked to see if the samples are normally distributed, e.g. using the Shapiro-Wilk test or Kolmogorov-Smirnov test. If the hypothesis of the normal distri-bution is not rejected, a parametric test can be used; otherwise, a non-parametric test should be used. In this report, for the former case, the Fisher test is used; for the latter case, the Mann-Whitney test is used.
1.2
Objective IQA basics
1.2.1
Classifications of IQA methods
According to the ITU studies [7, 8], objective metrics may be classified into five main categories depending on the type of input data:
• Media-layer models use the audio or video streams to evaluate the perceived quality. For these models the characteristics of the stream content and decoder
strategies such as error concealment are usually taken into account. The model ITU-T J.247 [9] for video quality assessment belongs to this category.
• Parametric packet-layer model use only the packet header (TCP, RTP, UDP, IP, etc.) information without having access to the media signal. Such models are well suited for in-service non-intrusive multimedia quality monitoring. Among this category we may indicate the Recommendation ITU P.1201 [10].
• Parametric planning models use the quality planning parameters (bandwidth, packet loss rate, delay, frame rate, resolution, etc.) for network and terminals to predict the quality. For example, the models G.1070 [11] and G.1071 [12] are parametric models for estimating video and audio qualities for video-telephony and streaming applications respectively. The E-model (Rec. G.107) is a planning model for audio quality.
• Bitstream-layer models predict the QoE based on both encoded bit stream and packet-layer information without performing a complete decoding. These models can be used in situations where one does not have access to decoded video sequences. The Recommendations ITU P.1202[13] and P.1203 [14] are bitstream layer models for video and audiovisual media streaming quality assessment. • Hybrid models are a combination of two or more models from the preceding.
These models analyze the media signal, the bitstream information and packet header to estimate the perceived quality. For instance, ITU J.343 [15]is on of the developed hybrid models.
1.2. Objective IQA basics
As illustrated in Figure 1.2, the media-layer objective quality assessment methods can be further categorized as full-reference (FR), reduced-reference (RR), and no-reference (NR) depending on whether a no-reference, partial information about a refer-ence, or no reference is used in assessing the quality, respectively. As explained in [16], full- and reduced-reference methods are important for the evaluation in non-real-time scenarios where both (1) the original (reference) data or a reduced feature data set, and (2) the distorted data are available. For instance, during the development and prototyping process of video transport systems, the original video can be delivered of-fline for full-reference quality assessment at the receiver, or the received distorted video data can be reliably (without any further bit loss or modifications) delivered back to the sender. In contrast, for real-time quality assessments at the receiver without availability of the original video data, low-complexity reduced-reference or no-reference methods are needed.
1.2.2
Performance evaluation metrics
While there are more metrics can be used for the performance evaluation of the ob-jective IQA metrics, we only introduce here the three commonly used metrics when subjective scores are available [17]:
1. Accuracy prediction: refers to the ability to predict the subjective quality ratings with low error. The Pearson Linear Correlation Coefficient (PLCC) was computed.
For two datasets X = {x1, x2, ..., xN} and Y = {y1, y2, ..., yN} with x and y the
means of the respective datasets, the PLCC is defined by:
P LCC = P (xi− x)(yi− y) q P (xi− x)2 q P (yi− y)2 (1.1)
2. Monotonicity prediction: refers to the degree to which the relationship between the subjective quality ratings and the predicted measure can be described by a monotone function. The Spearman Rank Order Correlation Coefficient (SROCC) was used: SROCC = P (Xi− X0)(Yi− Y0) q P (Xi− X0)2 q P (Yi− Y0)2 (1.2)
where Xi and Yi are the ranks of the ordered data series xi and yi respectively;
3. Consistency prediction: measures the ratio of wrong predicted scores by the ob-jective model to the total number of scores. The Root Mean Square Error (RMSE)
was computed. For a dataset {x1, x2, ..., xN}, with x is the mean value:
RM SE = s 1 N X (xi− x)2 (1.3)
The PLCC and RMSE are often computed after performing a non-linear mapping on the objective measures using the cubic polynomial mapping function recommended by the VQEG [17]. This function is used in order to fit the objective model scores to the subjective scores.
CHAPTER2
P
ERCEIVED QUALITY FOR VIDEOPHONE
APPLICATION
2.1
Introduction
Over the years, multimedia applications have conquered many segments of the telecom-munications industry. We are dealing today with multimedia services in many areas, starting with the various digital television systems, video-telephony, video-on-demand (VOD), Internet Protocol television (IPTV) or simply video-sharing services like YouTube or Dailymotion. Multimedia services represent an important part of the global IP traffic that is constantly growing. In the last statistics reported in [18], mobile video services will generate three quarters of mobile data traffic by 2020. Among the most popular multimedia services, the video conversational applications are in full development. In a competitive market, various Over The Top (OTT) players are emerging: Skype, Mes-senger, Facetime, WeChat, Duo, etc. For example, the statistics show that Skype has more than 300 million monthly active users [19] with 3 billion minutes per day spend on Skype video calls [20].
The development of appropriate methods for measuring and monitoring the per-ceived quality of these new services becomes thus a major challenge for telecommuni-cation operators. This chapter presents several of our efforts to investigate the issues concerning the perceived quality for videoconferencing application, collaborated with Orange.
• Wa have conducted two subjective experiments to assess the perception of video conference service users under different conditions, and to constitute a sequences database to evaluate the performance of the objective quality metrics. We inves-tigate the video, audio and audiovisual quality and asynchrony perception under two different situations: a non-interactive and an interactive conversational one.
We analyze the effects of network impairments (packet loss, jitter, delay) on per-ceived audiovisual, audio and video quality. We evaluate the impact of experi-mental context and scene complexity on the quality perception in case of video calls. Furthermore, we propose new acceptability thresholds of audio-video asyn-chrony in video telephony context and study the effect of synchronization in the presence and absence of network degradation.
• We surveyed the most recently developed objective full-reference (FR) video quality metrics and we evaluate their prediction accuracy on four different subjec-tive databases: the Live Mobile video quality Database, the EPFL database and two videoconferencing databases developed by Orange Labs. We investigate the assessment of video quality in the context of videoconferencing and video call communications.
2.2
Non-interactive subjective test
In this section, we present a non-interactive audiovisual quality assessment experi-ment. Before our study, there were few studies addressing the impact of the network settings on perceived multimedia quality [21], and the combination of the network im-pairments and non-synchronized audio and video had not been well studied.
2.2.1
Experimental set-up and recording
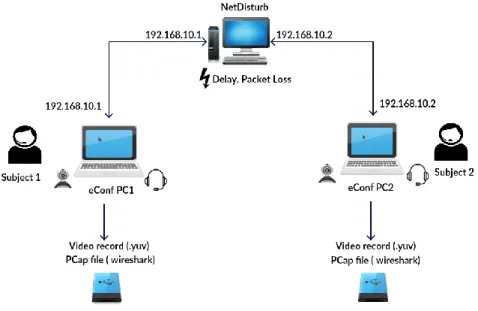
In order to generate our test database, we used a PC-based video conferencing soft-ware internally developed in Orange. The reason of this choice is that it allows sharing multimedia contents between two users and separating audio and video IP flows. Thus, we were able to simulate degradations on audio and video independently. We used the audio-visual communication protocol H.323 recommended from the ITU [22] to transmit calls between two users.
To simulate network degradations, we used the NetDisturb software [23] which al-lows disturbing fal-lows over IP network by generating user-defined impairments (latency, jitter, packet loss . . . ). The interest of using a network simulator, instead of the real network, in our experience was to totally control the IP network degradation, provide repeatable QoS on audio and video flows using predefined configuration mode and
2.2. Non-interactive subjective test
values, and re-create real world problems in the laboratory. We inserted a machine equipped with NetDisturb between our two clients connected via an Ethernet local net-work.
Once a conference call was set up, the client sender transmitted the original au-dio, video or audiovisual files to the receiver (see Fig. 2.1). Then, we controlled the packets transmission between them by adding packet losses, jitter and delay. At the receiver side, we recorded the degraded sequences and captured IP packets traveling over the network (pcap format). To ensure a perfect playback, all recorded multime-dia sequences were processed and stored as raw YUV 4:2:0 for the video stream and uncompressed Pulse Code Modulation (PCM) for the audio stream.
Figure 2.1: Simulation platform design.
2.2.2
Test conditions
The distortions we simulated reflect the range of IP network impairments including packet loss, jitter and delay, of which the tested values are listed in Table 2.1, where a negative value of asynchrony means that the audio stream is delayed according to the video and a positive value means that it is advanced.
Video packet loss VPL ( %) 0, 0.5, 1, 2
Audio packet loss APL (%) 0, 2, 5, 20
Video jitter (ms) 0, 60
Audio jitter (ms) 0, 30
Audio-video asynchrony (ms) -400, -250, -150, 0, +50, +150, +400
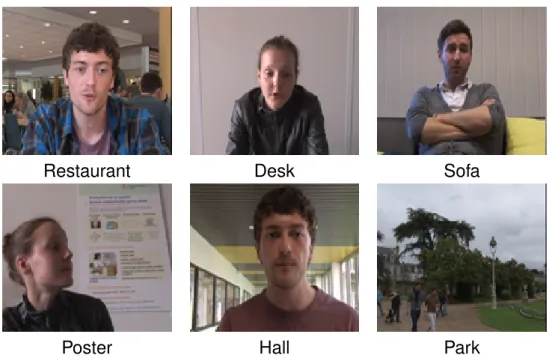
Restaurant Desk Sofa
Poster Hall Park
Figure 2.2: Frame captures from the original sequences.
2.2.3
Methodology and test protocol
Six sequences (Restaurant, Desk, Sofa, Poster, Hall and Park, cf. Fig. 2.2) were se-lected to represent different contexts of real life video calls and different levels of spatial and temporal complexities. The duration of the sequences is 8 -10 seconds. The ex-perimental conditions are summarized in Table 2.2.
Video Audio
Codec H.264/AVC Codec AMR Wideband
(constrained
base-line)
Bit rate 768 kbps Bit rate 23.85 kbps
Resolution VGA (640 × 480) Channels 1
Frame rate
15 fps Sampling 48000 Hz
GOP size 10 frames frequency
Video color scheme
16 bit YUV (4:2:0)
Table 2.2: Experimental conditions used in the subjective study
ex-2.2. Non-interactive subjective test
perimental method was the 5-grade Absolute Category Rating (ACR). A total of 30 sub-jects (13 male, 17 female) participated in the experiment. We realized the audio-only and the video-only test with 15 subjects while the audiovisual test was carried out with the other 15 subjects. They were provided with a high quality headphone (Stax SR-404) for sound reproduction. The experiment was performed in an acoustically treated room especially designed for audio and video quality tests. The signals were presented to the subjects via an LCD computer monitor with a 1024 × 768 resolution. The evaluation score was indicated on a tablet next to the screen on the right of the subjects.
Test Duration Sequences Conditions Outputs
Audio only 10min 36 5 M OSA
Video only 10min 36 5 M OSV
Audiovisual 1h30 176 33 M OSAV
M OSAV A
M OSVAV M OSsynch
Table 2.3: Three test sessions, where M OSsynch is the audio-video asynchrony score.
2.2.4
Results and discussions
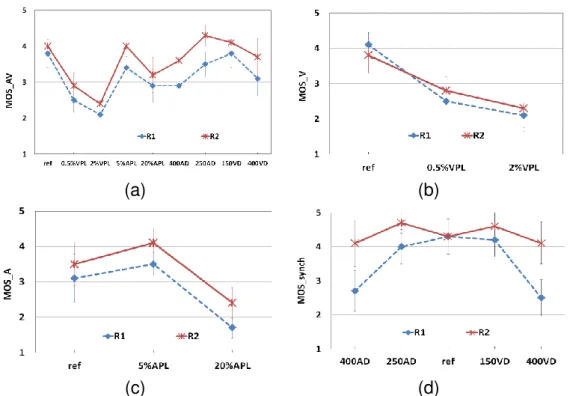
The test results were summarized by computing the averaged MOS values for each test condition over the six sequences. No subject was excluded after the screening. The Mann-Whitney U test was used for the significance test, because our data does not follow the normal distribution.
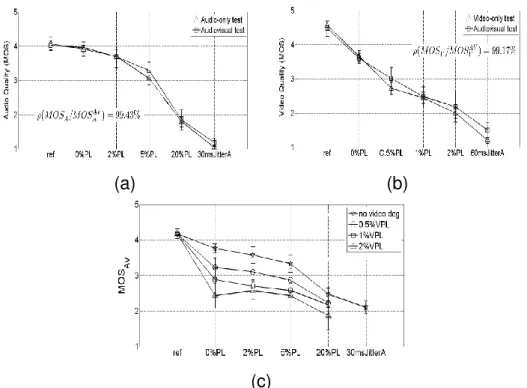
Audio-video quality Interaction The plots in Fig. 2.3 show the MOS scores
aver-aged over all sequences for both test sessions. They demonstrate that the experiments have been properly designed, as the subjective rates uniformly span over the entire
range of quality levels. By plotting M OSV vs. M OSVAV and M OSA vs. M OSAAV, and
calculating their linear correlation coefficients ρ, we noticed that the perceived audio and video qualities are weakly influenced by the audiovisual context. Mann-Whitney test results revealed that there is no significant difference between scores of the two sessions ( audio-only and video-only vs. audiovisual).
We are also interested in studying the mutual interaction between the individual audio and video streams. A statistical test revealed that in an audiovisual context the
(a) (b)
(c)
Figure 2.3: Mutual interaction between audio (a) and video (b) qualities and the impact of audio and video quality on overall audiovisual quality (c).
impact of the video impairments on the perceived audio quality is not significant. On an-other hand, the audio impairments have a small impact on the perceived video quality.
For the same video quality level, M OSAV
V values decrease slightly with the percentage
of audio packet loss. This drop in MOS scores is more significant in the case of good and average video quality levels (0%VPL, 0.5%VPL). When the video quality is already poor (1%VPL and 2%VPL), quality judgment is not affected by the audio degradation (there is not a significant difference).
Fig. 2.3 (c) shows the interaction between audio and video quality levels in influ-encing the overall audiovisual quality. The presented results were averaged over all delays (synchronous and not synchronous contents) and over all contents. It reveals that for the same audio quality levels, decreasing the video quality generally results in inferior audiovisual ratings. Alongside, for the same video quality, decreasing the audio quality generally results in inferior audiovisual ratings. The impact of video impairments on audiovisual quality at good audio quality level is more significant than at poor and bad audio quality levels. Concerning the jitter condition, it had the biggest impact on decreasing the audiovisual quality.
2.3. Interactive subjective test
(a) (b)
Figure 2.4: Synchronization acceptability chart.
Audio-video Synchronization Limited by the number of conditions and the
dura-tion of the test, we could not cross the 6 different values of delay with all the network degradation levels which explained the lack of some points on Figure 2.4. But we are
still able to identify thresholds of synchronization acceptability. We set M OSsynch = 4
and M OSAV = 3as the acceptability limits, corresponding to thresholds when the
sub-jects begin to be disturbed and when the audiovisual quality becomes poor. For audio delayed with more than 250 ms and advanced with more than 150 ms, the desychro-nisation becomes annoying and the audiovisual quality decreases. We also notice that the presence of video packet loss impairments have a little, but not significant impact on synchronization. The perception of audiovisual quality and synchronization is sensitive to network degradation mainly related to video streams.
2.3
Interactive subjective test
To be closer to a real-life video-conferencing, we present an interactive conversational subjective test in this section. Before our study, few studies have been conducted for evaluating the audiovisual quality in conversational context [24, 25, 26].
2.3.1
Experimental set-up and recording
Figure 2.5 depicts this test platform. User PC1 and user PC2 are two identical systems, placed in two separate rooms and connected via a local Ethernet IP network. Other experimental settings are the same as in the non-interactive test.
Figure 2.5: Simulation platform design.
2.3.2
Test conditions
Since the interactive takes longer time, we have less conditions here. We only gen-erated two levels of audio and video packet loss which represent the extreme ranges of quality: 1-hardly perceptible, 2-highly annoying. All conditions were symmetric so that the test participants experienced the same quality on both ends of the connec-tion. We randomized the order of the conditions. Table 2.4 provides an overview of the transmission parameters evaluated in this study.
Video packet loss VPL ( %) 0, 0.5, 2
Audio packet loss APL (%) 0, 5, 20
Audio Delay AD (ms) 0, 250, 400
Video Delay VD (ms) 0, 150, 400
2.3. Interactive subjective test
2.3.3
Methodology and test protocol
In order to consider the influence of scene complexity and keep the experiment time within limits, we have configured the two rooms with two different levels of video com-plexity:
• Room 1: where the background behind the subject is a simple white wall (cf. Fig.
2.6.a).
• Room 2: where the scene has a certain spatial and temporal complexity. A poster
and a plant behind the subject, and one Orange staff walk behind him from time to time (cf. Fig 2.6.b).
The rooms have been acoustically treated and they have a similar audio background.
(a) (b)
Figure 2.6: Screen captures of the conversation in Room 1 (a) and Room 2 (b). The test has been conducted in an interactive scenario. We proposed a game to stimulate the conversation between the two subjects. For a subject, the objective of the game, was to let its partner guess a word without using the word itself or five additional words listed on a card. We gave each subject 20 cards. This conversation task is similar to the Name-Guessing task from the ITU-T Recommendation P.920 [27]. The subjects could also discuss on their own topic if they prefer. The duration of each conversation was around 3 or 4 minutes. Each discussion corresponds to a specific set of impairments of audio and video. The subjects tested 9 different conditions where the audio and video impairments are independent (limited by the test duration, the interaction between the conditions was not tested).
Twenty subjects (9 male, 11 female) participated in the experiment. They were all inexperienced in evaluating audiovisual quality in such a context, but the majority had already experienced a video-conference call. Subjects were asked to rate the perceived
overall audiovisual quality (M OSAV), audio quality (M OSA) and video quality (M OSV)
and the audio-video synchrony annoyance (M OSsynch), using the 5-grade ACR.
2.3.4
Results and discussions
The results of the subjective experiment are summarized by averaging the scores as-signed by the panel of participants for each conversation. For the comparison between the interactive and non-interactive experiments and between the scenes with different complexity, the Mann-Whitney U test [28] is used since the data does not follow the normal distribution. We set the significant difference level to α = 0.05. Our screening results show that no subject has to be excluded.
(a) (b)
(c) (d)
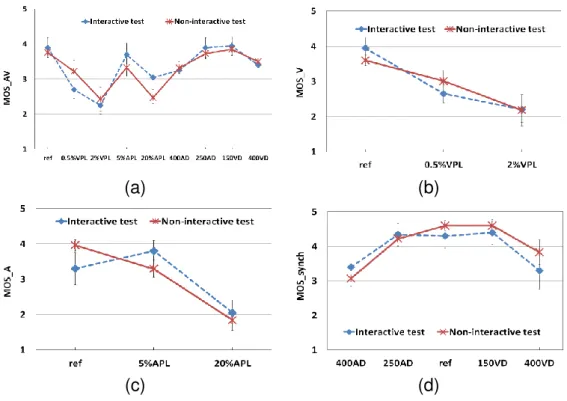
Figure 2.7: Interactive vs. non-interactive MOS scores
Influence of the experiment context: interactive vs. non-interactive We firstly
2.3. Interactive subjective test
on audiovisual quality (AVQ), video quality (VQ), audio quality (AQ) and audio-video synchronization acceptability. Figure 2.7 shows the MOS scores obtained in the two contexts averaged over all scenes.
By comparing the two plots in Figure 2.7.a, we observe that there is a significant
difference between M OSAV scores in case of 0.5% video packet loss and 20% audio
packet loss. This may indicate that subjects are more sensitive to low video impair-ments when they communicate than when they passively watch an audiovisual se-quence. The interactive task may make the subjects discriminant and severe in the assessment of the audiovisual quality since the video impairments may have more psychological impact on the visual communication they are involved in. However, for important VPL (2%) the quality is poor enough that there is not a significant difference between subjective scores in the two contexts. The subjects give a significantly higher quality note in the interactive context than in the non-interactive context when the au-dio quality is very low. This may indicate that their attention on the auau-diovisual quality judgment may be diverted by the guessing game.
For the perceived video quality, Figure 2.7.b shows no significant difference be-tween the two contexts. Subjects perception of the video quality and concentration on the artifacts are the same. Nevertheless, we report a significant difference of perceived audio quality between the two contexts (Figure 2.7.c). Considering the variances, we note that for the interactive test there was not a significant difference between reference and 5%APL condition, while for the non-interactive there was this significant difference – indicating that the impairments are more noticeable in the non-interactive context. The reason of this variance may be that the audio impairments are more noticeable when the subjects are just viewing and listening to an audiovisual content. Then, they are more concentrated and they are more able to notice the impairments.
Concerning the thresholds of desynchronization acceptability, as it can be seen in Figure 2.7.d, there is not a significant difference between the two test contexts.
These results may be true for our tested conditions where only one source (video or audio) was impaired at the time (no interaction between the conditions). Previous studies showed that when both audio and video were impaired, differences in MOS ratings were found [25].
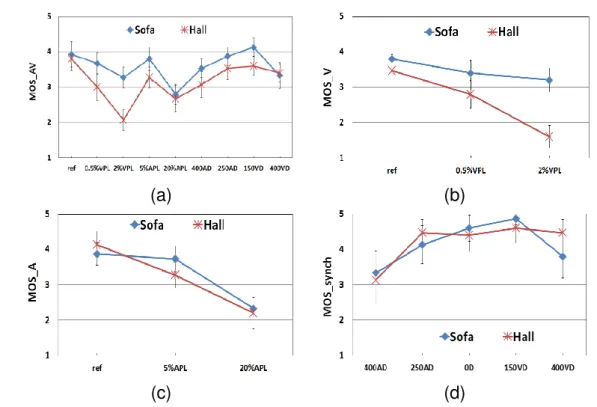
Influence of scene complexity for interactive test We are also interested in the
(a) (b)
(c) (d)
Figure 2.8: Impact of scene complexity for interactive experiment context.
acceptability for the interactive test.
Figure 2.8 shows the M OSAV, M OSV, M OSA and M OSsynch scores associated
to 95% confidence intervals, according to the quality condition and scene complexity. "R1" denotes the perception of the complex scene of Room 2 from Room 1; and "R2" denotes the perception of the simple scene of Room 1 from Room 2.
We can see that generally the perceived AVQ is higher in a simple scene than that
in a complex scene at the same degradation levels (an average drop of M OSAV score
is about 0.5). The statistical test reveals that there is a significant difference between
subjective M OSAV scores for the two rooms. This may indicate that when a scene is
composed of complex spatial and temporal elements (presence of high frequencies in the picture and high amount of temporal activity), the network impairments would have a greater impact, and the artefacts (block loss and blockiness) would be more visible. In fact, scenes with high temporal and spatial complexities require more bit rate to be encoded. At a constant bandwidth, more encoding artefacts will occur and the efficiency of the packet loss concealment algorithm is reduced [29].
For the video quality (Figure 2.8.b), there is not a significant difference between Room1 and Room2. We have expected to have a significant difference in the results
2.3. Interactive subjective test
(a) (b)
(c) (d)
Figure 2.9: Impact of scene complexity for non-interactive experiment context.
because the complexity of the scenes is guessed to have a stronger impact on video quality than on audio quality. This may be explained by the fact that the difference of complexity between the scenes is not sufficient to have an impact on the perceived video quality.
For the perceived audio quality (Figure 2.8.c), there is no significant difference be-tween the results for the two rooms. This is logic since the spatial complexity is not expected to have an effect on audio quality. Furthermore, the audio background de-ployed in our experiment was the same when it comes to the both rooms used. Thus, the used audio background did not allow to reveal any impact in this case.
Figure 2.8.d shows that the synchronization annoyance of the subjects is also influ-enced by the spatial and temporal complexity of the perceived scene. The differences
in M OSsynch are statistically significant. These plots of synchronization acceptability
are coherent with the M OSAV results even if the difference of M OSsynch between the
two rooms is more important. This may indicate that an increased temporal activity has a direct impact on perceived lip synchronization since the movements disturb subject concentration.
Influence of scene complexity for non-interactive test In order to stay coherent with the conversational test we present in this part a comparison between subjective results of the "Sofa" and the "Hall" scene. We chose these sequence scenes due to the difference of spatial and temporal complexity between them and to the similarity they have with the interactive scene content.
In Figure 2.9, M OSAV, M OSV, M OSA and M OSsynch scores are represented and
associated with 95% confidence intervals, according to the quality condition for each
scene. We report a significant difference in M OSAV scores between the sequences for
all the test conditions except the reference, 20%APL and 400 ms video delay. Thus, compared with Figure 2.9.a, we deduce that overall quality perception is influenced by the complexity of the perceived scene in both interactive and non-interactive context. This observation affirms that the environment and the position of the person on the video call is a parameter to take into account to evaluate the perceived communication quality. This complexity impact could be studied through a non-interactive experiment.
For the video quality, there is a significant difference in M OSV (Figure 2.9.b). In fact,
the subjective scores of the complex scene ("Hall") are lower than that of the simple scene. This observation is justified by the fact that video artifacts caused by packet losses are more visible with sequence complexity. We notice that the SI difference between the two scenes here is much bigger than that in the interactive context. This
may explain why we did not observe a significant difference in M OSV in the interactive
context.
As it can be seen in Figure 2.9.c there is not a significant difference of audio score between the two scenes. This result is expected since scene complexity has not an effect on audio quality perception, and consistent with the finding in the interactive context.
Figure 2.9.d shows that the subjects’ reaction to desynchronization annoyance is the same for the two scenes, no significant difference is noticed. Thus, unlike the in-teractive context, in a non-inin-teractive context the scene complexity does not impact audio-video synchronization perception. Previous studies have shown that in a passive context, large delay in the audiovisual signals does not necessarily impact the quality perception as test subjects accommodate for it [30].
2.4. Comparative study of existing FR VQA metrics
2.4
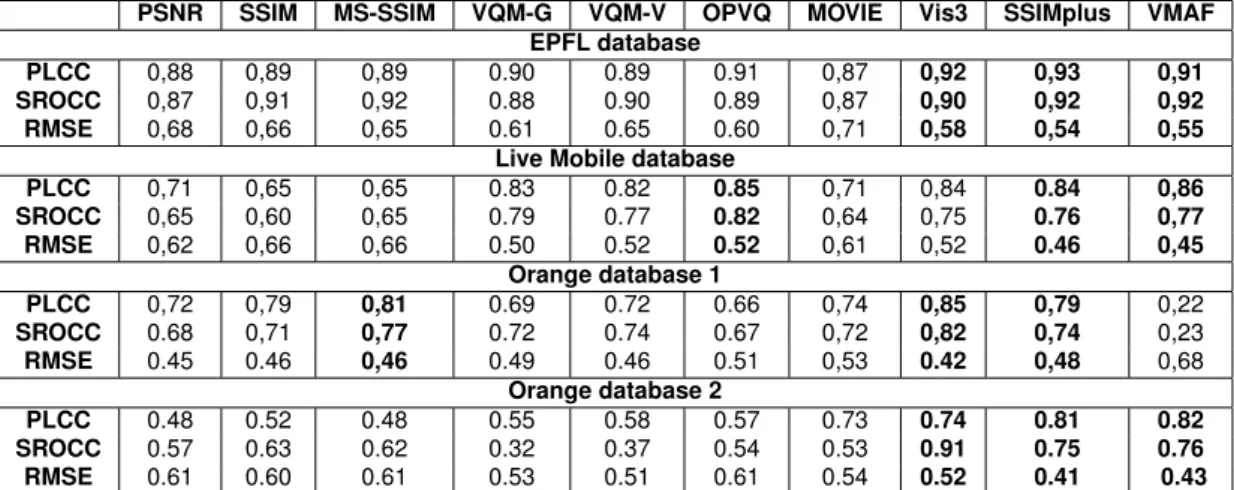
Comparative study of existing FR VQA metrics
While the POLQA model has been widely accepted within Orange as the objective au-dio quality metric, objective video metrics have not yet been tested for the videoconfer-encing application. In this section, we present a survey of recently developed objective FR video quality assessment (VQA) metrics and we evaluate their prediction accu-racy on four different subjective databases: the Live Mobile video quality Database, the EPFL database and two videoconferencing databases developed by Orange Labs. We investigate the assessment of video quality in the context of videoconferencing and video call communications. We choose these subjective database because of the na-ture of the contents and the variety of the simulated impairment types: transmission error (packet loss, jitter, freezing, etc.), coding (variable bit rates), and frame rate. Note that these metrics had not been compared with each other before this study.
2.4.1
Tested FR VQA metrics
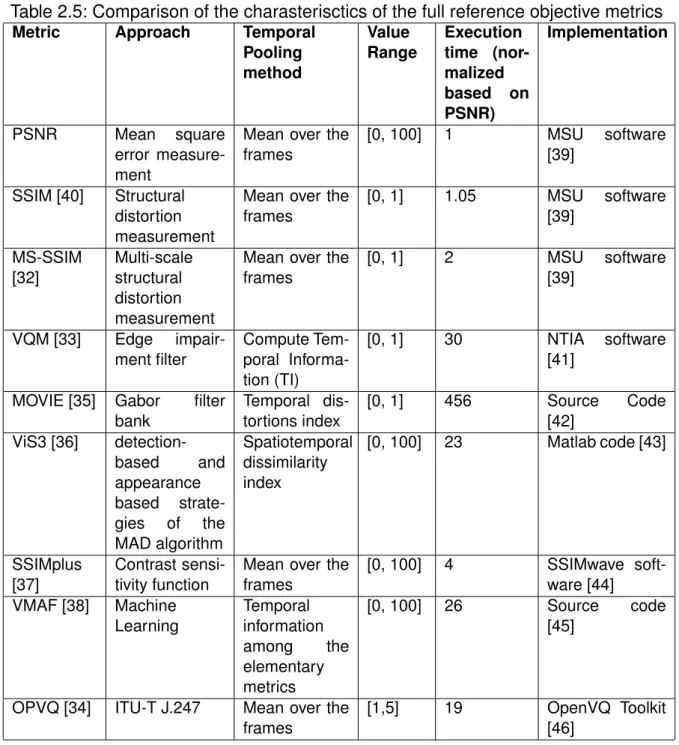
The selected algorithms which we studied have been widely cited in the literature and reported to have good performances. Moreover, the authors of the selected metrics have released the source codes. Therefore, the presented results are easy to repro-duce. The ten FR video quality assessment metrics described in the following subsec-tions include Peak Signal to Noise Ratio (PSNR), structural similarity index (SSIM) [31], multi-scale structural similarity index (MS-SSIM) [32], video quality metric (VQM) [33] (including its general model and videoconferencing model), Open Perceptual Video Quality metric (OPVQ) [34], motion-based video integrity evaluation (MOVIE) [35] , ViS3 [36], SSIMplus [37] and video multi-method assessment fusion (VMAF) [38]. Ob-jective MOS prediction metrics are also standardized by the ITU (J. series recommen-dations) to assess the video quality. It would be interesting to compare their prediction accuracy with the diverse full reference metrics. However, we do not have access to these models because of their commercial licenses. For instance, the model J.247 is owned by the company OPTICOM. We introduce in our study an open source imple-mentation of this model named OPVQ [34] which does not implement the temporal alignment part of J.247 due to its patent. In Tab. 2.5 we summarize the characteristics of the surveyed metrics.
Table 2.5: Comparison of the charasterisctics of the full reference objective metrics
Metric Approach Temporal
Pooling method Value Range Execution time (nor-malized based on PSNR) Implementation PSNR Mean square error measure-ment
Mean over the frames [0, 100] 1 MSU software [39] SSIM [40] Structural distortion measurement
Mean over the frames [0, 1] 1.05 MSU software [39] MS-SSIM [32] Multi-scale structural distortion measurement
Mean over the frames [0, 1] 2 MSU software [39] VQM [33] Edge impair-ment filter Compute Tem-poral Informa-tion (TI) [0, 1] 30 NTIA software [41]
MOVIE [35] Gabor filter bank Temporal dis-tortions index [0, 1] 456 Source Code [42] ViS3 [36] detection-based and appearance based strate-gies of the MAD algorithm Spatiotemporal dissimilarity index [0, 100] 23 Matlab code [43] SSIMplus [37] Contrast sensi-tivity function
Mean over the frames [0, 100] 4 SSIMwave soft-ware [44] VMAF [38] Machine Learning Temporal information among the elementary metrics [0, 100] 26 Source code [45]
OPVQ [34] ITU-T J.247 Mean over the frames
[1,5] 19 OpenVQ Toolkit [46]
2.4.2
Test databases
To investigate the performance of the above mentioned video quality metrics, we com-pare the results on different subjective databases. With the aim of having large test database with diversified conditions and impairment types which may be encountered in videoconferencing applications, we selected four databases to work on: The LIVE