Publisher’s version / Version de l'éditeur:
Vous avez des questions? Nous pouvons vous aider. Pour communiquer directement avec un auteur, consultez la première page de la revue dans laquelle son article a été publié afin de trouver ses coordonnées. Si vous n’arrivez pas à les repérer, communiquez avec nous à PublicationsArchive-ArchivesPublications@nrc-cnrc.gc.ca.
Questions? Contact the NRC Publications Archive team at
PublicationsArchive-ArchivesPublications@nrc-cnrc.gc.ca. If you wish to email the authors directly, please see the first page of the publication for their contact information.
https://publications-cnrc.canada.ca/fra/droits
L’accès à ce site Web et l’utilisation de son contenu sont assujettis aux conditions présentées dans le site LISEZ CES CONDITIONS ATTENTIVEMENT AVANT D’UTILISER CE SITE WEB.
Research Paper (National Research Council of Canada. Division of Building
Research); no. DBR-P-1328, 1985-07
READ THESE TERMS AND CONDITIONS CAREFULLY BEFORE USING THIS WEBSITE. https://nrc-publications.canada.ca/eng/copyright
NRC Publications Archive Record / Notice des Archives des publications du CNRC :
https://nrc-publications.canada.ca/eng/view/object/?id=6785ce06-13f4-4bbf-9bcb-a315b80c9452
https://publications-cnrc.canada.ca/fra/voir/objet/?id=6785ce06-13f4-4bbf-9bcb-a315b80c9452
NRC Publications Archive
Archives des publications du CNRC
This publication could be one of several versions: author’s original, accepted manuscript or the publisher’s version. / La version de cette publication peut être l’une des suivantes : la version prépublication de l’auteur, la version acceptée du manuscrit ou la version de l’éditeur.
For the publisher’s version, please access the DOI link below./ Pour consulter la version de l’éditeur, utilisez le lien DOI ci-dessous.
https://doi.org/10.4224/40001804
Access and use of this website and the material on it are subject to the Terms and Conditions set forth at
Correction of the results of standard fire resistance tests
Ser
TH1
N21a
National Research
Conseil national
lo*
'
r(*
Council Canada
de recherches Canada
co
2
BLDG
Division of
Division des
- --
Building Research
recherches en bhtiment
Correction of the Results
of
Standard Fire Resistance Tests
by T.Z. Harmathy
Reprinted from
ASTM
Journal of Testing and Evaluation, JTEVA,
Volume 13, No. 4, July 1985
p.
303
-
307
(DBR Paper No. 1328)
Price $2.00
NRCC 25045
ps-
i 1,La formule empirique prgsentge dans la norme
ASTM
El19 pour
corriger les rgsultats des essais de rgsistance au feu est
analysge
3 la lumisre du concept de la charge combustible
normalisge.
La formule ne contredit pas les conclusions
thgoriques, mais on peut s'interroger sur son exactitude. Dans
des conditions pratiques, la correction ne devrait pas prendre
plus de quelques minutes.
Tibor
Z.
Harmathyl
Authorized Reprint from
Journal of Testing and Evaluation, July 1 9 8 5 Copyright
American Society for Testing a n d Materials 1 9 1 6 Race Street, Philadelphia, PA 1 9 1 03
1 9 8 5
Correction of the Results of Standard Fire Resistance Tests
REFERENCE: Harmathy, T. Z., "Correction of the Results of Standard
Fi Resistance Tests," Journal of Testing and Evaluation, JTEVA, Vol. 13, No. 4, July 1985, pp. 303-307.
ABSTRACT: The ASTM Method for Fire Tests of Building Construc- tion and Materials (E 119) empirical formula for correcting the results of fire resistance tests is examined in the light of the normalized heat load concept. The formula, on the whole, does not contradict theoretical con- clusions, but its accuracy is questionable. Under practical conditions the correction is not expected to amount to more than a few minutes.
KEYWORDS: correction formula, fire resistance test, furnace-temper- ature-time curve, normalized heat load
Area under actual furnace-temperature-versus-time curve for the first three-quarters of 7 , "C min,
Area under standard furnace-temperature-versus-time curve for the first three-quarters of 7 , "C min
= A - A s , "C min
Specific heat, J kg-'K-' Normalized heat load. S I / ~ K
Normalized heat load increment due to a flaw in the furnace temperature, slI2 K
Thermal conductivity, W m- IK- I
Area associated with the lag of furnace thermocouples, =
1800OC min
Heat flux absorbed by the test specimen, W m-2 Time, s (or min)
Period of flaw in furnace temperature, s (or min) Furnace temperature, K (or "C)
Flaw in furnace temperature, K (or OC)
Temperature of exposed surface of specimen, K (or OC) Change in exposed surface temperature due to flaw in fur- nace temperature, K (or OC)
Greek Svmbols
E Emissivity of specimen surface, dimensionless
7 Measured fire resistance time (i.e., time of successful endur-
ance of a test fire), s (or min)
A 7 Fire resistance credit (or debit), s (or min)
p Density, kg mP3
a Stefan-Boltzmann constant = 5.67 X lop8 W m P 2 K - ~
'Research Officer. National Research Council of Canada. Division of
Building Research. Ottawa. Canada K I A 0R6. Member of ASTM.
'' 1985 by the American Society for Testing and Materials
30
Subscript max Maximum
Introduction
A formula in ASTM Method for Fire Tests of Building Construc-
tion and Materials (E 119) a l l ~ w s for the correction of the test results for minor flaws in the furnace-temperature-versus-time curve. That formula will becritically examined in this paper.
ASTM Correction Formula
The ASTM correction formula is
2 A - A ,
A 7 = T - -
3 A , + L
where
A T = fire resistance credit (or debit, if A
<
A,), min,T = measured fire resistance time (time of successful endur-
ance of a test fire), min,
A = area under actual furnace-temperature-versus-time curve for first three-quarters of T , "C min,
A , = area under standard furnace-temperature-versus-time curve for first three quarters of 7 , O C min, and
L = area associated with thermal lag of furnace thermocouples during initial period of test, = 1800°C min.
The formula can be rewritten in the form
where A A = (A -A,), "Cmin. Clearly, therightsideoftheequation is a function of T only. That function is plotted as Curve 1 in Fig. 1.
The following conclusions can be drawn:
1. A 7 / A A depends uniquely on the fire resistance time.
2. A T / A A decreases slightly with the fire resistance time (for
times of interest).
3 . A T / A A is independent of the properties of the test specimen. 4. Flaws in the furnace-temperature-versus-time curve beyond three-quarters of the fire resistance time call for no correction of the test result.
The finding that the severity of fires, compartment fires and test fires alike, can be quantified by the normalized heat load on the
304
' JOURNAL OF TESTING AND EVALUATIONF I R E RESISTANCE T I M E . rnin
FIG. I-C~rrrrlufiorr o/' rrsf rc,srrlrs I C i ~ r l r I: ASTM corrc,criorr: Crlrlr 2: corrrctiort uccordirrp to rlris ptrl>c,r/.
compartment boundaries (in compartment fires) or on the test spec- imens (in test fires) has made it possible to explore the validity of the ASTM correction formula.
Normalized Heat Load
The normalized heat load is defined as
where
H = normalized heat load. s1I2
K ;
Jkk
= thermal absorptivity (inertia) of compartment bounda- ries or of test specimen (see Note), J m-2 s - ' ' ~K-'
(k is thermal conductivity, p is density, and c is specific heat), q = heat flux absorbed by compartment boundaries or by testspecimefi. W m-2. t = time, s, and
T = time of exposure to real-world fire or test fire, s.
(Note: With composite test specimens the "properties" of the test specimen should be interpreted as those of the material forming the surface exposed to fire.)
Equations for calculating the normalized heat load on specimens exposed to standard test fires are given in Ref I. The same equations can also be used to calculate the normalized heat load on a building element when exposed to a nonstandard fire of any given tempera- ture history.
In developing the equations in Ref 1. it was assumed that the test specimen is heated by radiation from "black" (highly emissive) furnace gases. The assumption of radiant heating by black gases usually overcompensates for the neglect of convective heating, so that the calculated values of H may be somewhat higher than the normalized heat loads the test specimens are actually exposed to.
Computer-executed numerical studies were performed to develop information on the normalized heat load absorbed by specimens niade from four materials (representing a wide range of material properties) during exposure to "flawless" and "flawed" standard fire tests. The calculation schedule is shown in Table 1. The nature of the flaws is illustrated by the T t curves of Figs. 2 and 3.
Scheme A simulates the flawless test. Schemes B, C. D, and E simulate flawed tests: the furnace-temperature-versus-time curve is
TABLE I -.S~~lrc~clrtk~ r~/'c~orirl~rrrc~r .srrr~lic~.s. Schcnic"
\lip,.
Spccinicn Matcriitl J 111 's
'
'K'
A B C D E Nornial-weight concrctc 2192 / / # # v Firc cl;ly brick 1640 lrLightweight concrctc 93 1 r /
In\ol;~tina fin. brick 425 r / / ~ / #
"Schcnics:
A: Furnacc tcniperaturc follows thc standard tcnipcrature-time curvc for
0 5 I 5 I2Oniin.
B: Furnace tcnipcrature follows the standard tcnipcraturc-tinic curve for
0 5 r < 10 niin and 20 < I 5 120 niin; for 10 5 r 5 20 niin it runs -W°C ahovc the \t;~ndard curvc.
C: Furnacc tcmperaturc follow\ the standard tcmperature-tinic curve for 0 s I < 10 niin and 20 < r 5 120 niin; for 10 5 I 5 20 niin it runs-W°C bclo\v the standard curvc.
D: Furnacc tcmperaturc follows thc standard tcniperature-time curvc for 0 5 I < 60 niin and 70 < I 5 I20 niin; f o r m 5 I 5 70 niin it runs 50°C above the standard curve.
E: Furnace temperature follows the standard tcnipcrature-time cur!e for O s r < 6 0 m i n a n d 7 0 < r s 1 2 0 m i n ; f o r 6 0 ~ t s 7 0 n i i n i t r u n s 5 0 ° C
below the standard curve.
t
L E f T S C A L E
-
T I M E , m i n
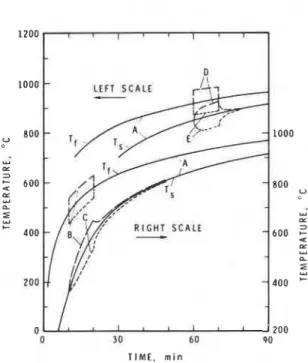
FIG. 2-Ccrlcrrlcrri~rrr rc.s~rlrs.fir rrorii~ul w.t,iglrr corrcrrtc, s l ~ r c i r ~ ~ r i r s /T, =
Irrit/~crirI lire ol' /irrriirc~c, girsc,s: T, = srrr/irc(, rc,rrrpc~rfrr rrrc. 01' sl,c,c,itsrrrr Iv.r-
posrd sid(z/: A lo E sc/rc,rrrc~: rrrrrirhers/.
either overshot or undershot by 50°C for a period of 10 min (thus, A A = 500°C min). Those familiar with the conduct of standard fire tests will appreciate that such deviations from the standard curve are typical.
Schemes B to E were applied only to normal weight concrete and insulating fire brick specimens, which more or less represent ex- treme cases with respect to thermal absorptivity (inertia).
HARMATHY ON FIRE RESISTANCE TESTS
305
D-
LEFT S C A L E R I G H T S C A L E-
- - 1000 BOO w E 6002
4 LZ w nz
400 TIME, minFIG. 3-Culculutiorl reslrlts ,fir ir~sulutirrg ,fire brick specimens IT, = ternperuture of.firrritrce guses: T, = slrrjuce terrlperuture of specin~err /ex- posed side): A to E: scherlle rrur~lhers).
Results of Computer Studies
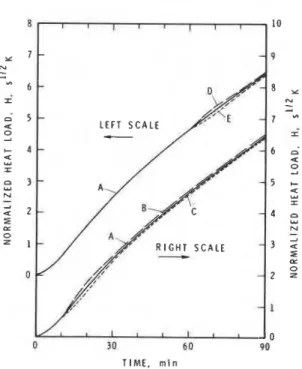
Figures 2 and 3 show the temperature of the furnace gases (Tf) and that of the exposed surface (T,) for normal weight concrete and insulating fire brick specimens in the simulated test fires conducted in accordance with Schemes A to E. Figures 4 and 5 show the nor- malized heat load (H) absorbed by the same two specimens, again in the simulated test fires corresponding to Schemes A to E.
0 30 60
TIME. min
FIG. 5-Calculutior~ results for insulating'jire brick specimens ( A to E:
scheme numbers).
Figures 2 to 5 indicate that the deviations for both T, and H from the curves representing flawless tests are maximum at the end of the flaw period. Table 2 lists these maximum deviations: (AT,),, and AH,,,,,. It appears that if the flaw occurs at some advanced stage of the test, ( A T,),,, is roughly equal to A Tf, the flaw in Tf. If the flaw occurs at an earlier stage, (AT,),,, goes somewhat higher than ATf, especially if the thermal absorptivity (inertia) of the specimen is high. The table also shows that AH,,, tends to be slightly higher if the flaw occurs at an early stage, and that the effect of the thermal absorptivity (inertia) of the specimen is of secondary importance.
All deviations tend to fade out after Tf has resumed its normal course following the period of flaw. The fading out is faster for a specimen of lower thermal absorptivity (inertia). It is also faster if the flaw occurs further on into the test.
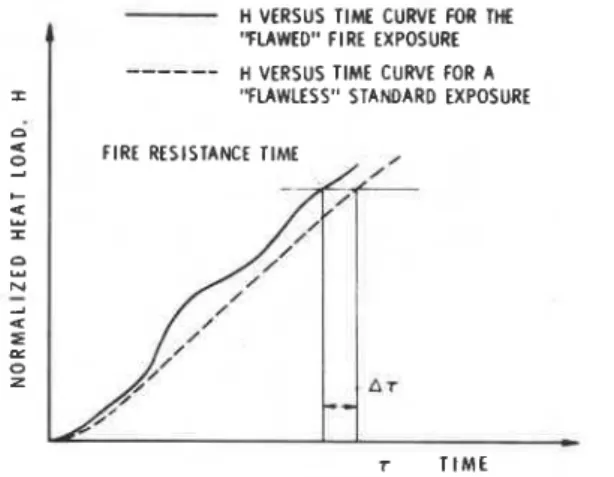
The fire resistance credit (or debit) ( A T ) is the difference in the time of reaching the same level of normalized heat load in a flawless standard test as in a flawed test. The way A T is determined is illu- strated in Fig. 6. It follows from earlier observations that A T will be maximum if the test is terminated at the end of the period of flaw. If
TABLE 2-Maximum deviations in T, and H due to 'Y1uwed"Jire exposure.
( A T,),,,, OC AH,,,. S"'K
for Scheme for Scheme Specimen 0 C D E B C D E I) 30 6 0 90 TIME, min Normal weight concrete +63.3 -63.5 +50 -49
+
1580 - 1520 +I300 -1260 Insulating fireFIG. 4-Calculution resultsjor normal weight concrete specimens /A ro brick +52.0 -52.1
+w
- 3 + 1420 - 1420 +1370 -1360H VERSUS TIME CURVE FOR THE "FLAWED" FIRE EXPOSURE
H VERSUS TIME CURVE FOR A
I "FLAWLESS" STANDARD EXPOSURE
n 4
2
C u L u I 0:
I
-
A 4 I = 0 z--
A T T T I M EFIG. 6-Corructiirg lire test result Ji)r deviutio~r , / i o ~ n the stundurd
,~riruce-rri~rperutr~re-versrts-firire crrrve.
the test continues beyond the flaw, A T will gradually decrease. In- formation on the decrease is presented in Table 3.
In the light of the information presented in Figs. 2 t o 5 and Tables
2 and 3, it is possible now to review the four conclusions drawn in conn'ction with Eq 2, and thereby evaluate the utility of the ASTM correction formula.
Conclusion 1 is not valid. A 7/A A depends, in addition to the fire resistance time, on whether the flaw in Tf occurs earlier or later on into the test, and how long the test continues following the flaw. In practice, most flaws occur during the first 15 to 30 min of the test period.
Conclusion 2 is valid.
Conclusion 3 is approximately valid. Conclusion 4 is not valid.
Both the ASTM correction formula and the information obtained from the computer calculations suggest that under practical condi- tions the fire resistance credit or debit is not expected to amount to more than a few minutes.
According to available information [ 2 ] , errors in the test value of fire resistance resulting from such factors as differences in the char- acteristics of test furnaces, application of load during the test, speci- men boundary conditions (restraint and end fixity), and workman- ship of the specimen, may amount to much more than just a few minutes. It is not possible a t this time to correct for these types of errors. In this light, correcting the test results on account of flaws ir, the furnace-temperature-versus-time curve only, may seem overly pedantic.
Maximum Correction
A formula will be derived here for the estiniation of the maximum value of correction, which would be applicable if there had been no fading out of the consequences of the flaw. Based on the information given in Table 2. the flaw in the temperature of the exposed surface of the test specimen is roughly the same as the flaw in the furnace temperature. It is assumed, furthermore. that the heat transfer from the furnace gases to the specimen surface takes place by radia- tion from black gases: an assuniption which. as pointed out earlier, usually overconlpensates for the neglect of convective heat transfer. The excess normalized heat load on the test specimen ( A H ) due to a (positive) A Tf flaw in the furnace temperature, lasting for a period
A t . can be expressed (see Eq 3) as
where t = emissivity of the exposed surface of test specimen, usually
taken as 0.9. dimensionless, and a = Stefan-Boltzmann constant, 5.67 X 10K8 W m - 2 ~ - ? Ti and T, are. respectively, the tempera- ture of the furnace gases and the temperature of the exposed surface of the specimen under flawless condition, both in degrees Kelvin. In practice. one may select them as the temperatures prevailing at the middle of the flaw period A t
.
Since A Tf/TI 4 1 and A Tf/T, & 1, Eq 4 can be siniplified into the form
where A t A T i -= AA. An interesting featureof thisequation is that after 10 min into the test the term
(e
-~.:)/d/&
is independent, within an error of k3.575, of the value of dkpc. Since Tiand T, are functions of the time only, Eq 5 can be rewritten in the formwhere t is the time at which the flaw occurs (more exactly, the time at the midperiod of flaw).
As pointed out earlier, the fire resistance credit is expected to be the largest if the flaw in Tf occurs immediately before the termina- tion of the test. In that case, r = 7 .
T A B L E 3-Decrc,usr ( I / ' /;re resistutrcr credit lor duhirl ( A 7 ) ;/-the test coirritrurs he.voird the./luw iir T, .
A 7 as a Function of Time Lapse after the Occurrence of Flaw, min
Specimen Schcme 0 10 20 30 40 50 60 70 HO Normal B +l.6 +1.10 +0.96 +0.88 +0.82 +0.80 +0.78 +0.76 +0.74 weight C -1.55 -1.04 -0.90 -0.83 -0.78 -0.76 -0.74 -0.72 -0.70 concrete D +2.21
+
1.18 +0.96 +0.M E -2.12 -1.13 -0.93 -0.82 Insulating B +1.48 +0.78 f0.67 f0.63 f0.60 +0.58 f0.55 +0.54 +0.53 fire C -1.44 -0.76 -0.65 -0.61 -0.58 -0.56 -0.5fi -0.54 -0.53 brick D +2.38 +1.08 +0.87 +0.77 E -2.35 -1.07 -0.86 -0.76The relationship bet\vceri T and H has been approxiniated by the
equation 1.71
where 7 is now ill seconds for diniensional consistency. After differ-
entiation and turning to finite increments:
where the norniali~ed hear load ( H ) is, according to Eq 7. a unique function of 7. I t follows froni Eqs 6 (with I = T) and 8 that
The F(7) function has been calculated and is plotted as Curve 2 in Fig. 1 . The curve indicates fire resistance credits (or debits) higher than the ASTM credits (or debits) by a factor of 2 to 3. It should be remembered that A 7 i A A is not a unique function of the fire resis- tance time. and Curve 2 has been derived with the aim of obtaining information on the largest conceivable values for AT.
Not niuch is known about the ASTM correction forniula. Obvi- ously it was based on the concept that equal areas under the teniper- ature versus tinie curve represent fires of equal severity. Although that concept cannot be defended theoretically, it is interesting to note that. perhaps fortuitously. its application to the correction of the results of fire resistance tests yields conclusions in qualitative agreement with those arrived at on theoretical grounds.
HARMATHY ON FIRE RESISTANCE TESTS
307
Summary
It is not possible to devise a siniple forniula for correcting the re- sults of ASTM E 119 tests for flaws in the furnace teniperature. Al- though the empirical formula given in the standard specification does not. on the whole. contradict theoretical considerations, calcu- lations indicate that it niay yield low corrections.
The accurate way of correcting for the flaws is to calculate the nor- malized heat load on the test specimen in the flawed test and deter- mine the tinie pertaining to the same norniali~ed heat load in a flaw- less test.
Since under practical conditions the correction is not expected to aniount to more than a few minutes(which niay be negligible in com- parison with errors resulting from sources other than the inaccurate following of furnace-temperature-versus-time curve), an accurate assessment of the correction may not be justifiable.
The computer calculations were made by J. R. Mehaffey and K. Bardell. This paper is a contribution of the Division of Building Research. National Research Council of Canada, and is published with the approval of the Director of the Division.
References
-
111 Harmathy. T . 2.. "The Fire Kesistancc Test and Its Relation to Real- World Fires," Fire irtrd Mu~uriuls. Vol. 5. No. 3. Sept. 1981, pp. 112- 122.
121 AS'TM E5.I 1 Task Group, "Repeatability and Reproducibility of Ue- ults of AS'TM E 119 Fire Tests," Research Report RR: E5-1003, Amer- ican Society for Testing and Materials, Philadelphia. 1982.
1.71 Harmathy, T. 2. and Mehaffey. J. R.. "Post-Flashover Compartment