b
University of Burgundy, Le Creusot, France;
c
Radiology Department, University Hospitals & University of Geneva, Switzerland;
ABSTRACT
Journal images represent an important part of the knowledge stored in the medical literature. Figure classification has received much attention as the information of the image types can be used in a variety of contexts to focus image search and filter out unwanted information or ”noise”, for example non–clinical images. A major problem in figure classification is the fact that many figures in the biomedical literature are compound figures and do often contain more than a single figure type. Some journals do separate compound figures into several parts but many do not, thus requiring currently manual separation.
In this work, a technique of compound figure separation is proposed and implemented based on systematic detection and analysis of uniform space gaps. The method discussed in this article is evaluated on a dataset of journal figures of the open access literature that was created for the ImageCLEF 2012 benchmark and contains about 3000 compound figures.
Automatic tools can easily reach a relatively high accuracy in separating compound figures. To further increase accuracy efforts are needed to improve the detection process as well as to avoid over–separation with powerful analysis strategies. The tools of this article have also been tested on a database of approximately 150’000 compound figures from the biomedical literature, making these images available as separate figures for further image analysis and allowing to filter important information from them.
Keywords: medical image classification, information retrieval, image importance, image clustering, compound figure separation
1. INTRODUCTION
Medical image retrieval has been an important research domain over the past 20 years.1–3 Images have shown to
be an increasingly important part of medical diagnosis, and information stored in images and associated metadata need to be explored more efficiently to use the stored knowledge as decision support. The medical literature is a main source for biomedical knowledge and it has been rising strongly over the past 30 years.4, 5 Figures in
medical journals contain much information, especially in fields such as radiology. Besides text–based access6also
content–based access to the medical literature and its figures has been proposed several times.7, 8 To increase the
quality of image retrieval of journal figures, automatic modality classification and filtering of retrieval results has been shown to be effective.9 Compound figures represent about 50% of the figures in the biomedical open access
literature used for the ImageCLEF∗benchmark.10, 11 As these images often contain figures of several types, they
cannot be classified into unique classes and need to be separated before a detailed classification into the figure types can be performed.
Over the recent years, compound figure or subfigure separation has seen some research in the field of biomedi-cal image retrieval. Separating compound figures into separate subfigures produces sub–images with each of them having a single modality. The subfigure separation has shown to improve content–based image retrieval.12, 13
Related work in subfigure separation includes using separation methods based on the type of compound image Further author information: (Send correspondence to Henning M¨uller, Email: [email protected])
∗
according to prior manual classification14 or combining separate methods and using captions to estimate the
number of subfigures.12 An algorithm for text label extraction and identification was proposed by You et al.15
that shows good accuracy of subfigure label extraction. However, subfigure captions are not always available and in some cases contain inaccurate or incomplete information as we experienced on our database. Relying on completely different methods for various kinds of images can create difficulty with mixed modality images that are abundant in the literature. In this paper, a compound figure separation method for the medical literature at large scale is presented, with the following features:
• it is able to detect and segment subfigures in any type of compound figure, without prior knowledge of the image types;
• it uses visual information only, not relying on captions which can be inaccurate (but could also be used in a second step to increase performance);
• it uses a set of tunable rules that can be learned using a training subset of the figure dataset.
The algorithm developed in this work has been tested with a data set containing 2982 compound figure images. The results obtained from the evaluation of these images show high accuracy in the separation of compound figures. The paper is organized as follows: Section 2 describes the overall algorithm and all its details an a methods section, Section 3 gives an overview of how the experiments were performed and Section 4 contains the results of the evaluation before Section 5 concludes the paper.
2. METHODS
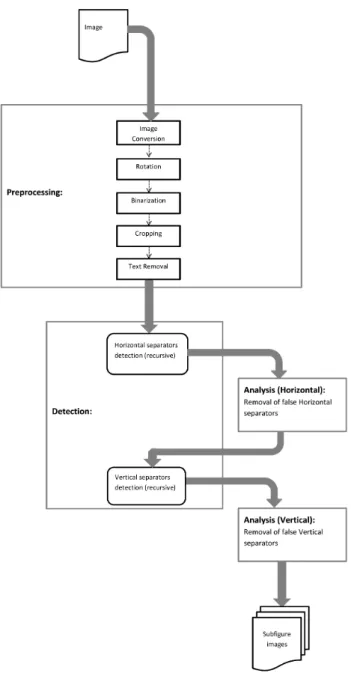
This section describes the main techniques reused for this article. Some of the parameter selections are already explained here although they are based on the evaluation using the training data. subsectionBasics of the developed algorithm Finding only the largest uniform space gaps in images is an obvious solution that can often easily separate 1x2, 2x1 and 2x2 subfigure images. Despite the stability of this method and a large percentage of subfigure images belonging to these classes, a method dealing with images consisting of an arbitrary number of compound figures in different arrangements was necessary in order to have a fully automatic algorithm. This functionality is obtained with a recursive separation scheme so that the separated compound figures from the above method are further separated into multiple sections until no probable separation is found. Instead of using a recursive scheme that finds separations indiscriminately, we propose a systematic scheme to first detect the horizontal separations and then the vertical separations from the horizontally segmented image parts. The last part of the method focuses on the analysis of the obtained candidate separation lines, where a set of rules are employed to remove false lines while keeping the true ones in the final output. The proposed method is unique in the sense that it transforms the problem of finding subfigures into two separate parts: detection and analysis. Furthermore, no information was included in the algorithm about the number or types of the subfigures present. Therefore with a trivial modification, the algorithm can also be used to classify if a given image is a compound figure image or not. The overview of the complete method is illustrated in Figure 1.
2.1. Dataset
The method was evaluated with images obtained from the ImageCLEF benchmark containing in total 300’000 images of the biomedical scientific literature, a subset of PubMedCentral†. A subset of 2982 manually
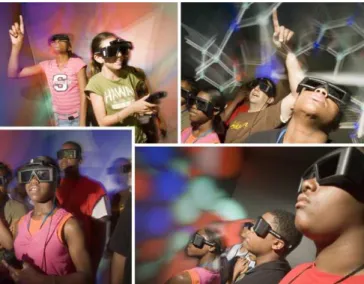
classi-fied compound figures was used for the tests in this article. These images were extracted randomly from the ImageCLEF database by manually separating compound and non–compound figures. The ground truth was constructed in a database for several subclasses of images (e.g. 2x1, 1x2, etc.). It was found in our study that uniform–space–separated compound figures form a major part of compound figure images, making up a vast majority of the database used in this work. However, there are classes of compound images that are either separated by rectangular boxes or are without any actual separation line or space, which are not specifically dealt with in this study. An example of such an image is shown in Figure 2.
Figure 1: Flow diagram showing the steps of the analysis for the compound figure separation.
2.2. Detection
To detect subfigures in images, pixel projections to the x–axis and y–axis were used to search for white–space gaps. Images containing uniform–space gaps were converted to images with white–space gaps by complement of standard deviation, which is described later. Pixel projections can be defined in several ways along the rows as well as the columns. Suppose an image pixel is represented as I(x, y) : x being the row and y the column index. If M and N are the total number of rows and columns in the image respectively, the minimum projection of a row x can be given as:
Figure 2: Example of a compound figure that is either separated by rectangular boxes or without any actual separation line or space. These types of images occur in the biomedical literature but are not specifically analyzed in this study.
Similarly, the mean projection for a row can be defined as: P rojmean(x) = 1 N N X y=1 I(x, y) (2)
In general, the mean projections preserve more information of an image by averaging all the pixel intensities of a row or column. In respect to finding uniform spaces for subfigure separation however, mean projections are not helpful for two important reasons:
• in a normal compound figure, mean projection gives a low contrast between separation and subfigure areas; • it often eliminates thin line pixels in graphs producing a false separation.
The minimum pixel intensity is favored here to find white rows or columns in the compound figure images. When the image background is not white, the image is either complemented or converted to a standard deviation image, thereby making it possible to apply the same projections and detection strategies for all kinds of uniform pixel backgrounds. A few important operations were added to improve the algorithm performance. Particularly, the first and last sequence of uniform white spaces are removed so that the detection does not produce a false line near the beginning or end of the image. Furthermore, a higher priority is given to divisions in the middle as would be the case in most of the images. This was found to make the divisions better in case of images with a large number of subfigures.
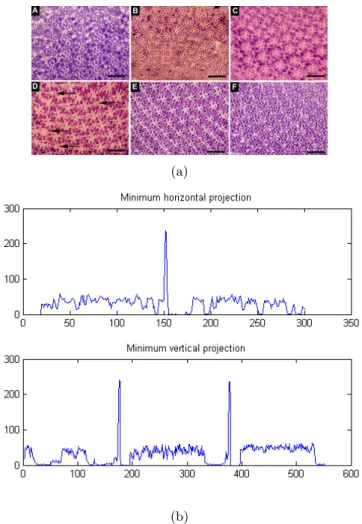
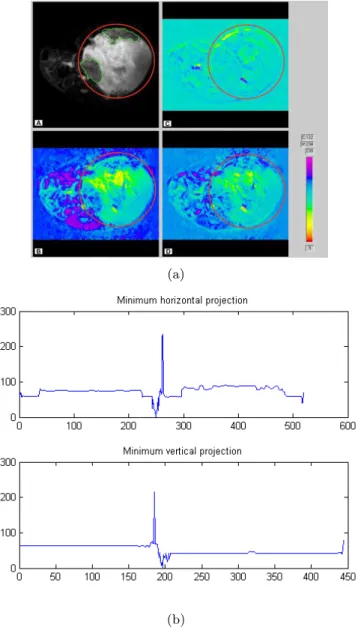
A few examples of minimum projection images along rows and columns are shown in Figure 3 with their corresponding image.
The proposed method relies on the minimum projection in order to find separations for all cases. The detailed strategies and operations used for detection are explained in the following paragraphs.
Order of Separator Detection From our study, it was found that analyzing all horizontal separators together with one module and vertical separators with another module enabled the use of several important features such as relative subfigure sizes. For this reason, the horizontal and vertical separators are not computed simultaneously but rather in two parts. First, all the horizontal separator positions are found using the recursive detection
(a)
(b)
Figure 3: Example of (a) an image and (b) its minimum projections.
by thresholding the minimum projections. To allow for variation due to noise, a threshold of 0.97 times the maximum value was used, based on manual tests on the training data. This was selected by analyzing the effect of various thresholding levels on the training dataset. The segmented pieces of the image thus obtained were further scanned for vertical separators. If more complicated placements of images are present, the method can be expanded using three levels, by incorporating an additional horizontal separation detector at the end. Rotation and Truncation As the method employed in the recursive scheme does not split the subfigures simultaneously by horizontal and vertical separators, under–separation can occur in a few cases. In order to reduce chances of under–separation, the aspect ratio of the image was used as a variable to switch between the order of the separator detection.
Apart from this, more preprocessing is needed due to the fact that certain captions and labels basically delete the white pixel gaps between the subfigures. Therefore, in most cases it is beneficial to remove certain portions of the image before the scanning of white pixel rows or columns is performed. The strategy we have used is to delete a minimum amount of border region and then proceed with the scanning. When the scanning fails to find any separation region, further truncation is done progressively, followed by text removal.
Text Removal It is difficult to define a fixed truncation percentage that does not eliminate figure parts producing false separation lines while removing text and labels. Text removal is an alternative for truncation and has several advantages over deleting image parts close to borders indiscriminately. In the proposed method,
text removal is done twice, first to improve detection of separators and then to analyze separators. Several algorithms have been proposed for text detection but because of the variability of text size, orientation and presence of other text–like graphic elements, the accuracy of the detection methods are limited in our case. Due to its flexibility and robustness, we have used the method of connected component analysis as used by Hasan and Karam16 with modifications to fit our dataset. A connected component is classified as non–text if all of the
following conditions are satisfied: • area > 100 pixels;
• major axis length > 50 pixels;
• minor Axis length < 4 pixels or minor axis length > 10 pixels; • solidity > 0.01;
where, solidity is defined as the ratio of the pixel area in the convex hull of the region to the total area of the region. To find possible separations, the text regions detected with this algorithm were replaced by white pixels. Although the text removal strategy produces the correct number of subfigures in most cases, it also creates several problems such as misclassified labels, captions or minor figure elements. Therefore, this operation is used only when no separation is found in the separation process after a certain number of truncations.
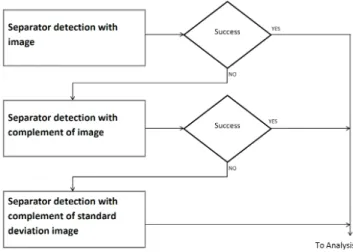
Complemented Image and Standard Deviation Image Projections Although a large majority of the images in the database contained white–space separated compound figure images, a few of them were either separated by uniform pixels with gray values close to 0 or in rarer cases any arbitrary value. To tackle this, whenever there is no detection from the original grayscale image, the image is complemented and binarized to scan for black pixels in the original image. When this also fails to detect a separator, the complement of the standard deviation image is employed. Introducing this method produced a slightly improved accuracy and included a larger number of applicable images. Although, the detection based on the standard deviation image can find separations in all three types of preprocessing, using the particular order produced higher accuracy and precision. This is illustrated in the flow diagram in Figure 4.
Figure 4: Flow diagram showing the use of image preprocessing for detection.
(a)
(b)
Figure 5: Example of (a) an image and (b) minimum projections for its standard deviation image. Binarization The images containing the subfigures are often corrupted by noise related to compression or sometimes due to an image scanning process. These types of noise make it particularly hard to separate subfigures that have very little uniform space between them. To tackle noise, several filtering methods were tested but no particular method was found to be suitable to this problem. Finally, we have employed binarization under specific conditions to remove problems due to noise. It was found that binarization of graphs and illustrations most often results in the detection of false separators due to faint lines being rendered as white. However, the most important image classes affected by noise are compound images separated by thin uniform spaces. These classes of images are identified by calculating the white pixel percentage in the image.
2.3. Separation analysis
One of the major achievements in this work is the division of the subfigure separation into two parts: detection and analysis. The analysis of probable separations that are classified in a second step as true or false is the most difficult part in the separation process and requires the use of several rules and strategies. Although there are no clear features that can directly determine the true/false classification of separation lines, several rules can be
used to achieve a good performance. These rules are weighted so that the satisfaction of some rules takes more importance than the fulfillment of others. In our work, we tested the SVM classification on the features with a training dataset containing manually classified separators of 1444 compound images. Based on preliminary work, we found that the classifier performed poorly for this particular task. One reason for this is that some of the features belong to the subfigures rather than the separators, thereby complicating the training procedure. As the rules are fairly complex, diverse and finely tuned to the given problem, the rule-based method of classification was found to perform better than the SVM classifier. In the rule based analysis process, horizontal separations are computed and subsequently analyzed for possible removal. The process is repeated for vertical separations found in each of the horizontal subdivisions. Thus, several vertical separators can be associated with a single horizontal separator. The main rules and features used are described in detail below.
Closeness to the Border False separations can often be obtained with separators too close to the borders. Therefore, an absolute removal weight is used for this when a separator is obtained at a distance less than 13% of the image dimension from a border. This will restrict the number of figures that can be present along one dimension to be less than or equal to 7 but it will also remove false lines that are often detected after the image titles or before the captions. A similar procedure is applied to remove divisions too close to each other.
Division ratio This feature models how each division divides the image into two parts. Because of recursive division, this feature is not the same as the closeness to border and only a small weight is given to this rule. Subfigure Sizes Subfigure sizes are checked after the above preliminary rules are used to remove most of the false separations. Then, each subfigure size is compared to the largest size (height or width) in order to merge some candidate subfigures. The basic motivation here is the assumption that subfigures are in many cases of similar sizes. This is a very important rule that was found to eliminate most of the false separations. When the distance between two separators is too small, the separator with the smallest white space gap is removed. By analyzing the accuracy in the training set, a rule was added to remove the relevant separator line in case the subfigure size is found to be less than 0.35 times the maximum subfigure size.
Standard Deviation and Text Removal Analysis The standard deviation is used together with the sub-figure sizes, to eliminate practically empty sub-figures that usually contain small text components. The standard deviation is calculated for x and y coordinates of non–white pixels in the separated figure. Apart from this, further rules are added based on the analysis of figure content after applying text removal. These rules were found to work well in removing false separations for images containing many uniform gaps. A measurement feature is extracted based on the following calculation.
std measure=stdx N ×
stdy
M (3)
where, M and N are the height and width respectively of the subfigure image parts.
Histogram features Two adjacent candidate subfigures for each separator are extracted and the histograms for these figures are obtained. This rule eliminates false separators that give highly dissimilar white pixel ratios obtained from the two histograms. Another important histogram feature rule is to compare the absolute white pixel ratio of each figure. The white pixel ratio is calculated both before and after the text removal analysis. This gives a number of features that can be used to deduce whether a subfigure contains just a small amount of text or if it is a valid subfigure with diagrams or images. When the white pixel ratio is too high, both before and after text analysis, it most probably means that the subfigure is empty or there is an unnecessary separator line.
boundaries were tested with a 7% tolerance margin relative to the image dimensions, i.e., separator positions that differed by more than 7% were concluded to be false separators. The dataset was split into two parts for training and testing. The training was done manually to tune the thresholds in the rule based classification. In the rule based analysis of separators, slightly different conditions were used for the horizontal and vertical separators in order to tune for the best output with the training set. Although our configuration supports classification of separators with other supervised classifiers, we have selected the rule–based classifier for its accuracy. The rules and their parameters/thresholds used for analysis have been designed by studying the false detections and tuned to achieve a good performance on a training set of 1444 images. The test and training data sets are available for other research groups.
3. EXPERIMENTAL RESULTS
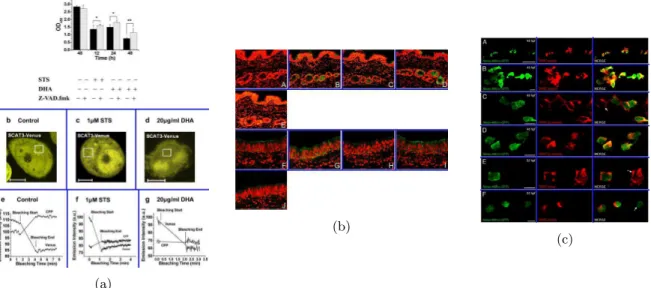
The results on the test set the complete database show a good performance. Evaluation of separation lines shows a sensitivity of 85.23% and precision of 84.26%. With the specified experimental setting, the time required for segmentation of each image was about 2.4 second. The results analysis was also done on different subclasses of images based on the number of subfigures and their arrangement. The results are obtained for each subfigure separator rather than individual compound figures. This is summarized in Table 1. Figure 6 shows examples of successful subfigure separation results.
(a)
(b)
(c)
Figure 6: Examples of successful separation results
To obtain good results for our dataset, manual optimization was done to find the appropriate parameters using the training data set . The thresholding parameters used for different operations were thus chosen using a systematic analysis based on a series of experiments. In particular, the order of separation detection was chosen by comparing results on the training data. Thus, the order was switched only when the aspect ratio is greater than 1.5, effectively reversing the order by finding first the vertical and then the horizontal separators of the original image. For binarization, when the (almost) white pixel percentage (percentage of pixels higher than
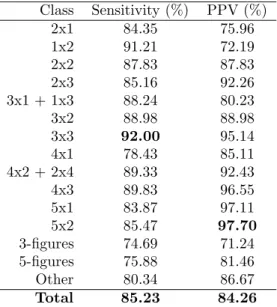
Class Sensitivity (%) PPV (%) 2x1 84.35 75.96 1x2 91.21 72.19 2x2 87.83 87.83 2x3 85.16 92.26 3x1 + 1x3 88.24 80.23 3x2 88.98 88.98 3x3 92.00 95.14 4x1 78.43 85.11 4x2 + 2x4 89.33 92.43 4x3 89.83 96.55 5x1 83.87 97.11 5x2 85.47 97.70 3-figures 74.69 71.24 5-figures 75.88 81.46 Other 80.34 86.67 Total 85.23 84.26
Table 1: Sensitivity and Positive Predictive Value (PPV) for each compound figure subclass
248) is less than 40%, the image is binarized with a threshold calculated from the histogram of the image. The detection of this threshold is done using the 80 percentile value so that the lowest valued 80% of the image pixels are converted to black (0) and the rest to white (1).
4. DISCUSSION
With the results obtained from the MATLAB implementation of the algorithm, our two–phase approach of detection and analysis for subfigure separation shows good results. The detection was handled with and without preprocessing of the subfigure images. The best results were obtained with preprocessing only when certain conditions were satisfied or when direct application of the method failed. As the majority of the image classes are simple enough to be handled without preprocessing, this approach is computationally efficient as well as accurate.
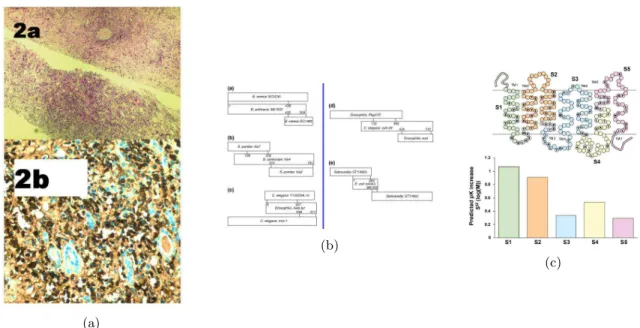
It can be seen from the results that the sensitivity of the separator detection can still be improved as it does not work perfectly well in all cases. Although most of the difficult types of subfigure segmentation have been addressed by our algorithm, some specific types of compound figures are currently not handled perfectly well. Subfigures that do not have a continuous uniform space between the parts are not detected by the methods discussed in this article. Apart from this, difficulties arise due to the particular sequence of detecting horizontal separators followed by vertical separators. Subfigure images exist that cannot be separated by a rectangular area. The failed separation results for these types of images are shown in Figure 7.
Comparison between the approaches on subfigure separation is difficult as there is no common data set at the moment. Furthermore, there is also no concrete guideline for defining compound figures or subfigures. Nevertheless, the work presented in this article shows that the results are at least comparable to those presented by others. Antani et al.14 have reported a sensitivity of 95.78% and 94.38% in segmenting single panel and
multi panel subfigures respectively. Cheng, Antani et al.12 used two methods based on the modality to improve
the algorithm but they tested their implementation on a different dataset. Apostolova et al.17 have presented
their results on a subset of the open ImageCLEF benchmark but the actual dataset has not been made available publicly.
It is necessary to note that the results of separation are sometimes at least partly subjective due to the lack of strict guidelines for defining what compound figures are, as previously mentioned. Although, the subfigure labels can provide a useful guide to decide on the number of actual subfigures in the image, this is often not the case. Frequently, subfigures carrying independent information are grouped by a single label and on the
subfigures that are graphs or illustrations should have separate axes label/information if present; • subfigures may or may not have different labels or captions.
(a)
(b)
(c)
Figure 7: Examples of separation failures (a) subfigures stitched without spaces between them (b) subfigures arranged in an order not separable when horizontal separators are searched before vertical (c) subfigures not separable by any row or column
5. CONCLUSIONS
The goal of the work presented in this article was to develop an automatic tool to segment subfigures of any type that are present in different arrangements with accurate boundaries in the biomedical literature. The goals have been reached in large part although some problems still need to be addressed. Through the tool for separating biomedical compound figures the number of images available for image search and modality classification has tripled on the ImageCLEF database from 300’000 images to about one million. This facilitates a much more detailed search and analysis and allows filtering of unwanted information effectively. Until publishers will require subfigures to be submitted separately, such a separation of compound figures seems necessary to separate visual image content for further analysis. For the future work, more algorithms can be investigated for classification of the separators and text removal. Furthermore, in this scheme, more features can easily be supported that facilitate the classification of the separator lines. Despite the remaining error rate such a technique can assist tools for automatic image classification and in making image retrieval an important tool in clinical practice.
6. ACKNOWLEDGEMENTS
We would like to thank the European Union for their funding in the context of the Khresmoi project (grant number 257528) and the Swiss National Science foundation (grant number 205321–130046).
REFERENCES
1. H. M¨uller, N. Michoux, D. Bandon, and A. Geissbuhler, “A review of content–based image retrieval systems in medicine–clinical benefits and future directions,” International Journal of Medical Informatics 73(1), pp. 1–23, 2004.
2. C. Akg¨ul, D. Rubin, S. Napel, C. Beaulieu, H. Greenspan, and B. Acar, “Content–based image retrieval in radiology: Current status and future directions,” Journal of Digital Imaging 24(2), pp. 208–222, 2011. 3. H. D. Tagare, C. Jaffe, and J. Duncan, “Medical image databases: A content–based retrieval approach,”
Journal of the American Medical Informatics Association 4(3), pp. 184–198, 1997.
4. L. Hunter and K. B. Cohen, “Biomedical language processing: What’s beyond pubmed?,” Molecular Cell 21, pp. 589–594, Mar 2006.
5. “Riding the wave: How europe can gain from the rising tide of scientific data.” Submission to the European Comission, available online at http://cordis.europa.eu/fp7/ict/e-infrastructure/docs/ hlg-sdi-report.pdf, October 2010.
6. W. Hersh, Information Retrieval — A health and Biomedical Perspective, Springer, 2003 – second edition. 7. H. M¨uller, J. Kalpathy-Cramer, C. E. K. Jr., and W. Hersh, “Comparing the quality of accessing the medical
literature using content–based visual and textual information retrieval,” in SPIE Medical Imaging, 7264, pp. 1–11, (Orlando, Florida, USA), February 2009.
8. T. M. Deserno, S. Antani, and L. R. Long, “Content–based image retrieval for scientific literature access,” Methods of Information In Medicine 48, pp. 371–380, July 2009.
9. J. Kalpathy-Cramer, W. Hersh, S. Bedrick, and H. M¨uller, “Query analysis to improve medical image retrieval,” in Society for Imaging Informatics in Medicine (SIIM) 2008, (Seattle, USA), May 2008.
10. J. Kalpathy-Cramer, H. M¨uller, S. Bedrick, I. Eggel, A. Garc´ıa Seco de Herrera, and T. Tsikrika, “The CLEF 2011 medical image retrieval and classification tasks,” in Working Notes of CLEF 2011 (Cross Language Evaluation Forum), September 2011.
11. H. M¨uller, A. Garc´ıa Seco de Herrera, J. Kalpathy-Cramer, D. Demner Fushman, S. Antani, and I. Eggel, “Overview of the imageclef 2012 medical image retrieval and classication tasks,” in Working Notes of CLEF 2012 (Cross Language Evaluation Forum), September 2012.
12. B. Cheng, S. Antani, R. J. Stanley, and G. R. Thoma, “Automatic segmentation of subfigure image panels for multimodal biomedical document retrieval,” in Document Recognition and Retrieval, G. Agam and C. Viard-Gaudin, eds., SPIE Proceedings 7874, pp. 1–10, SPIE, 2011.
13. J. Kalpathy-Cramera and W. Hersh, “Automatic image modality based classification and annotation to improve medical image retrieval,” Studies in Health Technology and Informatics 129, pp. 1334–1338, 2007. 14. S. Antani, D. Demner-Fushman, J. Li, B. V. Srinivasan, and G. R. Thoma, “Exploring use of images in clinical articles for decision support in evidence-based medicine,” in Document Recognition and Retrieval, B. A. Yanikoglu and K. Berkner, eds., SPIE Proceedings 6815, p. 68150, SPIE, 2008.
15. D. You, S. Antani, D. Demner-Fushman, V. Govindaraju, and G. R. Thoma, “Detecting figure–panel labels in medical journal articles using mrf,” in International Conference on Document Analysis and Recognition, pp. 967–971, IEEE, (Beijing, China), 2011.
16. Y. M. Y. Hasan and L. J. Karam, “Morphological text extraction from images,” IEEE Transactions on Image Processing 9(11), pp. 1978–1983, 2000.
17. E. Apostolova, D. You, Z. Xue, S. Antani, D. Demner-Fushman, and G. R. Thoma, “Image retrieval from scientific publications: text and image content processing to separate multi–panel figures,” Journal of the American Society for Information Science , 2013 — to appear.