HAL Id: hal-01894173
https://hal.archives-ouvertes.fr/hal-01894173
Submitted on 12 Mar 2019
HAL is a multi-disciplinary open access
archive for the deposit and dissemination of
sci-entific research documents, whether they are
pub-lished or not. The documents may come from
teaching and research institutions in France or
abroad, or from public or private research centers.
L’archive ouverte pluridisciplinaire HAL, est
destinée au dépôt et à la diffusion de documents
scientifiques de niveau recherche, publiés ou non,
émanant des établissements d’enseignement et de
recherche français ou étrangers, des laboratoires
publics ou privés.
Simultaneous pulse wave and flow estimation at
high-framerate using plane wave and transverse
oscillation on carotid phantom
Vincent Perrot, Lorena Petrusca, Adeline Bernard, Didier Vray, Herve
Liebgott
To cite this version:
Vincent Perrot, Lorena Petrusca, Adeline Bernard, Didier Vray, Herve Liebgott. Simultaneous pulse
wave and flow estimation at high-framerate using plane wave and transverse oscillation on carotid
phantom.
IEEE International Ultrasonics Symposium, 2017, Washington, USA, United States.
Simultaneous pulse wave and flow estimation at
high-framerate using plane wave and transverse
oscillation on carotid phantom
Vincent Perrot, Lorena Petrusca, Adeline Bernard, Didier Vray and Herv´e Liebgott
Univ. Lyon, INSA-Lyon, UCBL, UJM-Saint- ´Etienne, CNRS, Inserm, CREATIS UMR 5220, U1206, F-69621 Lyon, France
Abstract—In this paper a global estimation method based on transverse oscillation to simultaneously extract wall and flow velocities at high-framerate is presented. Several carotid phantoms with various parameters were made to validate the method. All acquisitions were performed at high-framerate (7 500 images per second) using horizontal plane wave with a 3 cycles sinusoidal transmit pulse. Transverse oscillation was introduced in post-acquisition. Finally, velocity vectors were extracted thanks to a phase based estimator with a region of interest of 2 mm (8 axial wavelengths) per 2.96 mm (2 lateral wavelengths) for each pixel. Results are promising, all standard deviations are lower than 10 % and the method is now validated for a deeper study. Indeed, flow and pulse wave velocities computed by the algorithm are in accordance with pressure columns and number of freeze-thaw cycles.
Index Terms—pulse wave, flow, transverse oscillation, plane wave, motion estimation, flow estimation, carotid phantom
I. INTRODUCTION
Ultrafast or high-framerate ultrasound imaging is an imaging modality which has been developed over the last fifteen years and which has found numerous applications [1]. Indeed, plane wave imaging allows a high-framerate of more than 1 000 images per second (according to depth of interest) against 150 images per second at most for conventional imaging [2]. This increased framerate is useful to image fast phenomena of tissues [3], [4]. Plane wave imaging is used for artery elasticity assessment as well as flow estimation [5], [6].
With the purpose of evaluating the healthy or pathological state of blood vessels, one usual method consists to measure several parameters linked to hemodynamic (flow) [7] or to mechanical parameters of arterial wall (wall thickness, distensibility, pulse wave velocity) [8]. These two aspects are generally assessed using two different ultrasound sequences
The Verasonics system was cofounded by the FEDER program, Saint-Etienne Metropole (SME) and Conseil General de la Loire (CG42) within the framework of the SonoCardioProtection Project leaded by Pr Pierre Croisille and Dr Magalie Viallon as principal investigators. This work was also per-formed within the framework of the LABEX CELYA (ANR-10-LABX-0060) and LABEX PRIMES (ANR-10-LABX-0063) of Universit´e de Lyon, within the program ”Investissements d’Avenir” (ANR-11-IDEX-0007) operated by the French National Research Agency (ANR).
and processing techniques. This can be explained by the difference in terms of signal intensity between the tissue and blood (more than 40 dB). But also the nature of blood and wall’s motion is different in terms of direction (along the vessel for flow and perpendicular to the vessel for pulse wave) and velocity. However, wall and flow are naturally linked and should be analyzed together. In order to better evaluate and understand blood-wall interaction, an imaging technique able to provide simultaneously both characteristics would be highly relevant.
Transverse oscillation has been developed for flow estimation and provides 2D velocity estimation [9], [10]; our group was among the first to propose a method combining the transmission of plane wave with transverse oscillation for flow imaging [11]. Moreover, the method has been adapted for tissue motion estimation [12], [13]. Consequently, we propose to use transverse oscillation technique to simultaneously extract flow and wall motion at high-framerate using one unique plane wave sequence.
The aim of this paper is to show the feasibility of the method with a carotid phantom (PVA) filled with a blood-mimicking fluid (Orgasol R). Different set-ups in terms of pressure (flow)
and stiffness (wall) have been investigated. In the following, section II introduces the experimental set-up, the material and the adapted transverse oscillation method for simultaneous blood and wall motion imaging. Then section III presents the results. Finally, section IV concludes the paper with a brief summary of the method and results.
II. MATERIAL AND METHOD
A. Experimental set-up
Several PVA phantoms have been molded (Tab. I) for the experiments in order to mimic carotid artery, and an Orgasol R solution has been used to mimic blood. The
phantom preparation was composed of PVA, silica and distilled water (10 %, 1 % and 89 % in weight, respectively). PVA acquires its properties by freeze-thaw cycles process; the higher the number of cycles, the higher the Young’s modulus. PVA ensures elasticity while silica provides
scatterers in vessel wall. The resulting phantoms are very close to biological tissues in terms of acoustic and mechanical characteristics [14]. Finally, phantoms with four different number of freeze-thaw cycles (from 2 to 5 cycles) have been investigated (Tab. I). For each number of cycles two samples have been produced. The blood mimicking fluid was made with 5 µm Orgasol R, glycerol, surfactant and distilled water
(2 %, 10 %, 1 % and 87 % in weight, respectively). Orgasol R
provides scatterers, glycerol sets viscosity and surfactant ensures that the scattering particles are dispersed in the fluid. The resulting blood-mimicking fluid is in accordance with the standard physical and acoustic properties of blood [15].
TABLE I
EXPERIMENTAL CONDITIONS Phantom length 8 cm Phantom internal diameter 8 mm Phantom thickness 2 mm Valve opening duration 300 ms Number of freeze-thaw cycles 2, 3, 4, 5
Column height 25 cm, 45 cm
The inlet of the phantom is connected to a fluid column (filled with the blood-mimicking fluid) while the output is connected to an open tank (at the ambient pressure of the experiment room) and the phantom is immersed in water for ultrasound measurement. A solenoid-valve, controlled by a function generator is placed between the inlet and the pressure column to set the flow cycles (Tab. I). The experimental set-up is idle before each acquisition and experiment.
B. Data acquisition
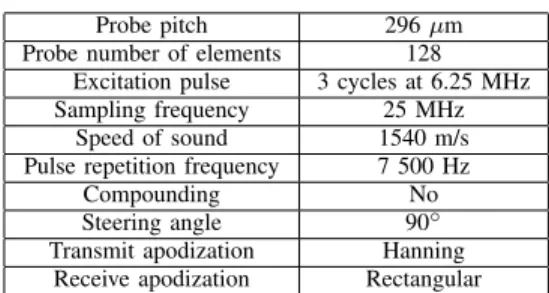
TABLE II ACQUISITION PARAMETERS
Probe pitch 296 µm
Probe number of elements 128 Excitation pulse 3 cycles at 6.25 MHz Sampling frequency 25 MHz
Speed of sound 1540 m/s Pulse repetition frequency 7 500 Hz
Compounding No
Steering angle 90◦ Transmit apodization Hanning
Receive apodization Rectangular
In this study, a Verasonics ultrasound system (Verasonics Inc., Redmond, WA) with the L7-4 probe were used; acqui-sition parameters are described in Tab. II. Acquiacqui-sitions were performed with plane wave; only one horizontal plane wave was transmitted in order to achieve an ultrafast imaging at high-framerate (no compounding). The ultrasound probe was immersed in water and placed parallel to the superior wall at a depth of 6 mm. The Verasonics system was triggered by the function generator to start acquisition 100 ms before the activation of the solenoid valve which remains opened during 300 ms and data were acquired during a total time of 1.2 s. For
each configuration (phantom, number of freeze-thaw cycles and column height) 3 acquisitions were performed resulting in 48 acquisitions in total. The reconstruction was done in post-acquisition using the Stolt’s migration technique performed in the Fourier domain [16].
C. Flow and wall motion estimation
Before flow and wall estimation a regression polynomial wall filter was applied on each pixel along time. The fitting polynomial was removed to keep the high-frequency components only [17]. Motion (wall and flow) estimation technique is based on transverse oscillation technique.
In this work, the implementation of transverse oscillation was performed in post-acquisition in the Fourier domain [18]; this method consists to multiply the 2D Fourier spectrum of each RF image to only keep the desired lateral wavelength. The resulting Fourier spectrum is composed of ”four” spots corresponding to the axial (natural) and lateral (introduced with the mask multiplication) frequencies. Once the image has been filtered with this approach it becomes possible to extract the 2D motion vector map using the phase-based technique described in [19]. Transverse oscillation was introduced with a wavelength of 1.48 mm, the natural oscillation due to ultrasound along the axial axis has a wavelength of 0.25 mm. Motion was computed between each successive frame through a block of 2 mm (8 axial wavelengths) per 2.96 mm (2 lateral wavelengths). After estimation, velocities are filtered by a mean temporal filter of 25 ms. For displaying the results, flow velocity is only showed on the central part of the probe (width of 2 cm) due to a lack of signal near the image edges. However, wall velocity is completely displayed because the intensity signal is sufficient in the wall.
III. RESULTS
A. Flow and pulse wave visualization
The main interest of the method is to directly quantify and visualize flow and pulse wave simultaneously. An example of this kind of visualization is provided (Fig. 1) for one phantom of this study.
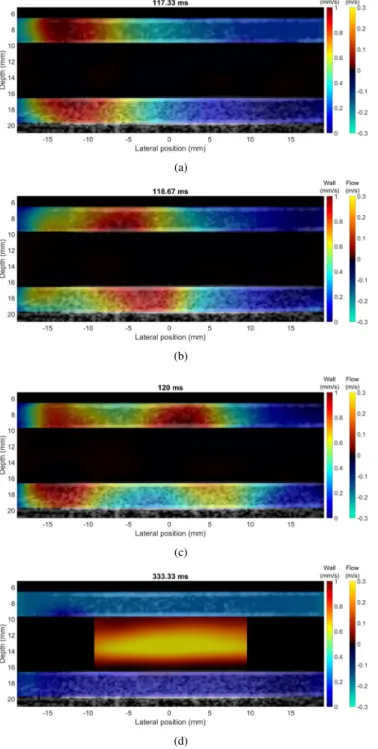
The wall and flow have different properties. Concerning the velocities, the wall is subject to a maximum velocity of 1 mm/s (Fig. 1 (a), (b), (c) and (d)) while the maximum flow velocity is around 0.3 m/s (Fig. 1 (d)). Moreover, wall motion is estimated from the axial axis whereas flow is extracted from the lateral axis. More importantly, the maximum wall velocity and the maximum flow velocity are delayed in time. In fact, the maximum wall velocity can be seen at the beginning of the acquisition when the pulse wave crosses the phantom (Fig. 1 (a), (b) and (c)) between 117.33 ms to 120 ms from left to right. During the propagation of the pulse wave the flow is close to zero. Indeed, the maximum estimated velocity profile is noticeable at 333.33 ms (Fig. 1 (d)) and when the flow is maximum the wall velocity is minimum. The difference of signal between the flow and the wall was measured to
(a)
(b)
(c)
(d)
Fig. 1. Four snapshots of the wall and flow velocities at 117.33 ms (a), 118.67 ms (b), 120 ms (c) and 333.33 ms (d) after the beginning of an acquisition. Wall velocity is expressed in mm/s while flow velocity is displayed in m/s only on the center part of the lumen. (a), (b) and (c) show the pulse wave arriving from the left part of the phantom. (d) corresponds to the time when the flow is maximum at the center of the lumen.
approximately 40 dB (center of the lumen and distal wall). Consequently, the wall intensity is more important than flow intensity and a gap in terms of signal is present as is the case for real carotid data. The algorithm is able to extract a large range of velocities which is vital for simultaneously quantifying wall and flow. In addition, the method is able to
extract vector velocities as required for wall and flow study. B. Flow according to pressure
Flow has been estimated for two different pressure columns (25 cm and 45 cm), the resulting profiles across the vessel (average and standard deviation) are shown below (Fig. 2).
Profiles are quasi-parabolic with a maximum value of 0.399 m/s ± 6.5 % in high pressure and 0.327 m/s ± 4.0 % in low pressure. Maximum flow velocity decreased as expected with input pressure and the standard deviations remain low in comparison with the maximum values.
Fig. 2. Estimated velocity profiles on average (with all phantoms from 2 to 5 cycles) for the high pressure (blue) and the low pressure (red) at 333.33 ms.
C. Pulse wave velocity according to elasticity
Pulse wave velocity can be extracted from wall velocity maps by tracking the propagation of the wall velocity front (Fig. 1 (a), (b) and (c)) along time. The position of the propagating pulse wave was defined where the wall acceleration attains its maximum and correspond to the foot of the pulse wave. The results for each number of freeze-thaw cycles (on average with standard deviation) are displayed (Fig. 3).
The pulse wave velocity increases with the number of freeze-thaw cycles as predicted from 2.21 m/s ± 1.78 % to 4.89 m/s ± 7.63 %. Moreover, the shape of the curve matches with our expectations. Indeed, the theoretical curve
Fig. 3. Estimated pulse wave velocities on average depending on freeze-thaw cycles.
converges after 5 freeze-thaw cycles. The standard deviations remain small in regard to the pulse wave velocities even if they increase with the number of freeze-thaw cycles. The first explanation is that the number of frames where the pulse wave velocity is propagating decrease with the increase of the pulse wave velocity which causes a loss of robustness. Secondly, the phantoms were made in a month and in several steps. Consequently, a few differences during the thawing process might have occurred in particular some temperature variation. Nevertheless, the method is still able to extract pulse wave velocity in accordance with the elasticity of the medium.
IV. SUMMARY AND CONCLUSION
In this paper, an imaging method able to provide simultaneously information about pulse wave propagation and blood flow has been proposed and investigated. It is based on transverse oscillation with horizontal plane wave insonification.
The algorithm is able to estimate the velocity vector from flow (lateral) and wall (axial). The validation process has been performed on a total of 48 plane wave acquisitions composed with 8 phantoms with various stiffnesses and flow velocities. Pulse wave velocities were computed from 2.21 m/s to 4.89 m/s and estimated flow velocities are 0.399 m/s and 0.327 m/s; all standard deviations are lower than 10 %. Results show that the technique allows a simultaneous study and visualization of flow and wall motion. Moreover, fastest phenomena like pulse wave can be extracted after computa-tion. The estimated flows and pulse wave velocities are in accordance with the applied pressure columns and stiffnesses, respectively, which validate the feasibility of our approach.
REFERENCES
[1] M. Tanter and M. Fink, “Ultrafast imaging in biomedical ultrasound,” IEEE Transactions on Ultrasonics, Ferroelectrics, and Frequency Con-trol, vol. 61, no. 1, pp. 102–119, jan 2014.
[2] D. Vray, E. Brusseau, V. Detti, F. Varray, A. Basarab, O. Beuf, O. Basset, C. Cachard, H. Liebgott, and P. Delachartre, “Ultrasound medical imaging,” in Medical Imaging Based on Magnetic Fields and Ultrasounds. John Wiley & Sons, Inc., mar 2014, pp. 1–72.
[3] J. Vappou, J. Luo, and E. E. Konofagou, “Pulse wave imaging for noninvasive and quantitative measurement of arterial stiffness in vivo,” American Journal of Hypertension, vol. 23, no. 4, pp. 393–398, apr 2010.
[4] T. Mirault, M. Pernot, M. Frank, M. Couade, R. Niarra, M. Azizi, J. Emmerich, X. Jeunemaˆıtre, M. Fink, M. Tanter, and E. Messas, “Carotid stiffness change over the cardiac cycle by ultrafast ultrasound imaging in healthy volunteers and vascular ehlers–danlos syndrome,” Journal of Hypertension, vol. 33, no. 9, pp. 1890–1896, sep 2015. [5] J. Udesen, F. Gran, K. Hansen, J. Jensen, C. Thomsen, and M. Nielsen,
“High frame-rate blood vector velocity imaging using plane waves: Simulations and preliminary experiments,” IEEE Transactions on Ultra-sonics, Ferroelectrics and Frequency Control, vol. 55, no. 8, pp. 1729– 1743, aug 2008.
[6] S. Fadnes, I. K. Ekroll, S. A. Nyrnes, H. Torp, and L. Lovstakken, “Ro-bust angle-independent blood velocity estimation based on dual-angle plane wave imaging,” IEEE Transactions on Ultrasonics, Ferroelectrics, and Frequency Control, vol. 62, no. 10, pp. 1757–1767, oct 2015. [7] P. M. Hansen, J. B. Olesen, M. J. Pihl, T. Lange, S. Heerwagen,
M. M. Pedersen, M. Rix, L. L¨onn, J. A. Jensen, and M. B. Nielsen, “Volume flow in arteriovenous fistulas using vector velocity ultrasound,” Ultrasound in Medicine & Biology, vol. 40, no. 11, pp. 2707–2714, nov 2014.
[8] A. Bjallmark, B. Lind, M. Peolsson, K. Shahgaldi, L.-A. Brodin, and J. Nowak, “Ultrasonographic strain imaging is superior to conventional non-invasive measures of vascular stiffness in the detection of age-dependent differences in the mechanical properties of the common carotid artery,” European Journal of Echocardiography, vol. 11, no. 7, pp. 630–636, mar 2010.
[9] J. Jensen and P. Munk, “A new method for estimation of velocity vec-tors,” IEEE Transactions on Ultrasonics, Ferroelectrics and Frequency Control, vol. 45, no. 3, pp. 837–851, may 1998.
[10] J. Jensen, “A new estimator for vector velocity estimation [medical ultrasonics],” IEEE Transactions on Ultrasonics, Ferroelectrics and Frequency Control, vol. 48, no. 4, pp. 886–894, jul 2001.
[11] M. Lenge, A. Ramalli, P. Tortoli, C. Cachard, and H. Liebgott, “Plane-wave transverse oscillation for high-frame-rate 2-d vector flow imaging,” IEEE Transactions on Ultrasonics, Ferroelectrics, and Frequency Con-trol, vol. 62, no. 12, pp. 2126–2137, dec 2015.
[12] H. Liebgott, A. Basarab, P. Gueth, D. Friboulet, and P. Delachartre, “Transverse oscillations for tissue motion estimation,” Ultrasonics, vol. 50, no. 6, pp. 548–555, may 2010.
[13] S. Salles, A. J. Y. Chee, D. Garcia, A. C. H. Yu, D. Vray, and H. Liebgott, “2-d arterial wall motion imaging using ultrafast ultrasound and trans-verse oscillations,” IEEE Transactions on Ultrasonics, Ferroelectrics, and Frequency Control, vol. 62, no. 6, pp. 1047–1058, jun 2015. [14] J. Fromageau, J.-L. Gennisson, C. Schmitt, R. Maurice, R. Mongrain,
and G. Cloutier, “Estimation of polyvinyl alcohol cryogel mechanical properties with four ultrasound elastography methods and comparison with gold standard testings,” IEEE Transactions on Ultrasonics, Ferro-electrics and Frequency Control, vol. 54, no. 3, pp. 498–509, mar 2007. [15] K. V. Ramnarine, D. K. Nassiri, P. R. Hoskins, and J. Lubbers, “Validation of a new blood-mimicking fluid for use in doppler flow test objects,” Ultrasound in Medicine & Biology, vol. 24, no. 3, pp. 451–459, mar 1998.
[16] D. Garcia, L. L. Tarnec, S. Muth, E. Montagnon, J. Poree, and G. Cloutier, “Stolt’s f-k migration for plane wave ultrasound imaging,” IEEE Transactions on Ultrasonics, Ferroelectrics, and Frequency Con-trol, vol. 60, no. 9, pp. 1853–1867, sep 2013.
[17] S. Bjaerum, H. Torp, and K. Kristoffersen, “Clutter filter design for ultrasound color flow imaging,” IEEE Transactions on Ultrasonics, Ferroelectrics and Frequency Control, vol. 49, no. 2, pp. 204–216, feb 2002.
[18] S. Salles, D. Garcia, B. Bou-Said, F. Savary, A. Serusclat, D. Vray, and H. Liebgott, “Plane wave transverse oscillation (PWTO): An ultra-fast transverse oscillation imaging mode performed in the fourier domain for 2d motion estimation of the carotid artery,” in 2014 IEEE 11th International Symposium on Biomedical Imaging (ISBI). IEEE, apr 2014.
[19] A. Basarab, P. Gueth, H. Liebgott, and P. Delachartre, “Phase-based block matching applied to motion estimation with unconventional beam-forming strategies,” IEEE Transactions on Ultrasonics, Ferroelectrics and Frequency Control, vol. 56, no. 5, pp. 945–957, may 2009.