HAL Id: hal-03008898
https://hal.archives-ouvertes.fr/hal-03008898
Submitted on 17 Nov 2020
HAL is a multi-disciplinary open access
archive for the deposit and dissemination of
sci-entific research documents, whether they are
pub-lished or not. The documents may come from
teaching and research institutions in France or
abroad, or from public or private research centers.
L’archive ouverte pluridisciplinaire HAL, est
destinée au dépôt et à la diffusion de documents
scientifiques de niveau recherche, publiés ou non,
émanant des établissements d’enseignement et de
recherche français ou étrangers, des laboratoires
publics ou privés.
luminescence in XLPE and modified XLPE
G. Teyssedre, Christian Laurent, Bo Qiao
To cite this version:
G. Teyssedre, Christian Laurent, Bo Qiao. Advanced characterization techniques based on
lumines-cence in XLPE and modified XLPE. Cross-linkable Polyethylene based blends and nanocomposites,
Springer, Chap 6, In press. �hal-03008898�
1
Advanced characterization techniques based on luminescence
in XLPE and modified XLPE
Gilbert Teyssèdre
(1*), Christian Laurent
(1**)and Bo Qiao
(2***)(1)
Laboratory on Plasma and Energy Conversion - Laplace,
University of Toulouse and CNRS, Toulouse (31062), France
(2)Key Laboratory of Luminescence and Optical Information, Ministry of Education
Institute of Optoelectronics Technology, Beijing Jiaotong University, Beijing (100044), P.R .China
*[email protected]
**[email protected]
***[email protected]
Abstract. Crosslinked Polyethylene finds application in the insulation of high voltage cables,
constituting a high demanding domain in terms of electrical performances. High quality XLPE grades
are now produced for insulation under high voltage direct current (HVDC) stress. Luminescence
techniques have constituted original techniques along the development of such materials,
particularly as regards the role of defects and residues in the behavior of materials in terms of
electrical charges stabilization. Luminescence provides a family of extremely sensitive techniques,
though limited to substances with unsaturated groups: in materials like XLPE only additives, residues
and defects are optically active. After recalling the grounds of luminescence principles in organic
materials, we explain the techniques implemented, mainly based on photoluminescence and on an
analysis of optical emissions related to charge traps into materials. The main results obtained with
the identification of the role of these 'defects' are presented before addressing the knowledge
brought by luminescence methods, including electroluminescence, on thermal and electrical ageing
aspects of polyethylene materials.
Keywords: XLPE, luminescence, crosslinking, cable insulation
This chapter is the final version as a contribution (Chap 6) to an upcoming book on Cross
linkable Polyethylene based blends and nanocomposites, Edited by Prof. Sabu Thomas and
2
Contents
I-Introduction
II-Luminescence from materials
II.1 Definitions
II.2 Absorption and emission phenomena
II.3 Luminescence from polymers
II-3-1-Photoluminescence
II-3-2-Luminescence due to charge recombination II-3-3-Other forms of luminescence
II-3-4-Correlation between luminescence and analytical techniques
III-Implementation of luminescence measurements
III.1 Materials
III.1.1-Standart XLPE
III.1.2-Models of XLPE compounds III.1.3-Grafted XLPE
III.2. Multipurpose luminescence set-up
III-2-1-Outlook of the characterization system III.2.2-Detection systems
III-2-3-Luminescence techniques according to excitation means
IV-Luminescence in XLPE and XLPE compounds
IV-1-Base line for luminescence properties: LDPE base resin vs. XLPE
IV-I-1-LDPE base resin
IV-I-2-XLPE and thermally-treated XLPE IV-I-3-Overall: LDPE vs. XLPE
IV-2-Model compound for interpretation of XLPE deep trapping sites
IV-2-1-Luminescence signature of model compounds: by-products of cross-linking reactions IV-2-2- Luminescence signature of XLPE model compounds with grafted species
IV-2-3- Luminescence signature of model compounds: anti-oxidant and its derivatives
IV-3-Investigating cable XLPE insulation with screen diffusing species
IV-3-1-Influence of storage duration of XLPE slices in the presence of SC
IV-3-2-Fluorescence and phosphorescence vs. cable radius in unaged and aged samples IV-3-3-Identification of photoluminescence contributions
V-Diagnosis, degradation and ageing processes
V-1-Electroluminescence from LDPE and XLPE
V-1-1-Rationale for EL measurements
V-1-2-Field regimes of light emission - AC vs DC EL V-1-3-Electroluminescence spectra
V-2-Cathodoluminescence as a prototype source for interpreting EL spectra
V-2-1-The CL spectra from polyolefins
V-2-2-The CL spectrum decomposition into different processes
V-3-Ageing diagnosis
V-3-1-EL yield of aged materials
V-3-2-PL from thermally degraded materials V-3-3-Contact sensitization
3
I-Introduction
Crosslinked Polyethylene (XLPE) is used for several decades now as insulation in high voltage buried or submarine power transmission cables, i.e. rated above 60 kV [1]. The major advantages of XLPE over the competitive technology based on traditional oil-impregnated paper insulation are lower dielectric losses, less complicated installation procedure and maintenance, and no risk of leakage implying improved respect for environment. The technical risks of XLPE-insulated high voltage cables could be a lack of knowledge of the degradation withstanding ability of the insulation. Today's hot topics are more related to the extension of its application to HVDC energy transport. Significant progresses have been achieved in adapting the material formulation to the new challenges brought by the form of stress to be supported. Space charge processes and conduction processes are two properties that had to be seriously addressed for ensuring the reliability of cables under high voltage direct current stresses. These issues have been addressed in a number of recent reviews and we won't go into more details here [2] [3].
Failure in transmission has always important consequences related to the time for energy outage and repairing costs. While some failures may arise from isolated events as natural disasters or human mistakes with digging for example, the repetition of middle term failure due to intrinsic weakness of the cable under continuous application of nominal stress is really a catastrophic aspect. In this perspective, the aim of the European project named ARTEMIS [4] was to investigate degradation processes and derive diagnostic properties for ageing evaluation and modelling of high voltage XLPE cables. The progresses in producing even safer cables have been achieved with ever improving extrusion processes in cables as well as cleanliness of rough materials used in HV cable production.
XLPE has therefore some high end niches in which high quality materials must be produced. Materials quality in the cable industry is naturally being assessed with electrical characterization as impedance spectroscopy, conductivity measurements, breakdown measurements, space charge measurements, etc in one hand, mechanical properties and thermal stability on the other hand. XLPE became at the top of cable insulation materials firstly because of its excellent thermomechanical properties [5]. The improvement of thermo-mechanical properties was achieved with compounding materials: peroxide crosslinking and protection against oxidation with introducing antioxidants is the way it is generally achieved. Because of this compounding, XLPE is a material containing, besides defects in the main chain, by-products, being volatile or not, and small amounts of residues. In turn, these moieties impart most of the differences in electrical properties compared to low density polyethylene for example. There has been a need for characterization techniques capable of making the link between chemicals on the one hand, and their impact on the behavior of electrical charges in the insulation, in the other hand. Indeed, depending on excitation means, different relaxation mechanisms can be at play such as the relaxation of optically excited groups, the recombination of charges of opposite polarity coexisting in the same region, or relaxation following hot carrier processes (impact excitation or ionisation). Luminescence techniques have appeared as original characterisation tools in this perspective, the reason why we have dedicated one chapter on its principles and results in this book. Depending on the excitation means, luminescence features may provide information related to chemicals, or to the interaction between electrical charges and groups acting as deep traps. These techniques can therefore be considered as at the frontier between physico-chemical and electrical characterisation tools.
Before going into the details, let's mention a few specificities of luminescence methods when applied to materials such as XLPE:
-Ideally, polyethylene does not contain unsaturations in its main chain, and then no luminescence should be detected in the uv-vis domain. Then, the response necessarily comes from additives, residues, defects, ageing by-products, etc being dispersed into the material. Both extrinsic (additives, crosslinking byproducts) and intrinsic (oxidised groups, insaturations) chromophores are potentially emitting groups in XLPE materials.
4 -Luminescence can be very sensitive in presence of optically active moieties. However, moieties can be
present without being luminescent. Therefore, it cannot pretend to cover all the possible defects; -In a solid material, many energy exchange phenomena can be at play, the response of a molecule can be
dependent on its environment and therefore identifying the luminescence bands is not as straightforward as it can be for infrared spectroscopy for example.
In the next section, we first present the general aspects of luminescence phenomena, particularly in the case of organic solids. In section 3, we present the kind of XLPE materials that have been considered in luminescence experiments, how it was processed, and we describe the methods that were implemented.
Then, the results are presented in two main sections related to luminescence from compounds and to ageing and degradation aspects viewed from the luminescence standpoint.
5
II-Luminescence from materials
II-1-Definitions
Luminescence is the light emitted by a substance when the excitation is not due to heat, by opposition to incandescence. The excited states responsible for material luminescence can be produce by different excitation sources [6], among them: photon absorption (photoluminescence PL) [7], chemical reactions (chemiluminescence CHL) [8], recombining charges (recombination induced luminescence RIL) [9] [10], electric field application (electroluminescence EL) [11] [12], electron beam irradiation (cathodoluminescence CL or electron-beam induced luminescence EBIL) [13] [14] [15], temperature (thermoluminescence TL) [16] [17] [18], etc. PL, CHL, RIL, EL, EBIL, TL refer to the source of excitation itself which can generate a series of elementary excitations contributing to the luminescence. As example, photon absorption can raise excited states of atoms/molecules but also can ionize them. The luminescence will result from relaxation of neutral excited states and from charge recombination in case of ionization. Another example is thermoluminescence where the thermal energy is used to detrap electrical charges, the luminescence deing due to subsequent charge recombination. The generic term used to name a form of luminescence does not imply a single elementary process. Common luminescence mechanisms typical in polymeric materials are given in Table 1.
Luminescence type Promotion of excited state
Photoluminescence PL Absorption of photon (mild UV) Chemiluminescence CHL Chemical reaction (typical: oxidation of polyolefins) Recombination induced luminescence
RIL
Recombination between trapped carriers (no kinetic energy)
Electroluminescence EL
Mixture of excitation processes induced by electric field Cathodoluminescence CL or
Electron beam induced luminescence EBIL
Hot electron impact and processes induced by irradiation Plasma-Induced Luminescence
PIL
Luminescence following excitation of the surface by a plasma discharge
Thermoluminescence TL
Luminescence in a temperature ramp following excitation of the surface by a ionizing radiation or
other way of depositing charges
Table 1. Overview of common luminescence types in insulating polymers
II.2 Absorption and emission phenomena in organic molecules
II-2-1-Absorption
The absorption of UV-VIS radiations in organic molecules is restricted to functionnal groups called chromophores that have valence electrons of weak energy. Under excitation conditions, electrons located on the orbitals (simple covalence bonds), (multiple covalence bonds) and n (lone electron pair) will be promoted to anti-bonding orbital (excited state) * or *. Transitions * and * have a strong energy, whereas transitions n * and n * have a weak energy. n electrons do not form bonds and they don’t have anti-bonding orbitals [19] [20]. The possible electronic transitions upon mild UV absorption are schematically represented in Figure 1.
6
a) * transitions
One electron located on simple covalent bond is excited to the corresponding anti-bonding orbital. The energy gap between the two states is strong. As example, methane which has only C-H bonds, can only stands * transitions corresponding to a maximum in absorption at 125 nm which cannot be observed in classical UV spectroscopy (200 nm to 300 nm).
b) n * transitions
Compounds containing atoms with lone electron pairs (oxygen, nitrogen) are able of such transitions of lower energy. They can be promoted by photons of wave length between 150 nm and 250 nm.
c) n * and * transitions
Optical spectroscopy of most organic compounds is based on the electronic transitions from n or state to the excited state *. The presence of unsaturated groups in the molecule is therefore needed to provide electrons. One can quote a strong transition * in the far UV for the molecules containing C=C groups. In contrast, n * transitions have a weak intensity but classical in carbonyls spectroscopy.
Figure 1. Possible electronic transitions in organic molecules in the UV-VIS spectrum
II-2-2-Emission
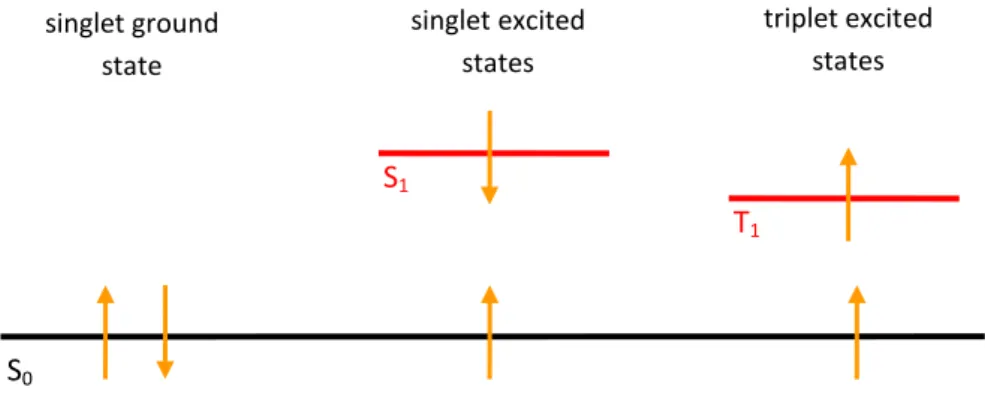
The electronic state of most organic molecules can be separated in singlet (S) and triplet states (T). Difference between these two types is based on spin coupling –see Figure 2. In singlet state, two electrons of the same energy state have a coupled spin (anti-parallel spin) whereas in triplet state, they have a parallel spin [19].
Figure 2. Spin coupling in ground and excited states defining singlet and triplet excitons
En
ergy
bonding anti-bonding * anti-bonding * bonding n * * n * * n non bondingS
0T
1S
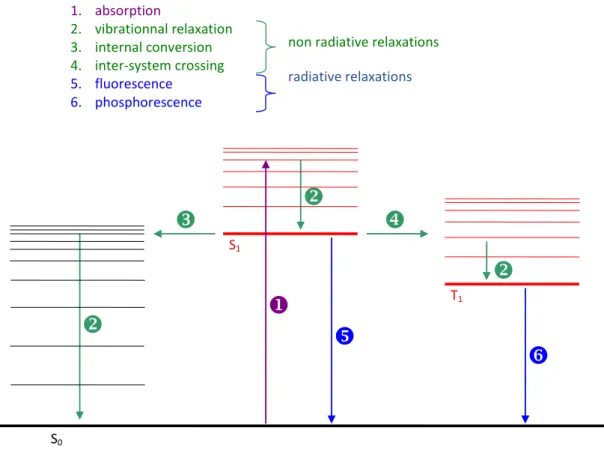
1 singlet ground state singlet excited states triplet excited states7 The energy conversion in a molecule can be approached with reference to the Jablonsky representation (Figure
3) [20].
d) Energy absorption (transition 1 in Figure 3)
The molecule absorbs some energy raising an electron from the ground state to an excited state with vibrationnal and rotationnal components.
e) Energy relaxation (transitions 2, 5 and 6 in Figure 3)
The molecule can relax following radiative and non radiative pathways.
In non radiative relaxation, the energy is dissipated by internal conversion (transitions 2) through collision with other atoms/molecules, or by intersystem crossing (transition 4). In the later, the electron spin is reversed and the molecule lies in a lower energy triplet state.
In radiative relaxation, the excited electron loses its energy going from the first excited state to the ground state. This can happen from the first excited singlet state (fluorescence) or from the first excited triplet state (phosphorescence). The life time of a triplet state is much longer (up to several s) than the one of a singlet state (order of ns) because it is a spin forbidden transition. Moreover, non radiative transfers compete with radiative relaxation from a triplet state in such a way that phosphorescence is usually observed only at low temperature which hinders inhibition by another atom/molecule.
Figure 3. Absorption, fluorescence and phosphorescence spectra of a small organic molecule and the corresponding energy state diagram with radiative and non radiative transitions in a Jablonsky representation.
T1 S1 S0
1. absorption 2. vibrationnal relaxation 3. internal conversion 4. inter-system crossing 5. fluorescence 6. phosphorescencenon radiative relaxations
8
II.3 Luminescence from polymers
The emission of light by a substance following an optical excitation is called photoluminescence which is a common spectroscopic technique in the field of materials even if its interpretation is not straightforword in the case of polymers [6]. Two kinds of polymers have to be distinguished depending on the chromophores they contain. In a first kind, the chromophores are not belonging to the monomer unit and can be bonded (unsaturation of the hydrocarbon chain) or not (impurities or residues of cross-linking in XLPE) to the macromolecular chain. In a second kind, chromophores are present in the monomer units (as in PET or PEN). This distinction is important as the interpretation of the emission spectra will not be as straightforward in the first type when compared to the second type.
Both emission and excitation spectra are usually recorded in photoluminescence spectroscopy. If the former is straightforward, the latter is less common: the frequency of the excitation light is varied, and the luminescence is monitored at the typical emission frequency of the material being studied.
II-3-1-Photoluminescence
In photoluminescence, the emitted light has a lower energy and therefore longer wavelength than the excitation light. The time between absorption and emission may vary from femtoseconds to milliseconds or even to minutes or hours under special circumstances. The relative short and relative long time between absorption and emission lead to fluorescence and phosphorescence respectively.
There is another peculiarity of polymer photoluminescence, which is due to the existence of interaction between neighbor molecules. The emitting species can be different from the excited ones, and excited states can be form upon the interaction of several atoms (excimers and exciplexes). Quenching processes are also of particular importance.
a) Fluorescence
Fluorescence occurs when an orbital electron of a molecule, atom or nanostructure releases back to its ground state keeping the same parity. The relaxation is fast (order on ns).
Excitation process: Light emission process:
Here, hv is photon energy with h (Planck’s constant) and v (frequency of the light). State is the ground state while state is its first excited singlet state.
b) Phosphorescence
Phosphorescence occurs when an orbital electron of a molecule, atom or nanostructure releases back to its ground state after spin reversal. The relaxation is much longer /fluorescence, order of ms to some s. Hence phosphorescent materials can “store” absorbed energy for a certain time.
Excitation process: Transition process: Light emission process: Here, hv, , , and heat mean the same as above, while is a triplet state.
During the phosphorescence process, the material is excited to higher energy states, then undergo an intersystem crossing into energy state of higher spin multiplicity, usually triplet states, , as seen in
9 Figure 3. The transition is normally a spin-forbidden transition, which is why the lifetime of triplet states (phosphorescence) is longer than that of singlet states (fluorescence).
c) Excimers and exciplexes
In the excited state, energy transfer between monomeric units of a single chain, or between units of different chains, give birth to specific excitation called excimers and exciplexes. In the former case, an excited state of a chromophore is coupled to a groud state of another identical chromophore. Experimentally, this gives birth to a broader emission band, without apparent structure, with a weaker energy than the single chromophore emission. Another form of complex is the exciplexe, which results from the coupling between an excited molecule and a different molecule in its ground state. These complexes can be at the origin of delayed fluorescence when two excited molecules are in a triplet state. In this case, a complex can be form between the two molecules M with subsequent relaxation to a singlet excited state and a ground state according to:
(1)
In certain circunstances, the fluorescence is delayed in time far beyond its natural life time.
d) Inhibition (quenching)
This is an important phenomenon where a species can interact with an excited state inhibiting thereby the luminescence. Quenchers are usually heavy atoms or paramagnetic molecules. A current process is the quenching of the luminescence of a molecule M by an oxygen molecule (triplet ground state), according to:
(2)
II-3-2-Luminescence due to charge recombination
The luminescence induced by charge recombination (RIL) is the light emitted by the material after its irradiation by an ionizing source (x-rays, -rays, electron beam, plasma source, etc.) [16] [18] [21] [22] [23] [24] [25] [26] [27]. The phenomenon of RIL is general and can be unraveled in most of the polymeric materials [10] [27]. During the irradiation, or a short time after (typically < 1 s), different mechanisms can contribute to the emission like direct excitation of the molecules without ionization, or immediate recombination between electrons (or anions) and holes (or cations). Recombination-induced luminescence dominates afterwards where the thermal fluctuations (isothermal luminescence) control the detrapping of charges and subsequent recombination with the recombining centers. Thermoluminescence is due to the same effect of charge detrapping and recombination due to the thermal energy provided to the polymer during heating.
In part IV of the present chapter, we will intensively use the emission spectra in charge recombination-induced luminescence to infer the nature of recombining centers in XLPE. The recombination regime is obtained in Plasma-Induced Luminescence, or PIL, where a polymer film is put in contact with a cold plasma [25]. Some details of the analysis are given below.
a) Charge recombination regime after contact with a cold plasma: isothermoluminescence
Here we illustrate the phenomenon by taking the example of luminescence analysis in XLPE films after contact with a cold plasma of helium at low pressure [7]. Further information on the techniques is given in section III-2-3. A typical example of the kinetic of the luminescence is shown in Figure 4 where the overall signal is fitted to three different luminescence components : a first one is due to the photoluminescence of the PE sample excited by the UV of the discharge, with time constant corresponding to the lifetime of triplet states; a second one is due to chemiluminescence –see paragraph II-3-3 [8], and a third one is due to charge recombination with a typical kinetic, giving a total light decay in time of the form:
10
(3)
where I is the luminescence amplitude, I0i are pre-exponential factors, t is the time elapsed from the end of the plasma treatment, α and m are adjustable coefficients and τi are time constants. The order of magnitude of α is 0.1 s-1 and m≈1. In the example shown in Figure 4 α is large; hence the last term is of the form I3.t-m.
Figure 4. Kinetic of isothermoluminescence of XLPE after contact with a cold plasma and its contributing phenomena. Adapted from [7]
The reciprocal time dependence of the light amplitude can be assigned to electron tunneling to positively charged luminescence centers [28] [29] [30] [31]. Such kinetic analysis allows to define a time window where recombination is the sole contribution and therefore to isolate the emission spectrum of the process.
b) Charge recombination regime after contact with a cold plasma: thermoluminescence
Figure 5 shows the Thermoluminescence (TL) curve recorded for crosslinked polyethylene after the end of an isothermoluminescence record while heating at a linear rate of about 5°C/min. The curve in blue was obtained after correction from the temperature dependence of the main emission derived from temperature dependent photoluminescence experiments [7]. Two transition regions appear at about –120°C and –60°C. It is tempting to associate these with the γ and β-relaxations of polyethylene which occur in the respective temperature regions according to dynamical mechanical analysis [32]. Overall, the luminescence is due to charge detrapping following recombination. The emission spectrum is the same as in isothermal RIL experiments.
II-3-3-Other forms of luminescence
a) Chemiluminescence
Chemiluminescence is the light emitted during a chemical reaction. It is a well-known phenomenon in polyolefins where oxidation reactions lead to the formation of C=O bonds. The light is generated during the last step of chemical reaction from C=O* to C=O with a typical signature at 415 nm [33]. Chemiluminescence has been deeply investigated in our group along thermal degradation of polyolefins, both through the kinetics of the integral emission and its spectrum that changes as a function of the reaction [25] [27] [33] [34] [35] [36] [37] [38]. 100 101 102 103 102 103 104 105 106 (3): Radiative charge recombination (2): Chemiluminescence (1): Photoluminescence (3) (1) L u m in e s c e n c e ( c p s ) Time (s) (2)
11 Figure 5. Thermoluminescence curve obtained after excitation of crosslinked polyethylene by a plasma
discharge. The luminescence is corrected from the temperature dependence of the main emission at about 450 nm in photoluminescence experiments [7].
b) Cathodoluminescence (or electron beam induced luminescence)
Cathodoluminescence is the light emission following excitation of the matter by an electron beam [39]. Exposure of a solid to an electron beam with several keV in energy induces a number of processes in the specimen, which lead to the formation of secondary and backscattered electrons, and generate also characteristic radiation and X-ray, and Auger electrons. The secondary electrons generate electron-holes pairs which can recombine directly or be trapped, and further released to excite the luminescence by recombination. It is noteworthy that the energy of excitation considerably exceeds the bandgap width of any material. The excitation of luminescent centers can occur not only via direct excitation, but also as a result of radiative and non-radiative transitions from higher lying energy states. As a consequence, CL spectra often demonstrate a larger amount of emission bands than other luminescence spectra.
c) Electroluminescence
Electroluminescence is the light emitted by a material put under electric stress. It is a well-known process in any media. It was firstly reported in 1963 [40] in organic semiconductors and exploited as organic light emitting devices. On the other hand, electroluminescence in insulating polymers was firstly reported in 1967 [41]. In these large band gap materials, the excitation mechanisms can be related to the kinetic energy of the charges, or their potential energy. In the former case, injected charges of a few electron-volts kinetic energy can impact excite some centers. In the later, recombining charges can be the source of the light. Mechanisms involved in EL of insulating materials are still under debate [42] and complex phenomena are involved as will be see in Section V.
II-3-4-Correlation between Luminescence and analytical techniques
As a general analytical method for polymers, luminescence spectroscopy suffers from the same problem as UV-visible absorption spectroscopy: the level of information obtained is coarse because of the close similarity in energy of the electronic transitions and their vibronic progressions, in which substituent effects are either absent or not resolved. The technique has been particularly powerful, however, in detecting trace amounts of oxidation products [43].
-150
-100
-50
0
0
5
10
15
Corrected TL Measured TL -28°C -65°C -130°C UV-induced Phosphorescence (a.u.)T
h
e
r
m
o
lu
m
in
e
sc
e
n
c
e
(
1
0
³
c
p
s)
Temperature (°C)
12 Different reasons make it not as a classical analytical method for characterizing solid polymers. First, luminescence techniques can be very sensitive on compounds having high yield, and can be relatively unsensitive for non-luminescent dyes. So it makes a first difference with other methods like Infrared Spectroscopy in which any molecule in principle provides absorption. Second, luminescence suffers from a lack of database of reference spectra for given chemical groups, mainly because the signature may depend on the environment of the molecule. It is therefore not easy to precisely identify chemical groups based only on their luminescence properties Thirdly, in solid state notably, it is extremely delicate to pretend being quantitative, because of the many deexcitation and transfer routes that can be followed by excited states.
Though luminescence in solids is not developed as an ordinary physico-chemical characterization technique, several works tentatively established correlations between luminescence, particularly chemiluminescence, and other analytical techniques [44]. Techniques as Electron Spin (or Paramagnetic) Resonance – ESR or EPR [45] or FTIR emission [46] are interesting as they provide signal linked to active groups during reactions. Rychly et al have published works in favour for decomposition of hydroperoxides as being responsible for the light emission during oxidation of Polypropylene [47]. However, the correlation is not necessarily straightforward. For example, Blakey and George [46] demonstrated through FTIR emission that the chemiluminescence intensity was proportional to the accumulation of carbonyl species formed during oxidation, rather than the rate of oxidation, which is predicted from classical chemiluminescence mechanisms associated with auto-oxidation. Kron et al correlated the amount of peroxide contained in polypropylene, as determined by iodometry, and the amount of light being detected under thermoluminescence curve in inert atmosphere. [48] A good correlation between ESR and CL as peroxyl radical detectors has been found under mechanical stress, though the level of information in the reaction is not the same [49].
All of these works are based on integral light and do not use the spectral distribution of the light for bringing understanding. For a qualitative comparaison of information brought by FTIR and photoluminescence, one may consider Figure 6 with phosphorescence spectra of benzophenone (a) [50] compared to that of XLPE grafted with a benzophenone derivative (b) [10]. Carbonyl derivatives have intense phosphorescence from their 3 (n
*) states. Phosphorescence spectra of most aromatic carbonyl compounds show a common feature as regards their vibrational structure. The vibronic structure observed in the spectra corresponds to relaxation to vibronic levels of the ground level. The vibronic structure of acetophenone phosphorescence emission was perfectly resolved at 4 K, and the strongest bands have been identified as harmonics of the ν (C=O) Raman band at 1684 cm−1 [51]. At 100 K, the energy difference between structured peaks is less due to overlapping of several vibronic states [7]. Because of this broadening introduced by vibrational levels, broad bands are obtained and identification of emitting groups is not direct.
Figure 6. Phosphorescence spectra of benzophenone (a) in ethanol [50] and of XLPE grafted with benzophenone protonoxy (b). [10]. The averaged vibronic structure is of 1590cm-1 in (a) and 1530 cm-1 in (b).
18000 20000 22000 24000 26000 0.0 0.5 1.0 1590cm-1 (0.20eV) In te n si ty ( a .u .) Wavenumber (cm-1) 18000 20000 22000 24000 26000 1530cm-1 (0.19eV) (b) (a) 600 550 500 450 400 Wavelength (nm) 600 550 500 450 400
13 Besides, luminescence may have extraordinary and unique features as with electroluminescence, which as we shall see in the following, provides signatures of degradation products being formed, in quantities that are not detectable with other methods specially when it is mixed with a great number of other chemicals in low concentration. In (electrical) ageing we must admit that there are no detectable new chemicals being formed (cf. ARTEMIS project [4]), due to field application whereas EL could be detected. We also showed that chemicals being quinoline derivatives, that have been proved to diffuse from semiconducting screens in Medium Voltage cables, were not detected by any other analytical method applied in the same project on the same samples.
III-Implementation of luminescence measurements
III.1 Materials
As state above, hydrocarbons made of aliphatic bonds do not emit light in the visible domain. For being emissive, unsaturation must be present. A first family of defects is those existing in low density polyethylene as depicted in Figure 7. Jacques and Poller [52] investigated model compounds of these defects by photoluminescence and this study guided the interpretation of fluorescence from LDPE.
Figure 7. Six typical chromophore structures that may occur in the carbon chain of Polyethylene: carbonyl, dienone, hydroxyl, double bond, conjugated double bond and vinyl. Taken from [53]
A second set of defects is that provided by additives (antioxidant) and residues due to the crosslinking process. Examples are given in Figure 8 in the case of dicumyl peroxide chemically cross-linked PE. Compared to in-chain defects presented above, residues do not have chemical bonds to the PE chains and can therefore migrate and be expelled from the polymer. Therefore, particular care has to be taken about sample handling and storage as the amount of by-products evolves in time. In some cases, outgasing of the sample at 60°C is achieved to force by-products expelling and probe a 'dried' material. We will show that there can be traces of by-product detected in the luminescence response.
Anti-oxidant
α-methylstyrene
Acetophenone
Cumylalcohol
Figure 8. Chemical structure of possible additives and residues of DCP-chemically cross-linked PE [54] S C(CH3) 3 OH C(CH3) 3 CH3 CH3 OH C CH3 CH 2 C CH3 O C OH CH3 CH3
14
III-1-1-Standard XLPE
All of the luminescence methods applied to polymers can be applied to materials in film form. An advantage of film in respect to powder or pellets is that the excitation and the amount of probed material are well controlled. Results presented herein were obtained on two kinds of samples.
1) Pressmolding and peroxide crosslinking in a single run. Like for cable poduction, pellets containing expected amounts of peroxide and of antioxidants, of the order of 1 wt.% each, are first molded under pressure at temperature slightly above the melting point, then the temperature is increased to 190°C to perform the crosslinking. The sample is then progressively cooled down to room temperature. Caution along this process is with molding material: to make unmolding easy, polymer films are layed onto the mold. However, it was shown that when using PET as protecting film, specific luminescence signatures could be produced. The second caution is about the release of by products: to control this amount, the cooling and the environment of samples should be kept the same. The sample thickness of typically 100 µm is a good balance. Making thiner films with repeatable and homogenous thickness can be problematic. Making thicker films means higher voltage needs to be applied when carrying out recombination-induced luminescence or electroluminescence experiments.
2) The second way of making films is by peeling from high voltage cables. Provided high quality knife can be used, films of good surface quality can be produced. In the frame of the Artemis project performed on aged cables, such peelings were produced within the 15 mm thick insulation: continuous rolls of 8 cm width, about 15 m in length and 150 µm in thickness were analyzed with different electrical and non-electrical method, including luminescence [4]. An advantage was that the rolls reflected the position of samples along the cable radius. Also, compared to press-molded samples, peeled samples tend to retain better the by-products. An important result was obtained in this study of photoluminescence spectra versus position along the radius of the cable. It concerns the diffusion of antioxidant from the semiconducting screens of the cable into the insulation. This was reported in a pair of papers and further commented later on [55] [56].
III-1-2-Models of XLPE compounds
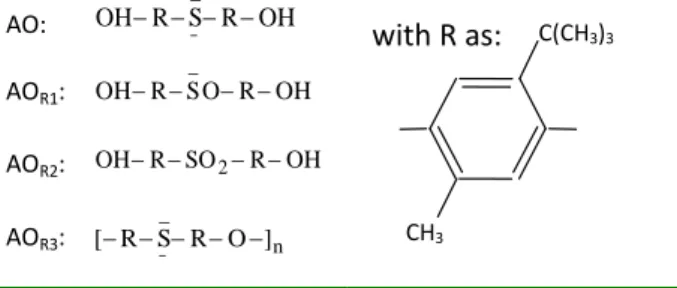
On the one hand, XLPE is a rich material in term of residues compared to thermoplastic materials. On the other hand, there is a lack of tabulated data on spectral features of potential chemicals involved in luminescence. To isolate these signatures, selected compounds were incorporated into LDPE. It concerns the main crosslinking by-products, acetophenone, cumyl alcohol and alpha-methylstyrene, an antioxidant, (4, 4'-thiobis (2-terbutyl-5-methylphenol), AO-), and some of its known derivatives once it has reacted with oxygen [57] [58] as presented in Table 2. The results about this study will be commented in section IV. The way samples were realized is by mixing 0.1 wt.% of the products with LDPE and pressmolding the pellets at 130°C [57].
AO: OH R S R OH _ ¯ AOR1: OH R SO R OH _ AOR2: OHRSO2ROH AOR3: n _ ¯ ] O R S R [
Table 2. Chemical formula of the antioxidant 4, 4’-thiobis (2-terbutyl-5-methylphenol) and its reaction products.
CH3
C(CH3)3
15
III-1-3-Grafted XLPE
The last set of samples investigated was XLPE with grafted groups on it [10]. The project participated in the general objective to develop anti-treeing compounds, often called voltage arresters, for XLPE insulation. These aromatic groups, styrene and benzophenone derivative notably, cf. Figure 9 are supposed to easily catch the energy provided by hot carriers and prevent material ionization. The modification process is patented [52]. We shall see that groups can be strongly luminescent.
grafted benzophenone crotonoxy grafted styrene Figure 9. Chemical structures of grafted groups on XLPE [10]
III-2-Multipurpose luminescence set-up
The available luminescence commercial systems are mainly for PL detection, which can not meet the requirement of luminescence measurement of insulating polymers. In addition, commercial apparatuses tend to be dedicated to probe liquid solutions more than solid and they often don not apply to large samples. Collectiong light from a large surface can be a solution when working with low intensity luminescence signal. For all of these reasons, we have developed a multi-purpose chamber for light detection.
III-2-1-Outlook of the characterization system
The chamber that has been developped is depicted in Figure 10. A specificity of the installed system is to detect faint light intensity and to be efficient, for photoluminescene excitation, in the UV region (from 220 nm and on) when commercial spectrofluorimeters operate beyond 280 nm. The system contains five main elements:
(1) excitation source system (electric field, electron beams, photons, and plasma); (2) optical detecting system (PM system and CCD camera system);
(3) optical path controlling system; (4) temperature controlling system; (5) pumping system.
The excitation source system and the testing system are two core parts for luminescence measurements, while the other systems are auxiliary components. The testing system also contains three parts according to the optical axes:
-Optical axis N°1 for photoluminescence excitation;
-Optical axis N°2 with a cooled photomultiplier (PM) working in photon counting mode for integral light detection;
-Optical axis N°3 for a grating dispersive system (4.5 nm in resolution) coupled to a liquid nitrogen cooled charge coupled device (CCD) camera for spectral analyses which covers the wavelength range from 230 nm to 840 nm. CH2 CH2 CH2 R C O O C CH2 CH C H2 O CH2 C H2 R CH3
16 Figure 10. Experimental setup used for multi-purpose luminescence detection.
The mechanical environment is a light proof dark chamber connected to a turbo-molecular double pumps system to achieve high vacuum, up to 10-7 mbar. High vacuum is used in electroluminescence measurements in order to avoid gaseous discharges during measurements. Samples can be placed on the holder which contact to a heating resistor, a reservoir than can receive liquid nitrogen or a thermostated liquid, and a temperature sensor, to control the temperatures from liquid nitrogen temperature up to ≈150°C (in atmosphere only). The multi-purpose chamber is designed to accommodate different kinds of luminescence excitation as described below. Some key parts of the set-up will be introduced below.
III-2-2-Detection systems
The photomultiplier (PM), type of Hamamatsu R943-02, is used to count photons emitted by the material. It allows recording resolved luminescence in time. It operates at a controlled temperature of -30 °C by a Peltier cooling system. This temperature has the effect of reducing the thermal emission of electrons from the photocathode, which implies extremely low noise (a few counts per second). The spectral response of the photocathode of the photomultiplier is from 210 to 900 nm; it is relatively flat in the wavelength range from 300 to 900 nm.
The signal transmitted by the PM is pre-amplified and then passes through a set of amplifier/discriminator and is finally transferred to a computer via a card of "fast" acquisition pulse counter from ORTEC. The integration time (dwell time) is variable from micro-seconds to several minutes. We use the PM signal recording for lifetime estimation in photoluminescence, or integral light variation as a fonction of time or stress for example for field threshold estimation in electroluminescence.
The CCD camera (Charge Coupled Device) from Princeton Instruments (LN /CCD-1100-PB) works at a controlled temperature of -110 °C. This camera is associated with an imaging spectrograph (type: Jobin-Yvon CP200) which ranges at 200 lines/mm. It covers a spectral range between 190 nm and 820 nm. The sensitive part of the camera has a resolution of 1100 × 330 pixels, each covering on area of 24 × 24 µm², summing information over the 330 rows. The spectral resolution is 4.5 nanometers. The CCD camera works either in spectral detection mode or in imaging mode. The output of the dispersive system extends over the length of the detector at 1100 pixels, i.e. a point per 0.573 nm. The spectrometer is calibrated periodically using known emission lines of a Xenon lamp.
All the optical coupling is achieved using quartz lenses and mirrors. Band pass filters, 2.5" in diameter can be interposed along Axis 2 for realizing light detection in given wavelength range. Also, such filters can be put
17 along axis 3: it was used for example to make imaging of the EL emission from the surface of samples with filtering in selected wavelength ranges [60].
III-2-3-Luminescence techniques according to excitation means
a) Optical excitation: Photoluminescence
During photoluminescence (PL) measurement, the samples mounted into the chamber were excited by a Xenon source coupled to an irradiation monochromator. The excitation beam is with and angle of 40° in respect to the vertical axis. In this way, the specular reflexion from the excitation beam does not enter the light collecting system. The Xenon lamp has a power of 150 W from Jobin-Yvon. It is coupled to an excitation monochromator (double pass monochromator HD10UV from Jobin-Yvon with 1200 lines/mm grating). The excitation wavelength varies form 220 nm to 700 nm and is set manually. The bandwidth of the irradiation window can be adjusted from 0.2 nm to 4 nm using slits. Coupling between the sample, the excitation source, and CCD camera, was achieved by optical path through the quartz lenses window of the chamber. PL measurements are performed at ≈-130°C especially for phosphorescence and at room temperature especially for fluorescence. Prior to testing samples in photoluminescence measurements at low temperature, the chamber is evacuated and filled in with helium at atmospheric pressure. The phosphorescence spectra can be isolated by synchronizing the light excitation switch off of the shutter placed in front of the irradiation source and the exposure to the CCD camera. In this way, fluorescence, which has a very short lifetime, and the excitation beam are not present in the obtained spectra.
There is a high pass filter at 300 nm in front of the CCD camera in order to cutoff the excitation light of wavelength shorter than 300 nm, which is particularly useful for samples as XLPE where most of the excitation wavelengths are in the range 220-300 nm. The emission spectrum is integrated under different times by the CCD camera; typically 10-20 s integration proves enough to have a good resolution when realizing photoluminescence spectra.
Phosphorescence lifetimes can be estimated using the photomultiplier, by synchronizing excitation shutter switch off and start of pass trigger in the counting board of the PM. Lifetimes down to microseconds can be detected in this way.
b) Electric field excitation: Electroluminescence
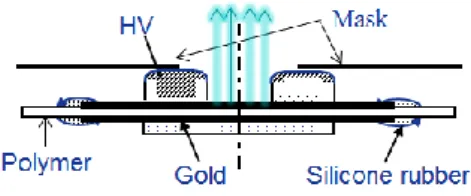
During electroluminescence (EL) measurement, the sample arranged as seen in Figure 11 was installed in the chamber and put under high vacuum. Samples are provided with semitransparent electrodes of gold, 30nm in thickness or of ITO (Indium Tin oxide). The electrode diameter is typically 50 mm. The two electrodes HV ring electrode (inner diameter 30 mm) and ground flat electrode (diameter 40 mm) are connected to the high voltage and ground respectively. The ring electrode allows the light emission analyses from the center of the sample.
Figure 11. Configuration of EL measurement
Most of the measurements are carried out under secondary vacuum to avoid discharges in the environment of the sample and characterize luminescence only from the solid. Light detection is carried out by two systems -PM and CCD as explained above. The integration time with the CCD for EL spectra acquisition is usually longer than for PL, of several minutes, due to a much lower light intensity compared to PL.
18 Direct current (DC) or alternating current (AC) stresses are applied to the dielectric in film form. The DC stress is applied using 35 kV power supply from Fug, Germany. DC current is measured simultaneously using a Keithley 617 programmable electrometer. The AC power supply consists of a high voltage amplifier (x2000, up to 20 kV voltage amplifier from Trek, USA) controlled by a function generator. The phase of AC voltage can be synchronized with the counting board of the PM for achieving the phase-resolved EL of the materials.
c) Electron beam excitation: Cathodoluminescence
During cathodoluminescence (CL) measurement, we use a home-designed electron beam gun mounted into the chamber, cf. Figure 10, providing electrons of up to 10 keV in energy. The filament is at high voltage and the anode at the ground. The distance between the electron gun and the sample on the holder is about 40 mm. The axis of the gun is at 50o to the normal of the sample plane rendering possible light detection along the normal to the samples. The beam current is about 0.5 µA. Experiment were also carried out under a vacuum better than 10-6 mbar, at ambient temperature. Emission spectra and light intensity were recorded for different electron beam energies and for different radiation time with the same beam energy.
d) Plasma silent discharge for recombination-induced luminescence
In order to charge the surface of the sample we produce a silent discharge obtained between two plane parallel electrodes, Figure 12. The sample is deposited on the lower one and the upper one is made of quartz in such a way that the discharge is initiated between the two dielectrics. The plasma gap of 5 mm is powered at a frequency of 5.5 kHz under a voltage of about 1.5 kV rms.
Figure 12. Configuration for recombination induced luminescence measurement
The sample is contacted with a reservoir in which liquid nitrogen circulates: experiments are achieved at low temperature to increase luminescene yield. The discharge is produced in helium at atmospheric pressure. Before introducing the helium, the chamber is pumped down to 10-5 Pa. An electronic circuit controls the interaction time of the plasma with the surface. It adjusts the delay between the end of plasma generation and the beginning of measurement. In this way, the luminescence of the polymer surface can be analyzed in situ through the upper transparent electrode. For our purpose, we deal with short plasma interaction times ( 5 s) for which it has been shown that the surface modification is mild. The relaxation of the surface is quite slow and the luminescence can be detected during more than 30 min after plasma interaction at low temperature and for about 5 min at room temperature. As shown previously, photon counting is achieved with the photomultiplier and spectra are acquired with the CCD in different time intervals after the discharge switch off. Thermoluminescence can be achieved while heating up the sample after isothermal light decay measurements.
Helium ITO electrode
Quartz Polymer
19
IV-Luminescence in XLPE and XLPE compounds
As previously underlined, chemically cross-linked -XL (vs. irradiation cross-linked) PE is a complex material. Based on linkable LDPE (a special PE in which the number of C=C is controlled for providing sites for cross-linking) it has all the complexity of the base LDPE (unsaturations, oxidized species, etc. belonging to the chain and anti-oxidant agent as additive to protect the base material from oxidation, plus other additives likely) plus the ones due to the cross-linking process itself, i.e. it contains by-products of cross-linking agent which can be formed as isolated molecules (i.e. non bonded to the main chain) or be strongly bonded to the chain. In addition, by-products of the anti-oxidant are found as species bonded or not bonded to the macromolecular network. All these chemical species can potentially trap electrical charges and therefore are potential candidates as recombination centers for carriers of opposite polarity. Investigation on the luminescence properties of different formulations gives information about the active trapping sites.
IV-1-Base line for luminescence properties: LDPE base resin vs. XLPE
IV-1-1-LDPE base resin
Figure 13 shows the luminescence features resulting from PL and RIL experiments on LDPE base resin. A
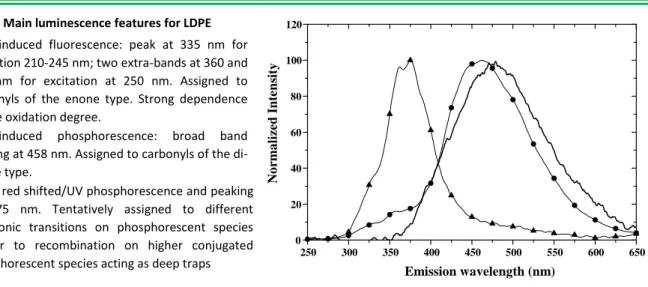
commercial peroxide cross-linkable LDPE base resin was used. As it constitutes the baseline for the overall study and to improve the control on its purity, LDPE powder has been treated in a solution of ethanol before being processed under film form. The objective was to remove extractable impurities due to pollution from the ambient. No antioxidant was used during the molding procedure so as to get the simplest possible reference. The thickness of the film was 150 µm. The fluorescence of the reference LDPE sample peaks at 335 nm for short excitation wavelengths (210–245 nm). For longer excitation wavelengths, two bands at 360 nm and 378 nm appear as shown in the emission spectrum in Figure 13. These bands are best resolved for an excitation wavelength of 250 nm. At low temperature, a strong phosphorescence emission exceeding the fluorescence yield is detected. The spectrum is broad, structureless, with a maximum peaking at around 458 nm. Note that the fluorescence band is visible at low temperature as a wing in the short wavelength domain. The spectral shape and band positions are consistent with data in the literature [6] [61].Polyolefins usually fluoresce at about 330–340 nm. With increasing oxidation degree, extra bands in the region 360–380 nm have been reported [61], see Figure 14. As the reference material was antioxidant-free, it is not unexpected that oxidation took place in the specific sample under study.
Main luminescence features for LDPE
UV-induced fluorescence: peak at 335 nm for excitation 210-245 nm; two extra-bands at 360 and 378 nm for excitation at 250 nm. Assigned to carbonyls of the enone type. Strong dependence on the oxidation degree.
UV-induced phosphorescence: broad band peaking at 458 nm. Assigned to carbonyls of the di-enone type.
RIL: red shifted/UV phosphorescence and peaking at 475 nm. Tentatively assigned to different electronic transitions on phosphorescent species and/or to recombination on higher conjugated phosphorescent species acting as deep traps
Figure 13. Luminescence features in LDPE base resin tested in film form. Photoluminescence: (▲) at RT; (): at low temperature. λexc = 250 nm. RIL spectrum (──) [54]
250 300 350 400 450 500 550 600 650 0 20 40 60 80 100 120 No rma lized I nte n sit y Emission wavelength (nm)
20 Figure 14. Fluorescence from LDPE: Reference vs. oxidized, with an excitation wavelength of 258 nm.
Adapted from [61].
Phosphorescence at around 450 nm is also a classical feature for such material. So, following data from the literature, the luminescence of LDPE base resin is related to the presence of carbonyls and unsaturated carbonyls of the enone type in the case of fluorescence [62] [52] and of the dienone type for phosphorescence [6] [62], which structure is given below :
(a) (b)
The RIL spectrum is clearly in the phosphorescence domain. It is shifted towards long wavelengths relatively to the UV-induced phosphorescence spectrum and the maximum intensity is found at around 475 nm. This shift may have two origins: either it corresponds to the involvement of different chromophores, such as longer polyenone sequences, or it results from the excitation of different energy levels of the same chromophore. Carbonyl compounds exhibit both (n, π ) and (π, π ) states, and as (n, π ) states are the lowest lying triplets in enone compounds they would be preferentially involved upon charge recombination [9]. Note that they have the lowest ionization potential of the molecule.
IV-1-2-XLPE and thermally-treated XLPE
Two high voltage cables insulated by XLPE were produced specially for the Artemis project
[4
]. The insulation thickness was 14 mm. Samples cut from the insulation of these cables are referenced A and B. Another cable with 27 mm-thick XLPE insulation has been introduced in the project for validating the present approach, since it was available in both the unaged and aged forms. Samples from this reference cable are labelled C.a) Sample handling
Measurements were performed on rolls cut from the cables, having width 80 mm and mean thickness 150 μm [55]. In order to minimise effects of diffusion of low molecular weight species from the screen, samples corresponding to the region 2 to 4 mm from the inner screen of the cable were analysed. More details on the effect of sample handling and cutting procedures on the measurements are given elsewhere
[4
]. A further problem that was considered is the preconditioning of the specimens before any measurement, in order to have reproducible results. It is clear that not all cross-linking by-products will exit the cable during ageing and thus could contribute to degradation processes. On the other hand, it is necessary to prepare samples whose320 360 400 440 0 50 100 372nm 356nm 330nm N o rm a li z e d I n te n s it y Wavelength (nm) exc: 258nm Ref-LDPE Ox-LDPE 320nm R CH CH C O R’ R CH CH C O R’ CH CH R CH CH C O R’ CH CH
21 properties change little with storage time. Therefore, a preconditioning procedure in which the samples were placed in an oven for 48 h at 50◦C in order to expel crosslinking by-products has been adopted. No by-products were detected after such treatment using either HPLC (High Performance Liquid Chromatography) or FTIR (Infrared Spectroscopy)
[4
]. As the luminescence features of these byproducts are of interest, we have compared results obtained on specimens before and after preconditioning.b) Fluorescence
Figure 15.a shows the principal features of the emission spectra obtained from preconditioned samples. Figure 15.b shows the corresponding excitation spectra monitored at the peak wavelength of the components
identified in the emission spectra, for preconditioned and non preconditioned samples. The fluorescence excitation spectra –i.e. the emitted light intensity monitored at a given emission wavelength while scanning the excitation wavelength – have been corrected for the wavelength dependence of the excitation power. However, the region 220–230 nm is probably overestimated. Therefore, these spectra should be considered only for comparison of the relative emission yield of the different materials. The effect of preconditioning is shown on the excitation spectra for cable A, which is known as the material containing the highest content of volatile species, due to extrusion conditions. At least 3 emission bands have been identified:
(a) Normalized emission spectra for different excitation wavelengths
(b) Excitation spectra monitored at different emission wavelengths
Figure 15. Photoluminescence at 20°C from XLPE samples peeled from different cables (A, B, C) from Artemis project. P = preconditioned (thermally treated); NP = not preconditioned. Adapted from [7].
-an emission at 340 nm, which is best resolved when exciting at short wavelength (230 nm, see Figure
15.a. The relative intensity of this band is weaker in samples B and C which contain less volatile species.
Therefore, it might be characteristic of volatile groups. However, we did not detect any clear effect of preconditioning on the strength of the band.
300 400 500 600 0 50 100 C Wavelength (nm) 0 50 100 B 0 50 100 N o rm a li ze d I n te n si ty
Figure 1. Teyssedre & al.
exc : 230nm 250nm 275nm A 0 20 40 220 240 260 280 300 0 100 200 340nm 370nm 428nm A (NP) In te n si ty ( cp s) 0 50 100 340nm 370nm 428nm A (P) 340nm 370nm 428nm B (P) In te n si ty ( cp s) 220 240 260 280 300 0 100 200
Figure 2. Teyssedre & al.
340nm 370nm 428nm
C (P)
22 -an emission in the range 360–375 nm, with excitation band at about 280–290 nm. Preconditioning strengthens this band. As emissions peaking at 340 and 360–375 nm are close-lying and relatively broad, the related excitation spectra cannot be easily distinguished. In sample C, a component at around 380 nm appears distinctly (see Figure 15.a). It is also detected as a shoulder for the other two cables, especially for the spectrum under excitation at 250 nm. Considering the excitation spectra, this component corresponds to a peak at 250 nm in the excitation spectrum of sample C which is not seen for the other samples. The growing of this band is possibly in relation to the fact that cable C was stored for a long time after cable production.
-an emission at around 425 nm with excitation peak at 275 nm. The fluorescence of low density polyethylene is comparatively simpler (see Figure 13). Hence, this emission is clearly a characteristic of crosslinked polyethylenes. It seems not to be related to volatile species since preconditioning enhances it. In case of XLPE, the emission is strengthened by a factor of about 3 after preconditioning. We observed that it still increased in a sample previously treated at 50◦C for 2 days and kept at this temperature for one extra day. One would expect a decrease of the emission rather than an increase since volatile products, which are candidate as emitters, are removed at higher temperature. However, the increase of the emission does not necessarily mean that more emitting species are produced. It could result from removal of either strongly absorbing species which do not emit and/or from efficient quenching (energy transfer) of the excitation of the emitting groups by non-emitting species. In the first situation, one would expect a different UV-vis transmission spectrum after thermal treatment. In the second case, the change of shape of the excitation spectrum would be indicative of different quenching efficiency and/or difference in the volatility of emitting species. In any case fluorescence measurements can be indicative of the quantity of remaining by-products.
c) Phosphorescence
The emission spectra obtained at -130 °C are shown in Figure 16. Results for as-received and preconditioned samples A are compared. These spectra are representative of what was obtained on the other materials. The excitation spectra (not shown) exhibit two maxima, at about 240–250 nm and 280 nm for all the samples. They differ markedly from the excitation spectrum of fluorescence, which means that phosphorescing species are different from fluorescing species. A strongly structured emission, significantly dependent on the excitation wavelength, was obtained for the as-received material. This structure is best resolved when exciting at 240 nm. Several maxima are found at 388, 415, 443, 476, and 515 nm.
Figure 16. Phosphorescence spectra obtained at low temperature on as-received (NP) and preconditioned (P) sample A. The spectra during the decay were obtained with an integration time of 1 s. CW=continuous wave
excitation. Adapted from [7].
350 400 450 500 550 600
0 50 100
Figure 3. Teyssedre & al.
N o rm a li ze d I n te n si ty Wavelength (nm) 400 450 500 550 600 A (P) A (NP) CW, 240nm CW, 280nm Decay
23 These results show that at least two kinds of species contribute to the phosphorescence emission. They have distinct excitation spectra with maxima estimated at around 240 nm and 280 nm. As for fluorescence (see
Figure 15.b), preconditioning of sample A increased the emission by a factor ≈2. After preconditioning, the
spectrum did not evolve greatly when changing the excitation wavelength. Upon excitation at 240 nm, the structure described above was also detected. The spectrum obtained along the phosphorescence decay is also represented on Figure 16. Our present understanding of these phosphorescence spectra is that at least two kinds of species contribute to the emission: acetophenone and an unspecified one. There is no doubt that the structured emission is related to acetophenone. The position in wavelength of the bands is in good agreement with the literature data as will be seen later.
d) RIL spectra
Figure 17 compares the RIL spectra obtained for the different materials that have been tested. Except for
preconditioned sample A, the spectra for the different materials are approximately the same. Structures can be distinguished at about 420, 450, and 475 nm. Though these spectra are broader than those presented in Figure
16, they exhibit the same components.
Figure 17. RIL spectra of the different materials tested. NP and P stand for not preconditioned and preconditioned, respectively. Adapted from [7].
e) Luminescence spectra obtained on other kinds of XLPE samples
The results presented above have been obtained on slices taken from the insulation of power cables. Here we report on results on thin films, either after a thermal treatment, or cross-linked from different base resins. The signature at 428 nm in fluorescence emission is confirmed. Being not due to volatiles species, it should be in relation with strongly bonded species.
There is superposition of the UV phosphorescence and RIL spectra, as previously reported. The centers responsible for deep trapping in XLPE are not those identified in LDPE and they are strongly bonded to the hydrocarbon chain.
300 350 400 450 500 550 600 650
0 50 100
Figure 9. Teyssedre & al.
A (NP) B (NP) A (P) B (P) C (P) N o r m a li z e d I n te n si ty Wavelength (nm)
24 Main features for luminescence in XLPE
Main fluorescence peak at 350-370 nm and main phosphorescence peak at 450 nm
Confirmation of the component at 428 nm in fluorescence
Confirmation of the superposition of UV phosphorescence and RIL spectra
Figure 18. Luminescence spectra from XLPE under film form (by-products expelled). Photoluminescence: (▲) at RT; (): at low temperature. λexc=270 nm. RIL spectrum (──) [54].
Main features for the impact of LDPE resin
No visible impact of the nature of the LDPE resin (different melt flow rates) on the final response.
Confirmation of the identical features for UV-phosphorescence and RIL
Confirmation of the superposition of UV phosphorescence and RIL spectra
Figure 19. Luminescence features of XLPE (solid line) and XLPE' (dashed line) at low temperature (-110°C). (a) normalized phosphorescence spectra for excitation at 250 nm; (b) normalized RIL spectra. From [58].
IV-1-3-Overall: LDPE vs. XLPE
On the way of understanding XLPE intrinsic recombining centers, we have compared LDPE and XLPE photoluminescence/RIL spectra. If the origin of the LDPE luminescence properties is relatively well understood, this is contrary to the case of XLPE which exhibits specific properties. If the importance of by-products of the cross-linking reactions is well described as revealed by differences between spectra of treated and non treated films, the UV-photoluminescence and the RIL spectra on treated films are identical but specific to the XLPE. This demonstrates the recombining centers are strongly bonded to the hydrocarbon chains. Their origin cannot be linked with differences in the cross-linkable base resin as the spectra obtained on two XLPE with different base resins are identical. Identification of their origin needs model materials to be synthetized and tested. This is the object of the following paragraph.
250 300 350 400 450 500 550 600 650 0 20 40 60 80 100 120 No rma lized I nte n sit y Inte ns it y Emission wavelength (nm) 300 400 500 600 0.0 0.5 1.0 (a) Wavelength (nm) N o r m a li z e d I n te n si ty 400 500 600 0.5 1.0 XLPE XLPE' (b)

![Figure 6. Phosphorescence spectra of benzophenone (a) in ethanol [50] and of XLPE grafted with benzophenone protonoxy (b)](https://thumb-eu.123doks.com/thumbv2/123doknet/14374364.504862/13.892.237.645.778.1102/figure-phosphorescence-spectra-benzophenone-ethanol-grafted-benzophenone-protonoxy.webp)
![Figure 8. Chemical structure of possible additives and residues of DCP-chemically cross-linked PE [54]](https://thumb-eu.123doks.com/thumbv2/123doknet/14374364.504862/14.892.247.647.926.1117/figure-chemical-structure-possible-additives-residues-chemically-linked.webp)