WORKING
PAPERS
SES
N. 520
X.2020
Faculté des sciences économiques et sociales et du managementWirtschafts- und sozialwissenschaftliche Fakultät
Chasing dividends during the
COVID-19 pandemic
Nicolas Eugster,
Romain Ducret,
Dušan Isakov,
and
Jean-Philippe Weisskopf
Chasing dividends during the COVID-19 pandemic
Nicolas Eugstera, Romain Ducretb, Dušan Isakovc & Jean-Philippe Weisskopfd
This version: September 24, 2020
Abstract
This paper investigates the impact of the COVID-19 pandemic on the trading behavior of investors around ex-dividend dates in Europe. The sudden decrease in the number of companies paying dividends reduced the opportunities to capture dividends. The firms that have maintained dividend payments during the pandemic thus attracted more interest than before. This led to a doubling in the magnitude of stock return patterns usually observed around ex-dividend days. Our evidence indicates that ex-dividend-seeking investors are likely to be the main driver of the price patterns observed around ex-dividend dates.
JEL: G12; G14; G35
Keywords: COVID-19; dividend capture; price pressure; ex-dividend date; event study
a Corresponding author: University of Queensland, University of Queensland Business School, St Lucia, Brisbane
4072, Australia. Email: [email protected]
b University of Fribourg, Faculty of Management, Economics and Social Sciences, Boulevard de Pérolles 90, 1700
Fribourg, Switzerland. Email: [email protected]
c University of Fribourg, Faculty of Management, Economics and Social Sciences, Boulevard de Pérolles 90, 1700
Fribourg, Switzerland. Email: [email protected]
d Ecole hôtelière de Lausanne, HES-SO Haute école spécialisée de Suisse Occidentale, Route de Cojonnex 18,
- 1 -
Chasing dividends during the COVID-19 pandemic
1 Introduction
The COVID-19 pandemic has deeply impacted businesses worldwide. Due to the large drop in consumption following widespread lockdowns, many companies have seen their revenues and profits decline, and their financial position deteriorate. In order to mitigate financial concerns or to ensure corporate survival, a number of firms have further decided to forego dividend payments and to keep the cash. Others, such as financial institutions, were prohibited or strongly discouraged by regulators to pay dividends leading to heated debates in the media and amongst politicians in many countries. As a result, one-third of firms in our universe decided to suspend dividend payments. This also had negative consequences on investors looking for dividend-paying stocks. In this paper, we thus examine how the pandemic affected stock price patterns of Western European companies surrounding the ex-dividend day, as COVID-19 (and the associated lockdowns) surprisingly hit this region just before the dividend distribution season.
Studies on stock price behavior around ex-dividend days have a long-standing history (Campbell and Beranek, 1955). In perfect capital markets, the stock price drop should equal the amount of the dividend paid out on the ex-dividend day. Many studies over the past fifty years have shown that this is not the case. The ex-dividend day premium (the ratio of price decline to dividend) has been shown to be consistently below one, thus generating positive returns (e.g., Elton and Gruber, 1970 or Eades et al., 1994). Over time, several reasons have been offered to explain this phenomenon.1
1 For additional references and a broader overview of the topic please refer to surveys by Allen and Michaely
- 2 -
Elton and Gruber (1970) propose a tax clientele effect. The stock price and ex-dividend day behavior will depend on the difference in taxation between capital gains and dividends. Later studies (e.g., Frank and Jagannathan, 1998) contradict this finding as the effect appears to remain in the absence of differential tax treatments. Kalay (1982) proposes that the insufficient price drop reflects the transaction costs of arbitrageurs trading such stock. These short-term traders will generate abnormal profit through dividend capturing. Michaely and Vila (1995), in a dynamic dividend clientele model, reconcile both explanations by examining all types of traders affecting the equilibrium price on the ex-dividend day. Finally, market microstructure may also explain the existence of this phenomenon. Bali and Hite (1998) and Frank and Jagannathan (1998) show that both price discreteness and a bid-ask bounce affect the ex-dividend price drop.
More recently, studies have incorporated behavioral aspects to explain stock price patterns around recurring corporate events2, such as dividend payments. Supply and demand for
dividend-paying stocks are likely to shift a few days before the ex-dividend day as some investors buy the stock to capture the dividend. This will attract arbitrageurs who will profit from offsetting price movements due to this dividend-motivated trading. If a demand overhang exists, and arbitrageurs cannot counterbalance it, stock prices should increase (Eades et al., 1985, Hartzmark and Solomon, 2013). If price pressure is responsible for positive abnormal returns before dividend payments, one ought to observe a decrease in prices after the ex-dividend day (Lakonishok and Vermaelen, 1986, Hartzmark and Solomon, 2013). This pattern in prices is termed the dividend month premium. Its existence has been corroborated internationally (Ainsworth and Nicholson, 2014, Koo and Chae, 2020, Kreidl and Scholz, 2020) and for several types of dividends (Bessembinder and Zhang, 2015, Berkman and Koch, 2017). Different explanations for this phenomenon have been proposed in the literature. They include
- 3 -
catering theory (Baker and Wurgler, 2004), mutual funds’ investments in dividend-paying stocks before the ex-dividend date to increase their dividend yield (Harris et al., 2015), or investors’ lack of attention in the stock price reduction from the cum-dividend to ex-dividend dates (Hartzmark and Solomon, 2019).
In the context of the COVID-19 pandemic, we argue that the dividend month premium may be altered due to the exceptional situation faced by investors. We do not take position on the drivers of the ex-dividend day premium. We hypothesize that a taxation and/or microstructure effect may exist, but both aspects should be reasonably unaffected by the emergence of COVID-19. We, however, expect the previously reported price pressure to be more intense. Indeed, the substantial decline in the number of dividend-paying companies should push dividend-seeking investors towards the remaining opportunities, sharply increasing demand for these stocks. Arbitrageurs may not be able to offset this sudden demand enough, leading to higher-than-normal abnormal returns.
Our empirical results show that the price patterns observed around ex-dividend dates during the COVID-19 pandemic are amplified and indicate that dividend-seeking investors are likely to be the main cause of these price changes. Concretely, an investor buying a stock five days before the ex-dividend date and selling it at the opening of the ex-day, would have earned an average abnormal return of 2.14% during the COVID period. This is close to double the average premium obtained on an equivalent trade in the pre-COVID period. Our paper contributes to the literature examining the stock price behavior around recurring corporate events by studying how an exogenous shock impacts the decision-making of investors. More specifically, we confirm the price pressure explanation of Hartzmark and Solomon (2013) and highlight the important role of dividend-chasing investors in the predictable evolution of stock prices around ex-dividend dates.
- 4 -
2 Data and methodology
2.1 Sample
The dataset covers the universe of publicly-listed Western European companies. To assure that companies show a minimum standard, the sample is limited to companies traded in their own country (i.e., avoiding international cross-listings) and on a country’s major exchange (i.e., avoiding domestic cross-listings). Companies must also have been active in July 2020. We further restrict the sample to investable companies by implementing the following two restrictions: the stock price is above EUR 1.00 and the market capitalization higher than EUR 50 million. The final sample includes 2,248 companies from 16 Western European markets3. All data is downloaded for the period January 2018 to July 2020 from Refinitiv
Datastream and converted into EUR for markets outside the Eurozone.
2.2 Methodology
To evaluate whether the COVID-19 pandemic has impacted trading around ex-dividend dates, we divide our sample into two groups: dividend payments occurring before (pre-COVID) and after (COVID) the pandemic started. As a cut-off date, we use February 24th, 2020, which
is the first day of lockdown in a Western European country. The COVID period thus encompasses the period 24/02/2020 to 31/07/2020. The pre-COVID period is used as a control group and covers the period 01/01/2018 to 23/02/2020.
For our analysis, we use an event study methodology in line with prior literature (Brown and Warner, 1985, Campbell et al., 1997). The daily returns of stocks are calculated in the following way
𝑅𝑖,𝑡 = 𝑃𝑖,𝑡+𝐷𝑖,𝑡−𝑃𝑖,𝑡−1
𝑃𝑖,𝑡−1 [1]
- 5 -
where Pi,t is the closing price on day t for stock i (except for t0 where it is the opening price on
the ex-date) and Di,t the dividend per share which was paid out. Ri,0 thus corresponds to an
overnight return of a stock going from cum to ex (after the stock exchange closes), while Ri,+1
is measured from the opening of the ex-date to the closing of the subsequent day.
Abnormal returns are calculated by deducting market returns from stock returns as
𝐴𝑅𝑖,𝑡 = 𝑅𝑖,𝑡− 𝑅𝑚,𝑡 [2]
where daily market returns (Rm,t) are calculated for each of the corresponding 16 benchmark
indices4. We then winsorize all ARi,t at the 0.1-99.9% level and calculate average abnormal
returns (AARt) as
𝐴𝐴𝑅𝑡 = 1
𝑁∑ 𝐴𝑅𝑖,𝑡 𝑁
𝑖=1 [3]
with ARi,t for a given period (e.g., pre-COVID and COVID), and cumulated average abnormal
returns for a given event window as
𝐶𝐴𝐴𝑅 = ∑𝑇 𝐴𝐴𝑅𝑡
𝑡=1 [4]
Berkman and Koch (2017) document that stocks with higher dividends have higher abnormal returns on the ex-day. In supporting tests, we thus divide the sample into firms with high (yearly upper quartile dividend yield) versus low dividend yields (bottom three quartiles) and estimate AARs and CAARs according to equations [3] and [4] for both subsamples. Finally, we examine the drivers of stock performance in the cross-section with the following specification
𝑦𝑖𝑗𝑡 = 𝛼𝑖+ 𝛿1𝑖𝐻𝑖𝑔ℎ_𝑝𝑟𝑒𝐶𝑂𝑉𝐼𝐷 + 𝛿2𝑖𝐻𝑖𝑔ℎ_𝐶𝑂𝑉𝐼𝐷 + 𝛿3𝑖𝐿𝑜𝑤_𝐶𝑂𝑉𝐼𝐷
+𝛽𝑖𝑋𝑗𝑡+ 𝜃𝑖𝐼𝑛𝑑𝑢𝑠𝑡𝑟𝑦 + 𝜔𝑖𝐶𝑜𝑢𝑛𝑡𝑟𝑦 + 𝜀𝑖𝑗𝑡 [5]
4 We use the following indices: ATX, BEL All-share, OMX Copenhagen, OMX Helsinki, CAC All-tradable,
XETRA Prime All-share, Athex Composite, ISEQ All-share, FTSE MIB, AEX, Oslo SE OBX, PSI All-share, Madrid SE IGBM, OMX Stockholm, Swiss Performance Index, FTSE All-share.
- 6 -
where yi,j,t measures the CAR for different time windows i for company j in year t.
High_preCOVIDt denotes a dummy equal to one for companies paying a dividend that is higher
than the yearly upper quartile dividend yield in the pre-COVID period. High_COVIDt is a
dummy indicating a high dividend yield firm in the COVID period. Low_COVIDt is a dummy
indicating companies paying a dividend that is lower than the yearly upper quartile dividend yield in the COVID period. Xj,t is a vector of firm-level characteristics. Following Zhang et al.
(2008), we include the relative risk (defined as the variance of a stock over its respective market variance over 40 days), beta (defined as the regression coefficient of a stock’s returns on the returns of its respective market index over a 250-day window), and size (defined as the natural logarithm of a company’s market capitalization). All three variables are calculated 21 days before the ex-dividend day. We also include country and industry dummies and cluster standard errors at the firm level.
2.3 Descriptive statistics
Table 1 provides evidence on the temporal evolution of dividend payouts for all companies (payers and non-payers) of the sample and an identical time period (24/02 to 31/07 of the respective year).
Table 1
Effect of COVID-19 on dividend payments
Year Payers Stop dividend Reduction Firms Total >25%
2018 66.69% 7.64% 7.45% 4.58% 2,750 2019 66.41% 6.16% 9.74% 5.49% 2,843 2020 35.76% 33.58% 10.60% 7.66% 2,886 This table reports, for the period 24/02 to 31/07 of each year, the fraction of dividend payers, companies stopping dividend payments, and firms reducing payments (overall or by more than 25%).
The fraction of payers in our sample dropped from 66.41% to 35.76% over the last year. Moreover, about one-third of companies paying a dividend in 2019 stopped doing so in 2020. There is also a marked increase in companies diminishing their dividend payments. Around
- 7 -
10.60% of companies reduced their payouts, and 7.66% cut it by more than 25%. Overall, these statistics confirm that opportunities to trade on ex-dividend dates have strongly decreased with the arrival of the pandemic.
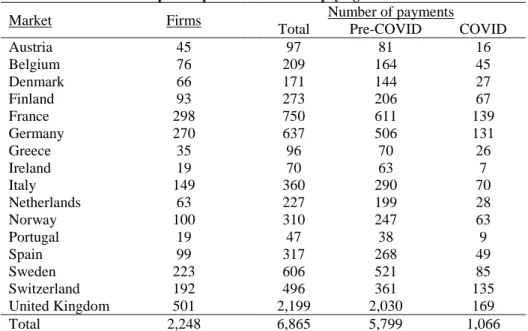
Table 2 exhibits the sample composition by market for companies paying out dividends. Our sample appears representative of the overall European environment with the United Kingdom, France, and Germany being the most represented markets in terms of companies and the number of dividend payouts. A higher payment-frequency in the United Kingdom (bi-annual and quarterly) explains its higher number of payouts.
Table 2
Sample composition of dividend-paying firms
Market Firms Number of payments
Total Pre-COVID COVID
Austria 45 97 81 16 Belgium 76 209 164 45 Denmark 66 171 144 27 Finland 93 273 206 67 France 298 750 611 139 Germany 270 637 506 131 Greece 35 96 70 26 Ireland 19 70 63 7 Italy 149 360 290 70 Netherlands 63 227 199 28 Norway 100 310 247 63 Portugal 19 47 38 9 Spain 99 317 268 49 Sweden 223 606 521 85 Switzerland 192 496 361 135 United Kingdom 501 2,199 2,030 169 Total 2,248 6,865 5,799 1,066 This table reports the number of dividend-paying companies per market and the number of payments done in total, in the pre-COVID period (01/01/2018-23/02/2020), and after the COVID outbreak (24/02/2020-31/07/2020) in Europe.
3 Empirical results
Table 3 exhibits AAR over a [-5; +5] day window around the ex-dividend date for both the COVID and pre-COVID period as well as CAAR for different windows before and after the ex-dividend date. In both cases, the returns are significantly positive until the ex-dividend date and negative thereafter as investors build up price pressure to capture dividends followed by a
- 8 -
reversal. Column 3 reports the difference in abnormal returns between the two periods. We observe that the stock price reactions amplified. Investors appear to have traded up the few stocks paying dividends more intensely than in regular times to capture dividends where possible. Arbitrageurs do not appear to have been able to counterbalance this spike in demand with their trades.5
Table 3
AAR and CAAR around ex-dividend dates
Panel A: AAR COVID Pre-COVID Difference
(1) (2) (1)-(2) -5 0.0025*** 0.0007*** 0.0018* -4 0.0006 0.0006** -0.0000 -3 0.0015* 0.0006** 0.0010 -2 0.0036*** 0.0011*** 0.0024*** -1 0.0046*** 0.0010*** 0.0036*** 0 0.0087*** 0.0069*** 0.0018** +1 -0.0058*** -0.0019*** -0.0038*** +2 -0.0032*** -0.0006*** -0.0026*** +3 -0.0026*** 0.0004* -0.0030*** +4 -0.0024*** -0.0000 -0.0024*** +5 -0.0009 0.0005** -0.0014* Observations 1,066 5,799
Panel B: CAAR COVID Pre-COVID Difference
(1) (2) (1)-(2) [-5; 0] 0.0214*** 0.0109*** 0.0105*** [-4; 0] 0.0189*** 0.0102*** 0.0087*** [-3; 0] 0.0184*** 0.0096*** 0.0087*** [-2; 0] 0.0168*** 0.0091*** 0.0078*** [-1; 0] 0.0133*** 0.0079*** 0.0053*** [+1; +2] -0.0089*** -0.0025*** -0.0064*** [+1; +3] -0.0115*** -0.0022*** -0.0094*** [+1; +4] -0.0140*** -0.0022*** -0.0118*** [+1; +5] -0.0149*** -0.0016*** -0.0132*** Observations 1,066 5,799
This table reports AAR (Panel A) and CAAR (Panel B) for different time windows around ex-dividend dates for the COVID and pre-COVID period. ***, **, * denote significance at the 1%, 5% and 10%-level.
Companies paying higher dividends should be in higher demand by investors wanting to capture dividends. As the pandemic triggered a drop of firms paying dividends, we argue that
5 We run several robustness tests and find that (i) restricting the dataset to companies with a minimum market
capitalization of EUR 100 million, (ii) using a pre-COVID period over 2015-2019 or for 2019 only, or (iii) taking the closing price of the ex-dividend day t0,all lead to qualitatively very similar results.
- 9 -
this effect was further exacerbated during this period. In Table 4, we observe stronger return patterns for high-dividend stocks than for low-dividend stocks in both the pre-COVID and COVID periods. Moreover, the last column indicates that during the COVID pandemic, high-dividend stocks had the largest abnormal returns (in absolute terms). This provides evidence that investors were especially seeking those stocks allowing them to capture the highest possible dividend. These results are confirmed in Figure 1. It illustrates the evolution of the CAAR over a [-5; 5] day window for the baseline specification and the one splitting by the intensity of dividend-payment.
Figure 1
Cumulative average abnormal returns (CAAR)
Panel A: All firms
Panel B: High-dividend (left) vs low-dividend (right) firms
Panel A illustrates the evolution of CAAR, expressed in percent, over a [-5; +5] window around the ex-dividend day. The dashed line denotes the pre-COVID period and the solid line the COVID period. Panel B illustrates the evolution of CAAR over a [-5; +5] window around the ex-dividend day. The left figure contrasts high-dividend stocks (top quartile of annual dividend yield) and the right figure low-dividend stocks (bottom three quartiles of annual dividend yield) over the pre-COVID period (dashed line) and the COVID period (solid line).
0 1 2 3 4 -5 -4 -3 -2 -1 0Days 1 2 3 4 5 PreCOVID COVID 0 1 2 3 4 -5 -4 -3 -2 -1 0Days 1 2 3 4 5 HighDividends-PreCOVID HighDividends-COVID 0 1 2 3 4 -5 -4 -3 -2 -1 0Days 1 2 3 4 5 LowDividends-PreCOVID LowDividends-COVID
- 10 -
Table 4
AAR and CAAR around ex-dividend dates – high- versus low-dividends
COVID Pre-COVID COVID / Pre-COVID
Panel A: AAR High-dividend Low-dividend Difference High-dividend Low-dividend Difference Difference
(1) (2) (1)-(2) (3) (4) (3)-(4) (1)-(3) -5 0.0050*** 0.0015 0.0035* 0.0006 0.0007** -0.0001 0.0044** -4 -0.0001 0.0008 -0.0008 0.0010** 0.0005* 0.0006 -0.0011 -3 0.0034* 0.0009 0.0026 0.0013*** 0.0003 0.0010* 0.0021 -2 0.0050*** 0.0030*** 0.0019 0.0016*** 0.0010*** 0.0006 0.0033* -1 0.0055*** 0.0042*** 0.0013 0.0008* 0.0010*** -0.0002 0.0047*** 0 0.0154*** 0.0062*** 0.0092*** 0.0126*** 0.0051*** 0.0075*** 0.0028** +1 -0.0139*** -0.0027** -0.0111*** -0.0053*** -0.0008** -0.0045*** -0.0086*** +2 -0.0060*** -0.0021** -0.0039** -0.0014*** -0.0004 -0.0010* -0.0046** +3 -0.0034** -0.0024** -0.0010 -0.0006 0.0007*** -0.0013** -0.0028* +4 -0.0032** -0.0022** -0.0010 -0.0009** 0.0003 -0.0012** -0.0022 +5 -0.0016 -0.0006 -0.0010 -0.0004 0.0009*** -0.0013** -0.0011 Observations 288 778 1,429 4,370
COVID Pre-COVID COVID / Pre-COVID
Panel B: CAAR High-dividend Low-dividend Difference High-dividend Low-dividend Difference Difference
(1) (2) (1)-(2) (3) (4) (3)-(4) (1)-(3) [-5; 0] 0.0343*** 0.0166*** 0.0177*** 0.0180*** 0.0086*** 0.0094*** 0.0163*** [-4; 0] 0.0292*** 0.0151*** 0.0141*** 0.0173*** 0.0079*** 0.0095*** 0.0119*** [-3; 0] 0.0293*** 0.0143*** 0.0150*** 0.0163*** 0.0074*** 0.0089*** 0.0130*** [-2; 0] 0.0259*** 0.0135*** 0.0124*** 0.0150*** 0.0071*** 0.0079*** 0.0108*** [-1; 0] 0.0209*** 0.0104*** 0.0105*** 0.0134*** 0.0061*** 0.0073*** 0.0075*** [+1; +2] -0.0199*** -0.0049*** -0.0150*** -0.0067*** -0.0012*** -0.0055*** -0.0132*** [+1; +3] -0.0232*** -0.0072*** -0.0160*** -0.0073*** -0.0005 -0.0068*** -0.0160*** [+1; +4] -0.0264*** -0.0094*** -0.0170*** -0.0082*** -0.0002 -0.0080*** -0.0182*** [+1; +5] -0.0280*** -0.0100*** -0.0180*** -0.0086*** 0.0007 -0.0092*** -0.0194*** Observations 288 778 1,429 4,370
This table reports AAR (Panel A) and CAAR (Panel B) for different time windows around ex-dividend dates for the COVID and pre-COVID period. The sample is further split into High-dividend for companies in the yearly upper quartile of dividend yields and Low-dividend for other firms. ***, **, * denote significance at the 1%, 5% and 10%-level.
- 11 -
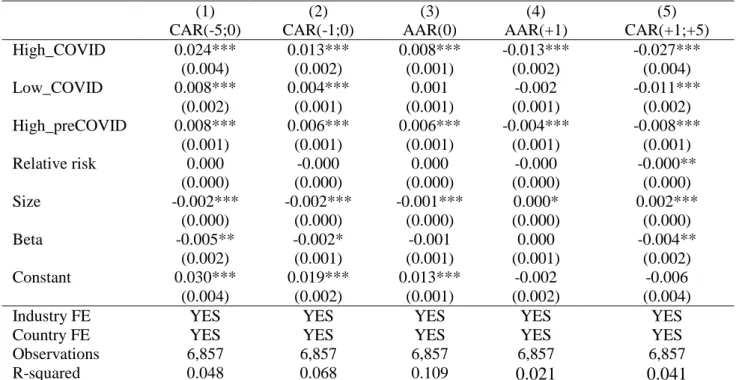
Table 5 further confirms our main findings in a multivariate setting controlling for firm-characteristics such as risk, firm size, industry- and country-effects. Consistent with existing literature and our previous results, regression analyses confirm stronger return patterns for firms paying high dividends regardless of the window considered. Relative to the pre-COVID period, results display a higher cumulated abnormal return preceding the ex-dividend day during the COVID period. We further observe the inverse effect following ex-dividend days.1 This result
remains valid for both low- and high-dividend payers and supports the hypothesis of an increase in price pressure due to a shortage of dividends during the pandemic. The strong positive abnormal returns of high-dividend stocks lead to a significantly stronger reversal effect and more negative abnormal returns when investors unwind their positions.
Table 5
Regression analysis on AAR and CAR
(1) (2) (3) (4) (5)
CAR(-5;0) CAR(-1;0) AAR(0) AAR(+1) CAR(+1;+5)
High_COVID 0.024*** 0.013*** 0.008*** -0.013*** -0.027*** (0.004) (0.002) (0.001) (0.002) (0.004) Low_COVID 0.008*** 0.004*** 0.001 -0.002 -0.011*** (0.002) (0.001) (0.001) (0.001) (0.002) High_preCOVID 0.008*** 0.006*** 0.006*** -0.004*** -0.008*** (0.001) (0.001) (0.001) (0.001) (0.001) Relative risk 0.000 -0.000 0.000 -0.000 -0.000** (0.000) (0.000) (0.000) (0.000) (0.000) Size -0.002*** -0.002*** -0.001*** 0.000* 0.002*** (0.000) (0.000) (0.000) (0.000) (0.000) Beta -0.005** -0.002* -0.001 0.000 -0.004** (0.002) (0.001) (0.001) (0.001) (0.002) Constant 0.030*** 0.019*** 0.013*** -0.002 -0.006 (0.004) (0.002) (0.001) (0.002) (0.004)
Industry FE YES YES YES YES YES
Country FE YES YES YES YES YES
Observations 6,857 6,857 6,857 6,857 6,857
R-squared 0.048 0.068 0.109 0.021 0.041
This table reports CAR and AAR for different time windows around ex-dividend dates for the COVID and pre-COVID period. High_COVID denotes yearly upper quartile dividend yield companies in the COVID period, Low_COVID yearly bottom three quartile dividend yield companies in the COVID period, and High_preCOVID yearly upper quartile dividend yield companies in the pre-COVID period. Relative risk is defined as the variance of a stock over the variance of its benchmark index, and Beta the coefficient of a stock’s returns, regressed on its benchmark index returns. Size is the natural logarithm of the market capitalization of a company. All regressions include country and industry dummies. Standard errors are clustered at the firm level. ***, **, * denote significance at the 1%, 5% and 10%-level.
1 Splitting dividend-paying stocks at the yearly median instead of the top-quartile yields qualitatively similar results
- 12 -
4 Conclusions
It is well-documented that price pressure by investors seeking dividends leads to positive abnormal returns before ex-dividend days and a subsequent reversal. The COVID-19 pandemic has induced a severe drop in both the number of dividend-paying firms and the amounts distributed. It thus provides a unique setting to examine the impact on prices by dividend-seeking investors around ex-dividend days. Compared to previous years, we observe a doubling in the magnitude of stock return patterns around this date. This indicates that dividend capture plays an important role in price formation around the ex-date and that arbitrageurs have not sufficiently offset the spike in interest for companies still paying dividends.
5 References
Ainsworth, A., and Nicholson, M., 2014. Can Dividend Schedules Predict Abnormal Returns? International Evidence. Working Paper.
Allen, F., and Michaely, R., 2003. Payout Policy. In: Constantinides, G. M., Harris, M., and Stulz, R. M., (Eds.), Handbook of the Economics of Finance. Elsevier, Amsterdam, pp. 337-429. Baker, M., and Wurgler, J., 2004. A Catering Theory of Dividends. Journal of Finance 59,
1125-1165.
Bali, R., and Hite, G. L., 1998. Ex Dividend Day Stock Price Behavior: Discreteness or Tax-Induced Clienteles? Journal of Financial Economics 47, 127-159.
Berkman, H., and Koch, P. D., 2017. Drips and the Dividend Pay Date Effect. Journal of Financial and Quantitative Analysis 52, 1765-1795.
Bessembinder, H., and Zhang, F., 2015. Predictable Corporate Distributions and Stock Returns. Review of Financial Studies 28, 1199-1241.
Brown, S. J., and Warner, J. B., 1985. Using Daily Stock Returns: The Case of Event Studies. Journal of Financial Economics 14, 3-31.
Campbell, J., Lo, A., and MacKinlay, C., 1997. The Econometrics of Financial Markets. Princeton University Press, Princeton.
Campbell, J. A., and Beranek, W., 1955. Stock Price Behavior on Ex-Dividend Dates. Journal of Finance 10, 425-429.
- 13 -
Eades, K. M., Hess, P. J., and Kim, E. H., 1985. Market Rationality and Dividend Announcements. Journal of Financial Economics 14, 581-604.
Eades, K. M., Hess, P. J., and Kim, E. H., 1994. Time‐Series Variation in Dividend Pricing. Journal of Finance 49, 1617-1638.
Elton, E., and Gruber, M., 1970. Marginal Stockholder Tax Rates Andthe Clientele Effect. Review of Economics and Statistics 52, 68-74.
Farre-Mensa, J., Michaely, R., and Schmalz, M., 2014. Payout Policy. Annual Review of Financial Economics 6, 75-134.
Frank, M., and Jagannathan, R., 1998. Why Do Stock Prices Drop by Less Than the Value of the Dividend? Evidence from a Country without Taxes. Journal of Financial Economics 47, 161-188.
Harris, L. E., Hartzmark, S. M., and Solomon, D. H., 2015. Juicing the Dividend Yield: Mutual Funds and the Demand for Dividends. Journal of Financial Economics 116, 433-451. Hartzmark, S. M., and Solomon, D. H., 2013. The Dividend Month Premium. Journal of Financial
Economics 109, 640-660.
Hartzmark, S. M., and Solomon, D. H., 2018. Recurring Firm Events and Predictable Returns: The within-Firm Time Series. Annual Review of Financial Economics 10, 499-517.
Hartzmark, S. M., and Solomon, D. H., 2019. The Dividend Disconnect. Journal of Finance 74, 2153-2199.
Kalay, A., 1982. The Ex‐Dividend Day Behavior of Stock Prices: A Re‐Examination of the Clientele Effect. Journal of Finance 37, 1059-1070.
Koo, B., and Chae, J., 2020. Dividend Month Premium in the Korean Stock Market. Journal of Derivatives and Quantitative Studies.
Kreidl, F., and Scholz, H., 2020. Exploiting the Dividend Month Premium: Evidence from Germany. Working Paper.
Lakonishok, J., and Vermaelen, T., 1986. Tax-Induced Trading around Ex-Dividend Days. Journal of Financial Economics 16, 287-319.
Michaely, R., and Vila, J.-L., 1995. Investors' Heterogeneity, Prices, and Volume around the Ex-Dividend Day. Journal of Financial and Quantitative Analysis 30, 171-198.
Zhang, Y., Farrell, K. A., and Brown, T. A., 2008. Ex-Dividend Day Price and Volume: The Case of 2003 Dividend Tax Cut. National Tax Journal 61, 105-127.
Authors
Nicolas EUGSTER
University of Queensland, University of Queensland Business School, St Lucia, Brisbane 4072, Australia. Email: [email protected]. More information on https://nicolaseugster.com/
Romain DUCRET
University of Fribourg, Boulevard de Pérolles 90, CH-1700 Fribourg, Switzerland, email: [email protected]. More information on https://www.unifr.ch/cgf Dušan ISAKOV
University of Fribourg, Boulevard de Pérolles 90, CH-1700 Fribourg, Switzerland, email: [email protected]. More information on https://www.unifr.ch/cgf Jean-Philippe WEISSKOPF
Ecole hôtelière de Lausanne, HES-SO Haute école spécialisée de Suisse Occidentale, Route de Cojonnex 18, 1000 Lausanne, Switzerland. Email: [email protected]. More information on https://weisskopf.weebly.com/
Bd de Pérolles 90 CH-1700 Fribourg Tél.: +41 (0) 26 300 82 00 [email protected] www.unifr.ch/ses
Université de Fribourg, Suisse, Faculté des sciences économiques et sociales et du management Universität Freiburg, Schweiz, Wirtschafts- und sozialwissenschaftliche Fakultät
University of Fribourg, Switzerland, Faculty of Management, Economics and Social Sciences
Working Papers SES collection
Abstract
This paper investigates the impact of the COVID-19 pandemic on the trading behavior of investors around ex-dividend dates in Europe. The sudden decrease in the number of companies paying dividends reduced the opportunities to capture dividends. The firms that have maintained dividend payments during the pandemic thus attracted more interest than before. This led to a doubling in the magnitude of stock return patterns usually observed around ex-dividend days. Our evidence indicates that ex-dividend-seeking investors are likely to be the main driver of the price patterns observed around ex-dividend dates.
Citation proposal
Nicolas Eugster, Romain Ducret, Dušan Isakov, Jean-Philippe Weisskopf. 2020. «Chasing dividends during the COVID-19 pandemic». Working Papers SES 520, Faculty of Economics and Social Sciences, University of Fribourg (Switzerland)
Jel Classification
G12; G14; G35.
Keywords
COVID-19; dividend capture; price pressure; ex-dividend date; event study.
Last published
513 Wallimann H., Imhof D., Huber M.: A Machine Learning Approach for Flagging Incomplete Bid-rigging Cartels; 2020 514 Huber M., Lafférs L.: Bounds on direct and indirect effects under treatment/mediator endogeneity and outcome attrition;
2020
515 Farbmacher H., Huber M., Langen H., Spindler M.: Causal mediation analysis with double machine learning; 2020 516 Fernandes A., Huber M., Vaccaro G.: Gender Differences in Wage Expectations; 2020
517 Deschênes S., Dumas C., Lambert S.: Household Resources and Individual Strategies; 2020 518 Dumas C., Jàativa X.: Better roads, better off? Evidence on improving roads in Tanzania; 2020
519 Huber M., Imhof D., Ishii R.: Transnational machine learning with screens for flagging bid-rigging cartels; 2020
Catalogue and download links
http://www.unifr.ch/ses/wp
http://doc.rero.ch/collection/WORKING_PAPERS_SES
Publisher