Publisher’s version / Version de l'éditeur:
Vous avez des questions? Nous pouvons vous aider. Pour communiquer directement avec un auteur, consultez la première page de la revue dans laquelle son article a été publié afin de trouver ses coordonnées. Si vous n’arrivez pas à les repérer, communiquez avec nous à PublicationsArchive-ArchivesPublications@nrc-cnrc.gc.ca.
Questions? Contact the NRC Publications Archive team at
PublicationsArchive-ArchivesPublications@nrc-cnrc.gc.ca. If you wish to email the authors directly, please see the first page of the publication for their contact information.
https://publications-cnrc.canada.ca/fra/droits
L’accès à ce site Web et l’utilisation de son contenu sont assujettis aux conditions présentées dans le site LISEZ CES CONDITIONS ATTENTIVEMENT AVANT D’UTILISER CE SITE WEB.
Technical Translation (National Research Council of Canada), 1983
READ THESE TERMS AND CONDITIONS CAREFULLY BEFORE USING THIS WEBSITE.
https://nrc-publications.canada.ca/eng/copyright
NRC Publications Archive Record / Notice des Archives des publications du CNRC :
https://nrc-publications.canada.ca/eng/view/object/?id=92c04b54-85ec-4cee-97c8-30035faee429 https://publications-cnrc.canada.ca/fra/voir/objet/?id=92c04b54-85ec-4cee-97c8-30035faee429
NRC Publications Archive
Archives des publications du CNRC
For the publisher’s version, please access the DOI link below./ Pour consulter la version de l’éditeur, utilisez le lien DOI ci-dessous.
https://doi.org/10.4224/20338094
Access and use of this website and the material on it are subject to the Terms and Conditions set forth at
Effect of an ice cover frozen to the cylindrical supports of offshore oil
well platforms subjected to water level fluctuations
- - - -- -- - - -
---NATIONAL RESEARCH COUNCIL CANADA CONSEIL NATIONAL DE RECHERCHES CANADA
Authors/Auteurs: TECHNICAL TRANSLATION TRADUCTION TECHNIQUE Vershinin, セNaN et al. 2041 Title/Titre: Reference/Reference: Translator/Traducteur:
Effect of an ice cover frozen to the cylindrical
supports of offshore oil well platforms subjected to water level fluctuations.
Neftepromyslovoe Stroitel'stvo, (4): 9-11, 1980.
W. Kent.
Canada Institute for Scientific and Technical Information
Institut canadien de l'information scientifique et technique
Ottawa, Canada KIA OS2
PREFACE
An ice cover frozen to a pile can develop significant vertical forces as a
result of water level fluctuations. In Canada each winter many marinas and
small docks suffer damage as a result of this type of ice action. These
vertical forces are also an important factor in the design of piled offshore
structures in areas where ice covers form. This problem is common to many
northern countries.
The following article, translated from the Russian, describes an apparatus
for carrying out field experiments on ice adhesion to vertical piles and
presents the results of one typical test. There is a brief discussion of
how this test result compares with the recommendations of the current Soviet standard.
The Division wishes to thank 'fl. Kent who translated the paper and to Dr.
R.M.W. Frederking of the Division who edited the translation.
Ottawa
January 1983
C.B. Crawford Director
3
-EFFECT OF AN ICE COVER FROZEN TO THE CYLINDRICAL SUPPORTS OF OFFSHORE OIL WELL PLATFORMS SUBJECTED TO WATER LEVEL FLUCTUATIONS
by Vershinin, S.A. et al.*
As water levels change an ice cover which is frozen to the walls of
cylindrical supports exerts a significant lifting force on them. This force
must be taken into account in the design of ice-resistant oil and gas well
structures. Field experiments were carried out in order to determine the
actual values of ice loads and to study the mechanism of the breakup of an
ice cover against a support. The measurements were made using a statically
equivalent setup in which the ice cover remained motionless at a distance,
while a model of a support, which was first frozen into the ice field, was
moved downward.
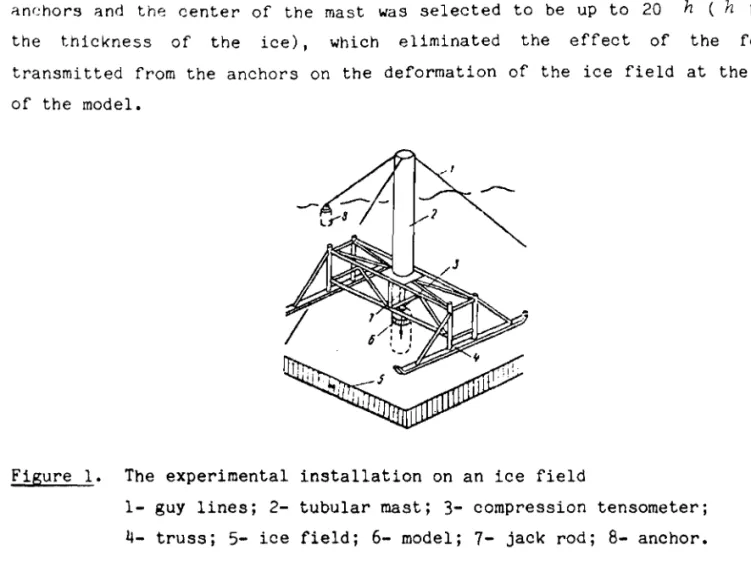
A specially designed and constructed installation made it possible, with the aid of a hydraulic jack, to submerge the model at the desired rate of speed
(Figure 1). The installation consisted of a tubular mast 2, erected on a
truss 4 which was fixed on runners. Within the truss, and in line with the
axis of the tubular mast, there was a hydraulic jack having a maximum
capacity of 150 tonf, a piston speed of 1 m/min, and a maximum stroke of 1.8
m. Three guy lines 1, 1200 apart, were attached to the mast by means of a
yoke. Each guy line consisted of two steel cables 36 rom in diameter. In
preparation for the experiment, the installation was transported to the test section of the ice cover 5 and positioned with the piston of the hydraulic
jack pointing toward the center of the model when it was frozen into the
ice. Preliminary calculations revealed that when a model weighing 10 tons
and having a diameter of 1 m is pushed down the vertical loads may be 100
tonf. For this reason guy lines, attached to the upper portion of the
tubular mast, were used to secure the installation to anchors 8 which were
frozen into the ice. The anchors were hollow metal cylinders 820 rom in
diameter and 1.5 m long. Between the anchor and the guy line there was a
4
-threaded sleeve and a yoke for tensioning the cable. The anchors were
located in a checkerboard pattern, which made it possible to reuse them when
carr-ying out experi ment s with several models. The distance between the
anchors and the center of the mast was selected to be up to 20 h ( h being
the thickness of the ice), which eliminated the effect of the forces
transmitted from the anchors on the deformation of the ice field at the site of the model.
Figure 1. The experimental installation on an ice field
1- guy lines; 2- tubular mast;
3-
compression tensometer;4- truss; 5- ice field;
6-
model;7-
jack rod;8-
anchor.The load was applied to the model after the hydraulic system was switched
on. The rod of the jack pressed against the central portion of the model
and, as the hydraulic force increased, there was a tightening of the cables of the mast assembly, which took up the reactive force from the pressure of
the jack on the model. As the model was pushed down it was constantly
monitored for changes in the forces and movement of both the model itself and of the ice field at a distance of 1.1 m from the center of application of the force in order to eliminate the effect of the possible uplift of the upper crust of the ice field around the model on the measurement results.
5
-In order to measure the forces between the jack rod 7 and the central
portion of the model 6, a compression resistance tensometer 3 (type nCH-lOO)
was installed. It was encased in a metal housing with two articulated
supports to prevent damage.
The resistance tensometer was a sealed device which uniaxially sensed the compressive force being measured.
Displacements were measured with the aid of potentiometric transducers. An
immobile reference point for mounting the displacement transducers was
provided by a metal pipe which was driven into the seabed through a hole in the ice.
Figure 2. Block diagram of the instrument system
1- compression tensometer; 2- Topaz-2 amplifier;
3,
6, 10- power sources; 4- displacement transducer;5- control panel; 7- voltage regulator; 8- portable generator; 9- oscillograph.
f
I
MMMMGMMMMMMMMMMMMMMMMMMMMMMMMMMMMMセᄋᄋゥ
i
6
-The mechanical effects of the stresses and displacements picked up by the
sensors were transformed into electrical signals which were transmitted to
measuring instruments located in a mobile laboratory. Due to the fact that
the amplifiers and recorders were designed to work at above-freezing
temperatures (+5° C and above) the laboratory structure was heated day and
night. A block diagram of the instrument system is shown in Figure 2. The
signals from the compression tensometers 1 and the displacement transducers
4 proceeded to a Topaz-2 resistance tensometer amplifier 2, and to the
displacement transducer control panel 5, respectively. The amplifier and
the control panel operated on direct current from the power sources 3 and
6.
The output signals were recorded on photographic paper by the beam froman H-115 light oscillograph 9 having a TI-133 power source 10. The electric power for all of the apparatus and for the hydraulic jack was provided by a
,U3C-50 portable generator 8. Potentiometric transducers were used to
measure the linear displacements of the models and of the ice field. The
sensing elements of these transducers were commercially available
potentiometers.
\ \
I
s
:,
Figure
3.
Schematic diagram of calibration bench1- stand; 2- matching-and-power unit;
3-
oscillograph;4- point gauge; 5- cable; 6- deflectometer; 7- transducer; 8- roller; 9- weight.
..
7
-The actual values of the loads which developed as the models were pushed through the ice field, and as the models and the ice field shifted, were determined using calibration coefficients. The strain gauges were calibrated on a hydraulic press before and after the experiments; the displacement transducers were calibrated on a special bench (Figure
3).
The transducer7
and a roller 8 were attached to a stand 1. One end of a cable 5 was attached to a point gauge 4, after which it made one turn around each of a Maximov deflectometer 6, the transducer, and the roller, and was finally attached to a weight9.
The electrical signals from the transducer were fed to a matching-and-power unit 2 and then to an H-1l5 light-beam oscillograph3.
The transducer was calibrated for the maximum degree of displacement anticipated in the expirement. The calibration diagram which was obtained for the potentiometric displacement transducers is represented by a linear function.
In order to determine the magnitude of the load acting on the support, and to determine the bearing capacity of the ice cover as it breaks up, i t is necessary to know the bending strength and the deformability of the ice cover. Experiments to establish these values were carried out with the aid of a
nAPC
tractor-powered unit [possibly Mobile Automobile Repair Station. TranslatorJ
equipped with a crane. A cantilever beam L=6 m long and b=1 m wide was sawn out of the ice field. A steel cable connected to the hook of the crane was attached to the free end of the beam. The hoist was then switched on and the beam was broken. The bending strength of the cantilever beam was measured with the aid of a セケMャo gauge installed between the cable from the beam and the crane hook. The deformation of the ice beam was measured with the aid of a potentiometric transducer. The forces and deformations were recorded with the aid of an H-ll5 light-beam oscillograph at the mobile laboratory. The rupture test results of beams h =1.25 m high were used to establish the bending strength of the ice field R and the1.1
modulus of deformation during bending E. The mean values which were obtained for the bending strength R =3.2 kgfIcm2 and for the modulus of
3 2 1.1
deformation E' =23.3XlO kgflcm are in agreement with preViously obtained values for the Rand E of sea ice.
8
-Experiments on the interaction of an ice cover with a cylindrical support frozen into the ice and sub jected to a vertical load yielded the following preliminary results. Five experiments were carried out on an ice field 1.15 m thick. In four of the experiments the load attained a value of 70 tonf (mean daily temperature of -140 C); only in one of the experiments did the
load drop to 30 tonf as a result of an increase in the air temperature to
_20 C. Figure 4 is a diagram of the changes in the force and the displacement of the cylindrical support as a function of time. It may be seen from the diagram that the model was displaced downward at a constant rate of 6 cm/min., which corresponds to quite a high rate of change in sea level (3.6 m/hour). Time between the initial application of the load and the first fracture did not exceed 90 seconds, which made i t possible to ignore a possible decrease in the strength of the ice field over time, and to consider the load measurements to be maximums.
The experimental results showed that the actual values of the lifting forces exerted by an adfrozen ice cover and acting on the cylindrical supports and piles of oil and gas wells may exceed by several times the values computed according to the recommendations found in the Construction Norms and Regulations·. This must be taken into account in the design of ice-resistant pile structures.
J(J tP J{J .w a? It.'I yt!'()O
I.e
Figure 4. Diagram of changes in force and displacement as a function of time
t
1- force exerted downward on the model P; 2- 、ゥセーャ。」ーNューNョエ of ュッセーNャ h ;
M
3-
displacement of ice field セ • 11• SNIP-1l-57-75 Loads exerted on hydraulic structures by Waves, Ice and Ships, NRCC TT-1968, 1980.