Publisher’s version / Version de l'éditeur:
Adhesives Age, 28, 5, pp. 18-22, 1985-05
READ THESE TERMS AND CONDITIONS CAREFULLY BEFORE USING THIS WEBSITE. https://nrc-publications.canada.ca/eng/copyright
Vous avez des questions? Nous pouvons vous aider. Pour communiquer directement avec un auteur, consultez la première page de la revue dans laquelle son article a été publié afin de trouver ses coordonnées. Si vous n’arrivez pas à les repérer, communiquez avec nous à [email protected].
Questions? Contact the NRC Publications Archive team at
[email protected]. If you wish to email the authors directly, please see the first page of the publication for their contact information.
NRC Publications Archive
Archives des publications du CNRC
This publication could be one of several versions: author’s original, accepted manuscript or the publisher’s version. / La version de cette publication peut être l’une des suivantes : la version prépublication de l’auteur, la version acceptée du manuscrit ou la version de l’éditeur.
Access and use of this website and the material on it are subject to the Terms and Conditions set forth at
Testing polysulfide sealant deformation on vises
Karpati, K. K.
https://publications-cnrc.canada.ca/fra/droits
L’accès à ce site Web et l’utilisation de son contenu sont assujettis aux conditions présentées dans le site LISEZ CES CONDITIONS ATTENTIVEMENT AVANT D’UTILISER CE SITE WEB.
NRC Publications Record / Notice d'Archives des publications de CNRC:
https://nrc-publications.canada.ca/eng/view/object/?id=1f015db5-fa2c-42cd-a38c-897b9e3f7678 https://publications-cnrc.canada.ca/fra/voir/objet/?id=1f015db5-fa2c-42cd-a38c-897b9e3f7678Sar
THl
l4
7 / 5
N2bd
National Research
Consell natlonal
I
ISll
Councll Canada
de
recherche8 Canada
c. 2
BID3
Division of
Division des
- - - - -
Building Research
recherches en biitiment
Testing Polysulfide Sealant
Deformation on Vises
Reprinted from
Adhesives Age
Volume 28, No. 5, May 1985
p.
18-22
(DBR Paper No. 1340)
Price $2.00
NRCC 25204
b
N R C-
C f I T lRDG.
RfS.
L I B R A R Y
06-
07-
7
~ I ~ L I O T H ~ Q U E
Ruh.
W m .
C N R C-
l C l l TOn a expos6 sur des gtaux un produit d'6tanchgit6
3 base de
polysulfures,
3
deux composants, afin de le sournettre
manuellement
b
des changements de largeur, c'est-3-dire
3
des
cycles annuels semblables
b
ceux qui se produisent sur un
support d'exposition aux cycles de dgformation servant
3
simuler le mouvement des joints de constxuction. Les rgsultats
indiquent que pour rgaliser I'essai, on peut remplacer le
support d'exposition par des gtaux.
Testing Polysulfide
Deformation on
By K.K.
Karpati
Research Officer
Division of Building Research
National Research Council Canada
Ottawa, Canada KIA OR6
two-part polysulfide sealant hasbeen exposed on vises in order to
A,
ubject it to width changes man- ually - yearly cycles similar to those occurring on a strain-cycling exposure rack that simulates the movement of building joints. The results indicate that the strain-cycling rack test can be re- placed by one using vises, establishing a link between outdoor behavior and lab- oratory testing.It has been established that move- ment is the most important factor influ- encing sealant behavior(1). A vise(2) has been designed at the Division of Build- ing Research of the National Research Council Canada (DBR/NRCC) that im- poses movements on sealant specimens at arbitrarily chosen amplitudes and time intervals by manual adjustment. This paper reports the results obtained for tests on a two-part polysulfide seal- ant exposed outdoors on the vises and compares them with previous results
I
Figure 1. Specimens are exposed outdoors on vises.Test results establish
a link between
outdoor behavior and
laboratory testing.
from a strain-cycling rack(3) that imi- tates the movements of outside building joints.
Experiment
A light grey, two-part polysulfide sealant was applied without primer on aluminum substrates, as in previous work(1). In both cases, the substrate was cleaned manually, then with trich- loroethylene vapor. The sealant bead was 12.7 x 12.7 x 50.8 mm (0.50 x 0.50 x 2.00 in.), and the aluminum bars were 12.7 x 25.4 x 76.2 mm (0.50 x 1.00 x
~f VMC
1
Sealant
Vises
3.00 in.). In accordance with the manu- facturer's instructions, the substrate was not primed before application of the sealant. The specimens were cast using silicone release paper pnderneath the bead and on the end spacers that limit the length of the bead to 2 in.
The specimens were exposed out- doors as soon as they could be handled (within a few days of preparation) to duplicate practice as closely as possible. They were attached t o vises(2) a n d placed in a vertical position facing south (Figure 1). Various extensions and compressions were imposed on the specimens to determine the ability of the sealant to withstand joint movements. The total yearly extension and compres- sion ranged f r o m k 10%-
s
80% in steps of 5%. From k 10%- k 35% there were six replicates and above that two for each level. The vise widths were changed once a month, each change being one third of the total for the year.t ' . . - . - S of Y B 01 YME H a YMC HE: Yearly HC: Ynerly maximurr I maximun cf YMC i extensia
9 compres sion Figure schedule of joint 2. Time width changes.
Reprinted from ADHESIVES AGE, May 1985
O 1985 by Communication Channels, Inc., Atlanta, Ga., U.S.A.
Figures 3a (left) and 3h (right). Stage 1 of permanent deformation (ex- Figures 4a (left) and 4h (right). Stage 1 of permanent deformation (ex- posure for > 3 yr, *25%. 3a: south exposure, underside at prepara- posure for three winters, +25%. 4a: south exposure, top side at prep- tion; 3h: north exposure, top side at preparation. aration; 4b: north exposure, underside at preparation.
Accuracy was checked with calipers to k0.13 mm ( k 0.005 in.). For example, the six specimens subjected to 30% total movement were changed monthly by 10%. As shown in Figure 2, maxi- mum deformations were achieved at the yearly extreme temperatures, and the original joint width was reached in mid- April and mid-October when the yearly average temperatures occur. Exposure was started in May 1977 with one third of the applicable compression.
Specimens marked with odd numbers were exposed with the side that was top during preparation towards the south. The top of the evenly numbered speci- mens faced the rack. All were assessed visually, and photographs were taken six times during the three-year exposure period. A few specimens were exposed without changes in width, and some were stored in a room maintained at 22" k 2°C and 50% t 5010 relative hu- midity.
Some of the specimens exposed on the vises did not undergo permanent deformation. They were subsequently tested in tension at the rate of 5.0 mm/
min at 22°C (72°F) together with the specimens exposed without width change and those stored in the condi- tioned room.
Results
Influence of Preparation on Appear-
ance. Depending on the orientation of
the specimens during exposure, there were slight variations in their appear- ance. In previous investigations(l), it had been found that two-part polysul- fide sealant specimens exposed on a strain-cycling rack designed to simulate the continuous movement of an outside building joint underwent permanent de- formation, with cavity formation mainly on the side exposed to the north (facing the rack). On the side facing south only surface cracks appeared, and these were concentrated close to the in- terface between the bar and the sealant. These specimens were always exposed with the top facing south (casting was done in a horizontal position). In the present work half the specimens were exposed with the top facing south (odd
numbers) and half with them facing the rack (even numbers) t o investigate whether the difference might originate in the preparation.
The results are shown in Figures 3-6. Comparison of the photographs shows that the underside, whether exposed north (4b, 6b) or south (3a, 5a), under- goes more permanent deformation in the form of a depression along the cen- ter. The depression on the underside ex- posed to the south is more visible be- cause of the cracks that occur, but it is no deeper than that on the underside exposed to the north.
The depression is expected to form in the center because the material becomes thinner there on extension and contin- ues to thin at this smaller cross-section in successive extensions. Why this does not appear on the top can be explained by the preparation method. The sealant is smoothed on top by a spatula that leaves two slight depressions close to the interface (Figure 7b); they are scarcely visible at preparaton but deepen with exposure. These marks are unavoid- able. With two depressions on the sur-
Figures 5a (left) and 5b (right). Exposure past three winters, ? 35%. 5a: Figures 6a (left) and 6b (right). Exposure past three winters,
+
35%. 6a: south exposure, underside at preparation; 5b: north exposure, facing south exposure, top side at preparation; 6b: north exposure, facingFigures 7a (left) and 7b (right). Stage 1 of permanent deformation (exposure past one winter), north exposure, top at preparation. 7a:
+
45070; 7b:+
55%.face, the permanent deformation is di- bulges, with part of the sealant bead vided between them, and the surface folded under;
looks less disturbed than the other side. Stage 3 - smallest movement at For this reason only the undersides will and above which holes develop. be compared in the remaining part of After each winter and summer, the the discussion.
Establishing Stages of Permanent Deformation. The two-part polysulfide sealant underwent continuous change in appearance, attributable partly to ex- posure and partly to the imposed joint width changes ("movements"). Careful examination and photographic records showed that there are three recogniz- able stages in the changing appearance of the specimens:
Stage I - largest movement at and below which permanent deformation is negligible;
Stage 2 - formation of lengthwise
amount of movement for each stage was determined; it could be estimated within about a 5% step. For example, after three winters the greatest amount of movement without permanent defor- mation was
+
25070, as shown in Figures 3 and 4. At+
35% there was perma- nent deformation (Figures 5 and 6 ) , while at+
30% it was less well defined. The Stage 1 limit for two winters was+
3 0 % - + 35% (not shown); for one winter it was+
45%- k 50% (see Figure 7, where 7a is a specimen at its limit, and 7b is a specimen at the next higher movement). Figure 8. Stages of permanent de- formation o n vises.-
n-cycling r ack ma*l*F-.- .,, . .-
t
-
SCR 1-Stage.
, .
. . . . l l l . ~ y L l l l . ,.
-
=
w +90-
-
.ack-
E
2 8 0-
-
Y k 7 0-
E m s age L 2f
-t60-
-
E 3 3 %50-
-
r-
YB
I-
0 2 4 0-
E
0 k30-
-
r-
;,
t-20-
g + t o-
-
_I i 2 s of exoosureThe observed stages of permanent deformation are plotted as a function of number of winters of exposure on the rack (Figure 8). The number of winters is used in plotting because permanent deformations occur then.
As the amplitude of the yearly move- ment increases, Stage 2 of the progres- sive permanent deformation occurs, consisting of bulges and a thinned por- tion of material folded under the bulges. Photographs of specimens that have reached Stage 2 after one, two, and three winters on the exposure rack are shown in Figures 9, 10, and 11, re- spectively. The folds are usually single, but in some cases are multiple, as in Figure l l a . A single bulge is shown in Figure I l b , while l l c shows the oppo- site side of the same specimen with the thinned section protruding. The range of movement in which Stage 2 is reached can be seen in Figure 8. With movements between the two stages, the depression increases (as in Figures 5a and 5b), but there is no folding under.
Progress of Deformation with Expo- sure. Permanent deformation develops mainly in winter, when the sealant bead is extended and the surface curves in- ward. Stress is concentrated at the thin- nest cross-section, the bonds in the ma- terial relax, and deformation becomes permanent. In subsequent winters the thinning continues at the already de- creased cross-section.
The progress of permanent deforma- tion during exposure can be followed on a specimen subjected to
+
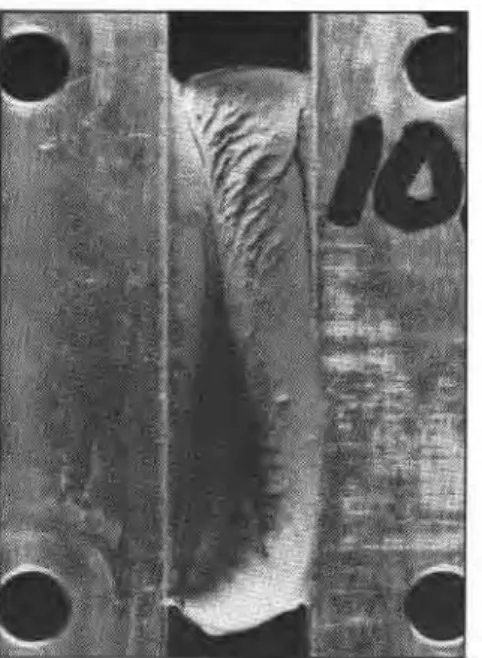
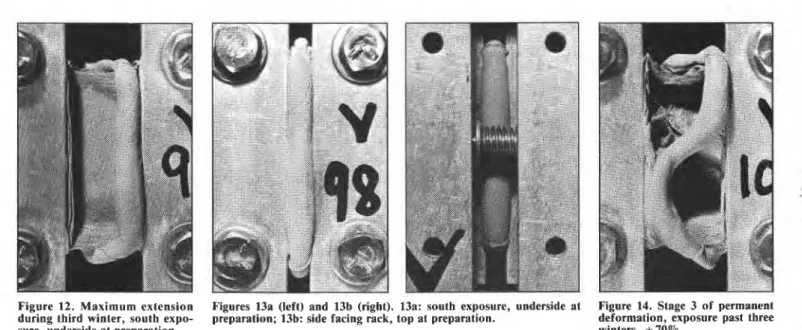
55% move- ment. When the horizontal line corre- sponding to this movement is followed from left to right in Figure 8, one can see that the specimen is just above Stage 1 after the first winter; i.e., permanent deformation has just started, as illus- trated by Figure 8b. (This is the top of the specimen; the underside showed no change at that time.) As the horizontal line is followed, Stage 2 is reached at its lower limit (point A in Figure 8); the corresponding specimen is shown in Figure 10 (at intermediate extension). After the third winter the specimen is at the upper limit of Stage 2 (point B) and is shown in Figure 11 (b and c), front and back (at original width). The same specimen is at maximum extension dur- ing the third winter (Figure 12). Com- parison with the previous figures shows that the sealant bead folds along the thinner section as the joint width di- minishes and the bulge protrudes on one side (Figure llb); the thin section does the same on the other side (Figure llc). On compression, this process continues and the groove disappears (Figure 13a and 13b).For Stage 3 (hole formation) there was only one occurrance after the third winter for specimens at
+
70% (Figure 14) movement. Stage 3 is represented by an asterisk in Figure 8.Possible Variations with Experimen-
tal Conditions. Mathematical equations
can be fitted to the movements at which Stages 1 and 2 occur; the lines shown in Figure 8 are for the calculated best fit. Changes in operator, batch, curing, formulation, or any experimental con- dition will cause variations in results, but the uncertainty caused by different operators can be reduced if the photo- graphs are used in evaluation. Tensile tests were carried out t o discover whether a difference exists between batches or between specimens cured differently. A slight change in the for- mulation may change the position of the curves (Figure 8), while a substantial change could lead to a harder type of product where permanent deformation would not appear but failure might oc- cur either adhesively or cohesively in the product.
Tensile Testing. In the previous
study(l), the modulus increased contin- uously with time (i.e., the material hardened), but specimens exposed only to weather hardened less than speci- mens aged in the laboratory, and those subjected t o cyclic movement on a strain-cycling rack hardened even less. These results were derived from four different extension rates. Figure 15 shows the results at an extension rate of 0.50 cm/min for a strain-cycling rack, a rack without movement, and laboratory specimens. In the present work, the vises instead of the strain-cycling rack produced cycling, and the tensile results are shown in continuous lines labeled V.
Although the previous and the present experiments are for different batches and curing conditions and, therefore, produce curves at different levels, they show the same trend: softening of the sealant by exposure and further soften- ing by cycling. Furthermore, the soft- ening was slightly greater in the vises, with increased amplitude of movement. The conclusion is that the cycles im- posed manually on the sealant can pro-
Figures l l a (left), l l b (center), and l l c (right). at preparation, f 50%; l l b : south exposure, ur
duce an effect similar t o that of the simulated joint movement cycles of the strain cycling rack.
Strain-Cycling Rack Exposures. As
reported earlier(l), the %-in.-wide spec- imens were exposed on the strain-cy- cling rack in the fall at the yearly aver- age temperature. The movements on the rack ranged from
+
14%- & 30% yearly. In Stages 1 and 2, permanent deforma- tion also was observed, occurring at+
16% and*
30% yearly movements, respectively, the latter shown in Figure16. This behavior is similar to that illus- trated in Figure 11 a t
+
50% move- ment. Stages 1 and 2 on the strain-cy- cling rack are located approximately in Figure 8, represented by a sinusoidal line marked SCR 1 and SCR 2, respec- tively, at the approximate time in which they occurred. They develop at lower movements than in specimens exposed on vises. This is understandable when it is recalled that every day the specimens undergo a cyclic movement that is about one fifth of the yearly movement. Be- cause the permanent deformations aremation (exposure past one winter); south ex- posure, underside at preparation,
+
65%. Figure 10 (above). Stage 2 of permanent de- formation,+
55% movement (exposure past two winters); south exposure, underside at preparation extended % of k 55%.cumulative, the same degree of defor- mation occurs at lower annual move- ments.
Conclusion
It is possible to produce with hand- operated vises the same permanent de- formation of sealant specimens that oc- curs on the strain-cycling rack. This has been illustrated by defining stages of deformation and documenting them photographically. Complete failure, i.e. perforation, was obtained only on the vises because of the limitations of ex- posure time and of yearly movement of
+
30% on the rack, but there is no rea- son to assume that it would not follow the same pattern as was observed with the vises provided the experiments were pursued long enough for both methods or the movement capability of the rack were extended.Extrapolation of the vise results is very tempting. The number of years necessary to reach the different stages at
+
25% yearly movement, the recom-Stage 2 of permanent deformation (exposure past three winters). l l a : south exposure, underside lderside at preparation,
+
55%; l l c : side facing rack, top at preparation,+
55%.Figure 12. Maximum extension Figures 13a (left) and 13b (right). 13a: south exposure, underside at Figure 14. Stage 3 of permanent during third winter, south expo- preparation; 13b: side facing rack, top at preparation. deformation, exposure past three
sure, underside at preparation. winters.
+
70%.mended minimum range for the sealant, could be estimated on that basis, but there is no supporting evidence of the validity of this approach, and it might take 10 years or more to provide it.
The results show that the vises can replace the strain-cycling rack that imi- tates the performance of sealants in building joints. This work is therefore a step forward in establishing a link be- tween outdoor performance and labo- ratory tests of sealants, since the vises can be used in the laboratory, with some changes in the conditions im- posed. It establishes three stages of per- manent deformation for one make of two-part polysulfide sealant and pro- vides photographs as a guide t o the process. This can form the basis of an evaluation of sealants of any chemical
type provided that deterioration occurs by a similar process of permanent de- formation. In fact, tensile tests cannot give much information on this type of failure because they can be made only on specimens that have not undergone permanent deformation. The role of the tensile tests here was simply to confirm that the same phenomenon occurs for vises and strain-cycling racks; in both cases the movement softened the speci- mens. This evaluation does not apply to polysulfide sealants that are hard and fail by adhesion or cohesion.
Acknowledgement
The author wishes to thank R.C. See- ley for experimental assistance. This paper is a contribution from the Divi-
a
s U) Q-
UI UI F-
1
V) posure without movinstant temperature .aln+cycling exposur -" 600 4 xlension
sion of Building Research, National Re- search Council of Canada, and is sub- mitted with the approval of the director of the division.
References
(1) Karpati, K.K. Investigation of fac- tors influencing outdoor perfor- mance of two-part polysulfide seal- ants. To be published.
(2) Karpati, K.K. 1978. Device for
weathering sealants undergoing cyclic movements. In Journal o f Coatings Technology, Vol. 50, No.
641, p. 27.
(3) Karpati, K.K.; Solvason, K.R.; and Sereda, P. J. 1977. Weathering rack for sealants. In Journal of Coatings Technology, Vol. 49, No. 626, p. 44.
Figures 16a (left) and 16b (right). Three-year exposure on strain- cycling rack at *30% maximum yearly movement. 16a: south Figure 15. Tensile tests after various types of weathering (0.50 cm/min, exposure, top at preparation; 16b: north exposure, underside at
T h i s p a p e r ,
w h i l e b e i n g d i s t r i b u t e d i n
r e p r i n t form by t h e D i v i s i o n of B u i l d i n g
R e s e a r c h ,
remains
t h e c o p y r i g h t of
t h e
o r i g i n a l p u b l i s h e r .
It s h o u l d n o t be
r e p r o d u c e d i n whole o r i n p a r t w i t h o u t t h e
p e r m i s s i o n of t h e p u b l i s h e r .
Al i s t of a l l p u b l i c a t i o n s a v a i l a b l e from
t h e D i v i s i o n may be o b t a i n e d by w r i t i n g t o
t h e P u b l i c a t i o n s S e c t i o n , D i v i s i o n of
B u i l d i n g
R e s e a r c h ,
N a t i o n a l
R e s e a r c h
C o u n c i l
of
C a n a d a ,
O t t a w a ,
O n t a r i o ,
KIA
OR6.
C e