1 Closing the Food Access Gap in American Underserved Communities
by Jamal Taylor
Bachelor of Science in Economics and
Luiz Paulo Silva Barreto
M.B.A in Finances and International Relations
SUBMITTED TO THE PROGRAM IN SUPPLY CHAIN MANAGEMENT IN PARTIAL FULFILLMENT OF THE REQUIREMENTS FOR THE DEGREE OF MASTER OF APPLIED SCIENCE OR MASTER OF ENGINEERING IN SUPPLY CHAIN
MANAGEMENT AT THE
MASSACHUSETTS INSTITUTE OF TECHNOLOGY May 2020
© 2020 Jamal Taylor and Luiz Paulo Silva Barreto. All rights reserved.
The authors hereby grant to MIT permission to reproduce and to distribute publicly paper and electronic
copies of this capstone document in whole or in part in any medium now known or hereafter created.
Signature of Author: ____________________________________________________________________ Department of Supply Chain Management
May 1, 2020 Signature of Author: ____________________________________________________________________ Department of Supply Chain Management
May 1, 2020 Certified by: __________________________________________________________________________ Dr. Christopher Mejia Argueta Director, MIT SCALE Latin America Network, and founder of the MIT Food and Retail Lab Capstone Advisor Accepted by: __________________________________________________________________________
Prof. Yossi Sheffi Director, Center for Transportation and Logistics Elisha Gray II Professor of Engineering Systems Professor, Civil and Environmental Engineering
2 Closing the Food Access Gap in American Underserved Communities
By
Luiz Paulo Silva Barreto And
Jamal Taylor
Submitted to the Program in Supply Chain Management on May 8, 2020 in Partial Fulfillment of the
Requirements for the Degree of Master of Applied Science or Master of Engineering in Supply Chain Management
ABSTRACT
Malnutrition is a global issue that affects millions of people across the world. Malnutrition is not just the lack of food, but also consists of the overabundance of unhealthy food due to a lack of healthy food. This instance of malnutrition is particularly troublesome for cities in the United States. In the U.S., there are many people who simply do not have access to healthy food options. Many of these individuals live in “food-deserts” or areas where no grocery stores that sell fresh produce exist within a 1-mile radius. In low-income areas where many people do not have access to a car, residents of food-deserts may have no way of accessing healthy food options. One way to combat the problem of food-deserts is to supply these areas with healthy food options. This research is centered on answering two research questions: 1) What food supply chain model (grocery delivery, rideshare, veggie-box) would residents of low-income areas prefer? 2) What is the feasibility of implementing this food supply chain model to increase healthy foods in low-income areas? This research was conducted by surveying residents of Somerville, MA, and also interviewing stakeholders within the potential supply chain for sourcing food-desert neighborhoods with fresh produce. These data were analyzed using a series of logistic regressions, which resulted in 82.7%, 75.2%, and 89.5% prediction power for the rideshare, grocery delivery, and veggie box supply chain models, respectively. The research shows that residents preferred the veggie-box model and that this model was also feasible in supplying neighborhood markets within food-deserts with fresh produce.
Capstone Advisor: Dr. Christopher Mejia Argueta
3 AKNOWLEDGEMENTS
This semester on MIT’s campus has been life-altering. I have learned a tremendous amount about supply chain management as well as the global systems that operate in each of our lives. I want to thank our advisor, Dr. Christopher Mejia Argueta, who has been an inspiration to me. He exemplifies how research can touch lives – not just in academia, but also for everyday people. I also want to thank my mother and father, Angela and Stephen Taylor, who have taught me to focus on continual achievement throughout my life and who, from an early age, helped shape my political views and my drive to work for all people who live in circumstances not conducive to a healthy and free life. My passion for this project was spurred by my mentor Kamau Franklin who initiated work to create institutions that provide healthy food and sustainable economic systems for residents in my neighborhood, Pittsburgh, Atlanta. Thank you for putting theory into action.
Jamal Taylor, MIT SCM Class of 2020 There are no words to describe how grateful I am for this amazing journey in the past 10 months. Dr. Josue Velázquez, CTL staff, and Dr. Christopher Mejia Argueta will always be in my heart for giving me this opportunity of studying at MIT. I also would like to express my gratitude to Wenfei Xu, my wife, who gave up her life in China to support me in my goals; to Rodrigo Barreto, my brother, who leads by being an epitome of passion for and dedication to academia; and Francisco and Cleuse Barreto who showed me the path of studies and the opportunities hidden within it. Lastly, I would like to dedicate this accomplishment to my son, William Xu Barreto. Even though I was not present for the last 10 months due to my studies and responsibilities, I expect he will be able to understand how learning can be both enjoyable and powerful by revealing the bounds of our knowledge and providing the opportunity to overcome temporary limits.
4 TABLE OF CONTENTS ABSTRACT ... 2 AKNOWLEDGEMENTS... 3 LIST OF FIGURES ... 6 LIST OF TABLES ... 7 1. INTRODUCTION ... 8 2. LITERATURE REVIEW ... 12
2.1 Food malnutrition and vulnerable population trends ... 13
2.2 Ridesharing systems to combat food malnutrition ... 15
2.3 Grocery delivery via mobile, fresh trucks and Instacart ... 16
2.4 Short, local food supply chains and subscription-based models via neighborhood markets ... 19
3. DATA AND METHODOLOGY ... 26
3.1 Process and Stakeholder Mapping ... 26
3.2 Design of the Interview and Survey ... 27
3.3 Data Collection ... 28
3.4 Data Cleaning and Processing ... 30
3.5 Descriptive Analysis ... 32
3.6 Principal Component Analysis and Logistic Regression ... 32
4. RESULTS AND ANALYSIS ... 33
4.1 Descriptive Statistics ... 33
4.2 Cross-Analysis ... 36
4.3 Principal Component Analysis ... 37
4.4 Logistic Regression Model... 40
4.4.1 Adequacy of the Models ... 40
4.4.2 Explained Variation ... 41
4.4.4 Contribution and Significance of the Independent Variables ... 44
5. DISCUSSION ... 47
5.1 Survey Analysis... 47
6. CONCLUSIONS AND FUTURE WORK ... 58
REFERENCES ... 61
APPENDICES ... 66
APPENDIX 1 – SURVEY ... 66
5
APPENDIX 3 – LIST OF VARIABLES ... 68
APPENDIX 4 – IV1, IV43, AND LOW-COST RIDESHARING MODEL ... 69
APPENDIX 5 – IV1, IV43, AND LOW-COST DELIVERY MODEL ... 72
APPENDIX 6 – IV1, IV43, AND VEGGIE BOX MODEL ... 75
APPENDIX 8 – CORRELATION MATRIX ... 81
APPENDIX 9 – COMMUNALITIES... 84
APPENDIX 10 – TOTAL VARIANCE EXPLAINED ... 85
APPENDIX 11 – COMPONENT MATRIX ... 86
APPENDIX 12 – ROTATED COMPONENT MATRIX ... 88
APPENDIX 13 – LIST OF VARIABLES PER COMPONENT ... 90
APPENDIX 14 – COMPONENT TRANSFORMATION MATRIX ... 96
APPENDIX 15 –COMPONENT SCORE COEFFICIENT MATRIX ... 97
APPENDIX 16 – RIDESHARING MODEL LOGISTIC REGRESSION ... 99
APPENDIX 17 – GROCERY DELIVERY MODEL LOGISTIC REGRESSION ... 101
6 LIST OF FIGURES
Figure 1. Line graph showing the prevalence and number of the undernourished population from 2005 to 2018………...………..….…14 Figure 2. Line graph showing the trends in prevalence of food insecurity and very low food security in the US from 1995 to 2018...………15 Figure 3. Principal Component Analysis Scree Plot showing the number of principal component variables (x-axis) that should be used for analysis. ……...………...37
7 LIST OF TABLES
Table 1. Number of Shoppers by Frequency and Location………...…33
Table 2. Travel Time to a Grocery Store………...……...…33
Table 3. Possess Household Car………...………34
Table 4. Financial Concerns Around Food Security……….34
Table 5. Demographic Data: Age………...………...…..35
Table 6. Demographic Data: Gender………...……….35
Table 7. Demographic Data: Educational Level………...………...36
Table 8. Demographic Data: Race/Ethnicity……...………...36
Table 9. Top Five Components……...………...……...38
Table 10. Omnibus Tests of Model Coefficients…...………...40
Table 11. Hosmer and Lemeshow Goodness of Fit Test………...……...41
Table 12. Nagelkerke R2………...………...41
Table 13. Category Prediction of Low-Cost Ridesharing………...…..42
Table 14. Category Prediction of Low-Cost Grocery Delivery………..………..43
Table 15. Category Prediction of Veggie Box………..43
Table 16. Logistic Regression on Low-Cost Ridesharing………44
Table 17. Logistic Regression on Low-Cost Grocery Delivery………...45
8 1. INTRODUCTION
Malnutrition is a global problem that affects an estimated three billion people (FAO, 2016). Often, when people think about malnutrition they only consider individuals who do not consume enough food. However, malnutrition includes those who overconsume unhealthy foods as well. This side of malnutrition is particularly prevalent in populations across the world who do not have sufficient access to healthy food options. The United States is no exception, with 23.5 million residents living in food-deserts. A “food-desert” is a neighborhood located further than one mile away from a grocery store that sells fresh fruits and vegetables. Living in a food-desert is strongly correlated with malnutrition and diet-related health risks and diseases.
These adverse effects are compounded when the food-desert is also a low-income community. When this is the case, residents might not have access to reliable transportation and will therefore do the majority of their grocery shopping at local neighborhood markets with limited ability to source fresh produce. Without a car, this could mean the inconvenience of carrying groceries on a crowded bus or train, or the added expense of a taxi or rideshare service like Uber or Lyft. Alternatively, customers might opt into delivery services such as Instacart, Amazon Fresh, or Walmart Delivery service. However, each of these services come with an additional delivery fee that might be impractical for an already price-sensitive population. This research project will show that neighborhood markets are well positioned to meet the needs of underserved American communities by sourcing them with fresh produce.
This project will answer two main research questions:
1. Which food supply chain (grocery delivery, rideshare, veggie-box) model will residents of low-income areas prefer?
9 2. What is the feasibility of this food supply chain to increase healthy foods in
low-income areas?
Neighborhood markets seem to be well positioned to fulfill the need for fresh produce in their communities. The stores’ close proximity to their customer base is a strategic advantage over other means for consumers to get fruits and vegetables. Also, since many individuals in this demographic already purchase their groceries at convenience stores, sourcing these neighborhood markets with fresh produce allows customers to maintain their same shopping habits. Otherwise, customers might have to travel outside of their neighborhood to purchase fresh produce. From this research, it was found that 51.5% of those asked indicated that they shop at neighborhood markets at least once per month. Moreover, 34.2% of respondents shop at neighborhood markets frequently (2 – 3 times per month or more).
While neighborhood markets do have a competitive advantage due to their location, they still may have difficulty providing fresh produce for three main reasons. First, because these stores are very localized and serve a relatively small market, they might have difficulty purchasing fresh produce from typical suppliers (e.g., local farms) that have minimum order quantities that are much higher than local demand. Second, produce tends to have a relatively short shelf-life. Since the viability of these stores depends on slim profit margins, sourcing fresh produce that may expire before a customer’s purchase might not be worth the risk. Lastly, customer preference plays a role. Customers have historically bought certain (usually unhealthy) foods. Therefore, owners (often incorrectly) assume these are the only products their consumers want to purchase. This makes them skeptical that their customers will purchase fresh produce, even if it is offered. Again, due to tight profit margins, owners might prefer to continue selling goods that have historically sold best.
10 Despite these drawbacks, neighborhood markets have become an important part of millions of people’s shopping habits. Therefore, it is imperative to analyze the viability of utilizing these markets to expand health food options to under resourced communities that have historically been without.
This research is focused on the Somerville community, a Massachusetts suburb outside of Boston. In order to correctly frame this research, it is important to analyze the correlation between food-deserts and community health. Chen, Jaenicke, and Volpe (2016) studied over 38,651 individuals and 18,381 households in the U.S. to understand the associations between obesity and living in a food-desert. Their research identified a positive correlation between food-desert status and obesity at the neighborhood level. In a separate study, Somerville’s city government invested in an extensive research report, Community Food System Assessment (2018). This report outlined low-income areas, areas with a high population of racial and ethnic minorities, and areas in the city where English is not the most common language. This report then measured the distance from those areas to each food access point in the city. This project showed that, across the city, the majority of areas where Somerville residents had to walk more than 10 minutes to get to a full-service grocery store were areas where low-income residents were located.
Both of the aforementioned studies analyzed the problem of food-deserts from different perspectives. However, neither of these studies assessed the feasibility of using neighborhood markets, or “nanostores,” (Fransoo, Blanco, Mejia-Argueta, 2017) as a means to bring fresh produce closer to low-income communities in Somerville. This research will fill this gap by collecting primary data from surveys and interviews, assess consumer preferences in Somerville, and consult secondary data to verify the feasibility of nanostore supply chains that will promote healthy food access.
11 To answer the first research question, 17 interviews were conducted for each tier of the supply chain. The study sample of the interviews included wholesalers, farmers, farmer associations, and nanostores. Each interview consisted of four – six open-ended questions which aim not only at outlining the behaviors within each tier of the healthy food retail supply chain, but also how transactions between each tier occur. These questions helped identify key performance metrics which were used to assess the performance of the food supply chains and analyze whether each food access model could help combat malnutrition in underserved communities.
The second research question was answered by collecting 388 surveys from the Somerville residents. These surveys were translated into four languages (English, Spanish, Creole, Portuguese), and were designed to understand the preferences of Somerville residents and their likelihood of using each healthy retail option. This survey was segmented into seven sections: grocery shopping patterns, transport method to and from grocery store, rideshare and grocery delivery services, hypothetical options for getting groceries, farm veggie box (alternative option), grocery shopping budget, and demographics.
To analyze these data, advanced statistical modeling was applied to determine significant factors, differences and to rank food access models depending on customer’s profiles. First, a principal component analysis was taken, resulting in 29 components to be used for analysis. Then a preliminary cross analysis was conducted to spot any trends in the data. Interestingly, the cross analysis found that, among car owners, the higher the education level of those surveyed, the more they preferred the ride-sharing model. This was largely due to the manner in which the surveys were conducted (this is addressed further in section 5).
12 Nonetheless, the logistic regression the researchers conducted afterwards, showed that the veggie box was the preferred option among Somerville residents. It found six factors that lead to the preference of the veggie box model. These will be discussed further in the discussion section, Section 5.1. Lastly, interviews with wholesalers/distributers and farmers/farmer associations showed that the veggie box model is a feasible model to provide food deserts with fresh produce. Moreover, over 70 percent of survey respondents indicated that they prefer the veggie box model and, our logit model was able to describe 89.5 percent of this data.
Following this general overview will be a literature review (Section 2), outlining research that has already been performed surrounding the topic of food deserts and healthy food supply chains. Afterwards is an outline of the methodology (Section 3) used in performing this research. Following the methodology is the results section (Section 4) that shows what was found from the research. The discussion (Section 5) follows the methodology. In this section, the meaning of the results will be discussed. The last section is the conclusion (Section 6). This section will address any shortcomings of the current research and opportunities for further research.
2. LITERATURE REVIEW
The focus of this literature review was to investigate research on the availability, affordability, and accessibility of healthy food options in food-desert areas. To do this, the review targeted four different areas. First, it analyzed food malnutrition and vulnerable population trends in general. This explained why food-deserts were an issue and made clear the impact that they have. Second, the literature review focused on identifying what research has already been done on utilizing ride sharing systems to combat food malnutrition. This is one of the research areas of the project, as it is a proposed method of providing healthy food access to underserved communities. The focus of the third portion of the literature review is the grocery delivery model. This was the focus of the
13 third portion of the literature review. Finally, the main focus of the literature review analyzed the feasibility of sourcing neighborhood markets with healthy food and the local supply chains implications associated with this method. This is the primary focus of MIT’s portion of the capstone. Therefore, an extensive amount of research was allocated to this part of the project. In each of these sections, the researchers found related articles, compared and contrasted the methodologies used in those articles, analyzed the results from the experiments, and identified gaps in the research that might be filled through their own research.
2.1 Food malnutrition and vulnerable population trends
The World Health Organization (WHO, 2016) defines malnutrition as “deficiencies, excesses or imbalances in a person’s intake of energy and/or nutrients.” Individuals can fit this description by not only having enough to eat, but also by having too much of the wrong types of food (i.e. sugary sodas, candy, and consumer packaged goods that are high in calories, but low in nutrition value). Both of these forms of malnutrition may be consequences of food insecurity -- being without sufficient access to food in general or specifically healthy food options (USDA, 2019).
According to the Food and Agriculture Organization (FAO), the International Fund for Agricultural Development (IFAD), United Nations International Children’s Emergency Fund (UNICEF), World Food Program (WFP), and WHO (2019), food-insecurity can be measured in three severity levels: food security, moderate food insecurity, and severe food insecurity. These organizations use two key indicators from the Sustainable Development Goals (SDG) framework to monitor the predominance of undernourishment (PoU) and predominance of moderate or severe food insecurity. In sum, the first estimates the number of people that lack enough dietary energy
14 while the second estimates the number of people who do not have access to nutritious and sufficient food due to scarcity of resources.
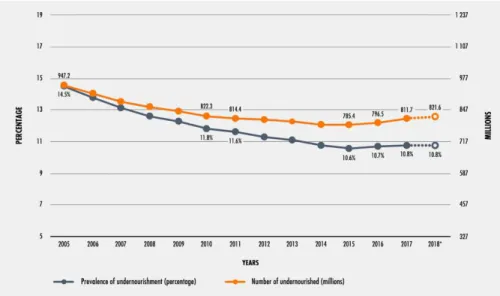
Figure 1 shows that while undernourishment on a global scale had been decreasing for years, that decrease stopped in 2015 and has been growing since. In terms of population, over 820 million people do not have access to food. This situation is similar to the one in 2010, showing no significant improvements regarding the problem.
Figure 1. Line graph showing the prevalence and number of the undernourished population from 2005 to 2018. “Food and Agriculture Organization of the United Nations (FAO), International Fund for Agricultural Development (IFAD), United Nations Children’s Fund (UNICEF), World Food Programme (WFP), & World Health Organization (WHO),” 2019. The state of food security and nutrition in the world. Safeguarding against economic slowdowns.
This problem is also true in the United States. Here, food insecurity has followed a negative trend since 2012 (Figure 2).
15 Figure 2. Line graph showing the trends in prevalence of food insecurity and very low food security in the US from 1995 to 2018. “USDA, Economic Research Service, using data from Current Population Survey Food Security Supplement.”
2.2 Ridesharing systems to combat food malnutrition
As mentioned in section 2, food accessibility is an important factor when considering food malnutrition. Access to healthy food is usually constrained by the socio-economic level of a population. Consequently, low-income areas have a higher probability of being food-deserts. These underserved populations might not have healthy options close to their home or work, nor a means of transportation to those grocery stores selling healthy food.
Allcott et al. (2017) studied the sources of “nutritional inequality” to understand the impact of income on eating habits in the United States. They investigated the behavior of low-income
16 populations in food-deserts by studying two factors: access to supermarkets and purchase patterns with local suppliers. As a result of their research, the findings showed that the mitigation of food-deserts does not significantly improve the eating habits of underserved population. However, subsidies for healthy foods provide a better outcome.
Recently, Uber and Lyft have been partnering with local governments and NGOs to complement their support to low-income families in food-deserts, providing rides to and from grocery stores. According to both companies, affordability and reliability of transport are likely to positively impact the lives of the population living in these areas (Uber Newsroom, 2019; Lyft Grocery Access, 2019).
While Allcott et al. (2017) argues that the lack of access to healthy options is not relevant in diminishing the problems associated with food-deserts, Uber and Lyft are still expanding their programs to several cities in the United States. However, there is no research investigating how ridesharing is able to give broader access to healthy foods for residents of food-deserts.
2.3 Grocery delivery via mobile, fresh trucks and Instacart
Another strategy for making healthy food accessible for food-desert residents is to utilize recently popularized, online grocery delivery services. In this case, patrons would place their grocery orders online, either through a third-party app (such as Instacart) or directly to a supermarket such as Walmart, Kroger, or BJ’s Wholesale Club. Since these stores have begun offering these services, they have promised to service a greater number of customers and match changing shopping habits (Bauerova, 2018). While this option might improve food access for many people, there are some barriers when considering low income populations that live in food-deserts.
17 The article Online Grocery Delivery (MMR, 2018) addresses the launch of online grocery delivery services for several grocery stores including Walmart, Kroger, and BJs. It specifically mentions some of the investments Walmart has made for the new service. In particular, Walmart has created a 3-week employer training module to support their employees in selecting high quality produce and meats to deliver to customers. They also address how Walmart will transfer the groceries to customers. Walmart plans to use crowd-sourced ride-sharing services such as Uber or Lyft for delivery. All of these changes result in an additional cost. In particular, Walmart’s delivery fee for these products is $11 with a minimum order amount of $30 worth of goods. This particularly high delivery fee might make it difficult for a lot of food-desert residents to utilize this service.
William Salter (2014) discussed how this issue of price sensitivity might be an issue for online grocery delivery in the United States. He found that the investment costs that US companies would have to make would be very large. Moreover, he showed how there is a shortage of drivers to transport the goods in the United States. Therefore, there will be a higher charge to transport groceries to households. This means that households that wish to utilize online grocery delivery will have to pay a premium to use this service.
This subject of delivery charge is particularly important. In Consumers' Decision-Making in Online Grocery Shopping: The Impact of Services Offered and Delivery Conditions, Bauerova (2018) discusses the most important factors to customers when shopping for groceries online. After interviewing 536 online grocery shoppers in the Czech Republic, Bauerova found that the most important factors to customers were delivery cost and the time it took to deliver the food. In fact, these were particularly sensitive factors. If the cost or the delivery time was too high, customers were deeply dissatisfied with the service. Other factors such as the minimum order amount required for delivery were not very significant in changing how customers interacted with the
18 grocery store. This further shows how customers tend to be particularly price sensitive when it comes to the cost for delivery. However, since minimum order quantity is not a sensitive factor, if the order quantity is increased further, companies might still be able to make a profit without charging such high delivery fees, comparatively.
Some companies have opted to utilize crowd-sourced ridesharing services for the delivery of their groceries. However, there might be an added difficulty to utilizing these services, particularly for many urban food-deserts. Ta, Esper, and Hofe (2018) used social identity theory as a premise to their research. Many crowd-sourced delivery services utilize identifiable information so the person receiving the delivery is aware of who is making the delivery. The hope is that this additional information will improve the customer experience. In Designing crowd sourced delivery systems: The effect of driver disclosure and ethnic similarity, Ta, Esper, and Hofe found that providing identifiable information about the driver making the deliveries only improves customer experience when the driver is similar to the person who placed the order. There was a particularly high correlation between customer satisfaction and the ethnicity of the driver -- if the driver and the customer had the same ethnicity, customer satisfaction increased. Otherwise, customer satisfaction decreases. These results align with many recent reports about racial discrimination for crowd-sourced delivery and rideshare services. This is important to consider for food-desert grocery delivery solutions, as many people in urban food-deserts are racial or ethnic minorities.
19 2.4 Short, local food supply chains and subscription-based models via neighborhood
markets
Another strategy to increase the amount of healthy foods available in food-deserts is to utilize the neighborhood markets that are already present. These are the locations where many food-desert residents, particularly low-income residents, tend to do the majority of their grocery shopping. This solution allows residents to continue their normal food shopping habits but provides them with more healthy options to choose from. The following sources provide an in-depth look at the research that has already been done, to assess the feasibility of this option from both the consumer perspective and the neighborhood markets’ perspective. First the various pieces of research conclude that many neighborhood corner stores do not currently offer enough healthy food options. The research then shows that residents in food-deserts have similar demand for healthy food options as do areas with access to healthy foods (food oases). Moreover, these residents tend to place a high value on having low prices and the quality of the food that they purchase in the corner stores. This provides some difficulty for neighborhood markets to source healthy food products at affordable prices. Many neighborhood markets fear that their current patrons will not purchase the healthy food options they provide. The research also assesses how advertising the availability of healthy food options at corner stores, as well as the accessibility of Supplemental Nutrition Assistance Program (SNAP) and Women Infants and Children (WIC) program benefits to offset the cost of food, affects consumer consumption of healthy products.
In Identifying Corner Stores as the Future of Healthy Food Access in African American Communities, Romano, Lee, Royal, Metzo, Ruth, & Hartsook (2017) performed some analyses on Mecklenberg County, North Carolina. They found that of the 230 census tracts in the county, 113 of them are without a full-service grocery store (defined as a grocery store providing fresh produce,
20 fresh meat, fresh dairy, and processed foods). Of those without a full-service grocery store, 37 census tracts contained a corner store. All of these census tracts were located in low-income, predominantly African-American communities. This information shows how, in many areas, low income and minority communities might particularly benefit from sourcing corner stores located in food-deserts with healthy foods. This study does not go into the methods for sourcing these corner stores, what difficulties the stores might have in selling this food, whether or not consumers will purchase these foods, or other analysis about how this phenomenon affects other racial and ethnic groups.
O’Malley, et. al. (2013) conducted some research specifically about increasing healthy food access in food-deserts in his article Feasibility of Increasing Access to Healthy Foods in Neighborhood Corner Stores. He described challenges for the corner store both from the sourcing side as well as from the demand side. The article discussed that produce wholesalers see little profitability in selling the relatively small amount of produce that corner stores would require for their customers. Corner store owners stated that customer demand, cost of produce, and in-store infrastructure were barriers for them to offer more healthy foods. Contrarily, however, customers indicated that they would purchase more fresh fruits and vegetables if those options were available in their local neighborhood corner store. The methods used to gather the data that show these results included 97 household interviews and 24-hour dietary recalls. Researchers also conducted interviews with 60 corner store customers and 12 corner store owners and/or managers. This data was collected in three New Orleans neighborhoods that did not contain a supermarket. This article did not test alternative methods for neighborhood markets to source produce and other healthy foods, outside of produce wholesalers. There was also no assessment of profitability for corner
21 stores sourcing and selling healthy foods. This would be helpful to assess the feasibility of using corner stores as a means of getting healthy food products into food-deserts.
In Access to Healthy Foods in Rural Minnesota: A Pilot Analysis of Corner Stores, Larson, Mullaney, Mwangi, Xiong, Zielgler, (2017) found that corner stores in Nicollet County, Minnesota tended not to offer a significant amount of healthy options. They came to this conclusion using the following methodology: First, they identified several corner stores that should be included in the study. Next, they selected several Auditors that would enter stores and collect data and trained them on what to look for and how to collect the data. The auditors then entered 24 different corner stores, asking questions about the quantity, quality, and cost of the healthy food options available in the stores. They also asked about the availability of SNAP and WIC and noted if/how stores advertised that they accept these benefits. All of these data were collected for analysis which lead to the aforementioned conclusion -- that corner stores in food-deserts do not provide a large enough quantity or variety of healthy foods for its customers. This study, however, did not provide a thorough analysis of what could be done to increase the availability, purchase, and consumption of healthy foods at neighborhood markets.
A different study in eastern North Carolina found “no significant associations between the healthfulness of food store offerings, customer purchases, or dietary consumption” (Pitts, 2017). The methodology used to come to this conclusion was as follows. The research surveyed 479 customers who shopped in at least one of 16 different corner stores. The survey asked questions about the customers’ demographics, food purchases, shopping patterns, and self-reported fruit, vegetable and soda consumption. After collecting this data, the researchers used Pearson’s correlation coefficients and adjusted linear regression analyses to asses if there was an association between healthy food offerings, customer purchases, and what customers eat. While the North
22 Carolina legislature did spend $250,000 to help corner stores provide healthier food and beverage options, there was no assessment of the store’s offerings. This study did not study the availability or quality of healthy foods offered in these stores. It also did not do an analysis on the price of these options and the price point customers needed to make the purchases. There was no analysis on how well the healthy food options were advertised or if SNAP or WIC benefits were offered to customers.
A separate study in New York found an increase in the purchase of healthy food items by changing specific corner store practice. In the research article Healthy Bodegas: Increasing and promoting Healthy Foods at Corner Stores in New York City, researchers found that corner stores were an effective and important method of providing access to healthy foods for people living in food-deserts (Dannefer, 2012). The research mentioned noticing “4 changes on a 15-point criteria scale.” The most common changes included placing refrigerated water at eye level so that it is one of the first beverage options consumers see, providing more SKUs of canned fruit that do not contain added sugar, offering healthy sandwich options, and being able to assist customers in identifying healthier food options. All of these changes resulted in a 5% to 16% increase in healthy food purchases among customers surveyed. These purchases include options that were specifically identified as being healthier options. This study shows that customers who might not know what healthier food options are would be more prone to purchasing healthier food options if that information was readily available. One gap in this study, however, is in identifying the best methods to introduce customers to which foods are healthy and which are unhealthy options.
Another research study by Larson C, et. al. (2013) attempted to identify if and why food-deserts struggled to provide healthy foods and why residents did not purchase the healthy food that was provided. Methods used to gather this research were as follows: The researcher selected five
23 corner stores located in food-deserts in Nashville, Tennessee. These areas were all low-income, but ethnically and racially diverse. From there, the researchers held community listening sessions where they collected data. They also collected data from proprietor surveys, store audits, and customer-intercept surveys. From analysis of this data, this research found that few stores offered healthy foods (specifically, fresh fruits, fresh vegetables, low-fat or non-fat milk, 100% whole-wheat bread) and none of the stores tested offered all four categories. This study centered on a community-oriented approach to addressing the food-desert problem. It did not, however, discuss steps corner stores could use in establishing more trust among residents, educating residents about what healthy food options were, or advertising healthy food options to increase sales for these items.
Mui, Lee, Adam, Kharmats, Budd, Nau, & Gittelsohn (2015) map the sources that many neighborhood markets use to purchase healthy and unhealthy foods to sell in their stores. In particular Healthy vs Unhealthy Suppliers in Food-desert Neighborhoods: A network analysis of corner stores’ Food Supplier Networks finds that both the unhealthy and healthy supplier networks that corner stores use are include wholesale clubs (i.e. Sam’s Club and Costco Wholesale). They also found that corner stores’ unhealthy supply networks include a variety of stores. This means that it is very easy for these stores to purchase unhealthy products for resale. Contrarily, the healthy supply networks are not as diverse. This is a barrier to sourcing more healthy foods. The research also showed that neighborhood store owners had a misconception about what foods their customers demanded. They were under the false impression that their customers did not have demand for healthy foods, when in fact, they did. The neighborhood markets tend to be family owned and rely on small margins in order to be successful. This article did not test ways for corner stores could source more healthy options, although it did suggest bulk joint ordering among several stores as a
24 possible, untested solution. This seems to be a viable option because corner stores in the same area tended to source products from the same places.
Another interesting piece of research analyzed store sales data specifically for corner stores that had been assisted by a corner store intervention program (a program that works with corner stores to help them provide healthy food options). In Exploring sales data during a healthy corner store intervention in Toronto: The Food Retail Environment Shaping Health (FRESH) project, Minaker, Lynch, Cook, & Mah, (2017) collected sales data on local corner stores. This data was aggregated by product category and by day. They then analyzed this data using t-tests to examine differences in peak vs non-peak sales days. They found that the peak sales days correlated with issuance of social assistance payments and with transit pass sales. Importantly, sales of fresh fruits and vegetables represented an increase in revenue on these days. This means that analyzing sales data is an important metric to consider when assessing the effectiveness of corner store intervention programs. It also shows that there is a correlation (even among healthy foods) among sales and social assistance program payments. This analysis does not directly test whether or not offering more social assistance programs in stores will cause more sales of healthy foods.
In Paluta, Kaiser, Huber-Krum, & Wheeler’s Evaluating the Impact of a healthy corner store initiative on food access domains (2019). They found that healthy corner store initiatives resulted in more patrons coming into corner stores, and more sales for healthier items. They reached this conclusion by evaluating Fresh Foods Here’s (a Healthy Corner Store Initiative) network in Columbus, Ohio. They collected data from invoices, inventories, rapid market assessments, and customer surveys. They analyzed this data to find changes in food access and corner store service. This paper does not do an analysis of the causes (i.e., advertising, SNAP/WIC benefits, methods for identifying healthy food options, etc.) that resulted in these positive results.
25 In order to combat food malnutrition and its current deterioration in recent years, academics have been researching different options to address this issue and provide a healthy life to every citizen independently of their family income. They have analyzed this situation through different approaches that can be segmented in ridesharing systems, grocery deliveries, and different uses of neighborhood markets. However, the feasibility analysis of these diverse strategies applied in a low-income area has not been explored until this moment, particularly in Somerville, MA. This is one way in which the authors of this research will fill a gap left in the research that is currently available.
Another gap that is being filled with this paper is an analysis of a supply chain model that could actually source food desert communities with fresh produce. This supply chain model considers the producers (farmers) all the way to the end consumer (Somerville residents). This paper also conducts a sophisticated statistical analysis of the diverse food access models that were proposed and assembled by the researchers, based on the literature review. This is yet another gap that this research fills. Lastly, for the first time, this research actually gauges the feasibility of several potential models and provides a method for determining the best one. These additions to the body of research already available will expand the knowledge of how to source residents of food desert communities.
The research for this paper first analyzes the key stakeholders of a food supply chain through open question interviews and, second, surveys the local population of Somerville to assess their preferences. Lastly, this research proposes a model to improve the current situation in the study area and assess the replicability of this model to other low-income areas.
26 3. DATA AND METHODOLOGY
In order to answer the two research questions (i.e., How feasible is each of the food supply chain models to increase healthy foods in low-income areas? Which food supply chain model will residents of low-income areas prefer?) the researchers took several steps. First, they engaged in a process and stakeholder mapping. This provided insight into the various stakeholders in each of the models. Second, the researchers designed the interview and survey questions. This process was done with great care to ensure the information needed would be provided and also to be sure that those being interviewed or taking the survey felt comfortable enough to give complete and honest answers. Afterwards, the data were collected by conducting interviews with each tier in the supply chain (farmers/farmer associations, wholesalers/distributers, neighborhood market owners and managers) and surveying the residents of Somerville, MA. Next, the data were cleaned and processed in order to prepare it for analysis. This provided the correct framework to do a descriptive analysis followed by more in-depth analyses of the data. After the descriptive analysis and cross-analysis, a principal component analysis and logistic regression were performed for further analysis.
3.1 Process and Stakeholder Mapping
The first step was to identify the processes for the neighborhood supply chain model, specifically the veggie box model. This would include the neighborhood market perceiving a demand for these veggie boxes and also receiving them at a price where they could be profitable. From the literature review, it was clear that wholesalers presented a barrier for neighborhood markets to receive produce. Therefore, it would be important to gauge this feasibility. Another option would be to see if farmers would be willing to sell directly to neighborhood markets.
27 From this reasoning it was clear there were four tiers of stakeholders whose preferences needed to be identified. Specifically, these stakeholders were the end consumers, the neighborhood market owners/mangers, the wholesalers/distributers, and the farmers/farmer associations. It was determined that the best way to get these answers would be to do field interviews with the neighborhood market mangers, wholesalers, distributers, farmers, and farmer associations. There are only a few of each of these and their preferences would be more or less similar, given that they are delivering services at a similar scale. In contrast, however, the end consumer preferences might differ greatly. Therefore, it was important to reach a large and diverse number of end consumers. The best method of getting this data would be from an online survey distributed by a trusted messenger. In this case, the trusted messenger was the Somerville city council.
3.2 Design of the Interview and Survey
The design of the interviews and surveys was extremely important. For the survey, it was important to capture three key aspects. First, the survey needed to capture the consumer preferences for the various methods of accessing healthy food. Second, the survey needed to capture the demographic information of each respondent. This would allow the researchers to see how these differences might impact consumer preferences. Lastly, the survey needed to capture the availability, affordability, and accessibility consumers had to fresh produce. The survey was translated into four different languages to ensure that everyone in the Somerville community would have access to the survey and the data collection would be more complete.
The interviews had a different objective. After observing the results of the consumer survey, we needed to see if it would be feasible for the upstream supply chain to meet their demands. These questions focused on the logistics of their operation, what their supply and demand looked like, what products they sold, whether a veggie box model would work for their
28 business, and whether or not they had interest in serving low-income communities. All of these questions were specifically chosen to get insights into the feasibility of implementing the veggie-box supply chain model in food-deserts in Somerville, MA.
3.3 Data Collection
The data collection was carried out in two different ways: 1) The researchers partnered with the city of Somerville to distribute the survey to residents of Somerville (i.e., the end consumers), and 2) The researchers interviewed 17 different stakeholders in the various supply chain models. These interviews included wholesalers/distributors, farmers/farmer associations, ridesharing systems, grocery delivery services, and neighborhood markets. For the veggie box model, the focus of this research, the research included 388 surveys, four interviews of farmers/farmer associations, one interview with a wholesaler/distributor, and five interviews with neighborhood markets. While there were only four interviews from farmers/farmer associations, the farmer associations are able to speak on behalf of each of the farmers that they work with. This provides insights into how several farmers would utilize the models, even if it consisted of just one interview.
Specifically, the farmers’ associations interviewed worked with 44 large scale/business level farms as well as 473 smaller scale farms. The interview with the wholesaler/distributer provided a lot of information. However, only one company in this category was interviewed due to the difficulty of contacting wholesalers and distributers. The five interviews with corner stores were representative. These interviews were in different locations in the city, serving different segments of the populations, and had different scope of products served (including produce). The
29 researchers felt confident that this number of interviews captured provided a lot of useful information for the research.
These surveys were administered in random locations across the city including senior centers and other shelters, however, 70% of the surveys were collected in supermarkets across Somerville. There was also an incentive provided to survey takers. They would be entered into a drawing for a gift certificate if they decided to take the survey. The survey included 41 questions segmented in seven categories addressing grocery shopping patterns, transport method to and from grocery store, rideshare and grocery delivery services, hypothetical options for getting groceries, farm veggie box (alternative option), grocery shopping budget, and demographics (Appendix 1). There were 388 responses to the survey from Somerville residents.
The interviews were obtained by phone for wholesalers, distributers, farmers and farmer associations. They were standardized in that each of the questions listed in the Appendix 2 were asked. However, if the interviewee provided extra information, that information was recorded as well. These individuals were not offered any incentive to engage in the interview.
The managers/owners of the neighborhood markets were interviewed at their own stores. This allowed the researchers to see the store in person, identify if they provided fresh produce and what quantity was available in the store. By doing in-person interviews, the researchers were also able to analyze the layout of the store, observe the in-store operations, and identify the most frequently bought products. These interviews were not easy to obtain for several reasons. First, it was important for the researchers to speak with the manager or person who is responsible for the store operations in order to get accurate answers to the survey questions. In many nanostores, this person does not always come into the store to work every day.
30 Another barrier is trust. Store managers might not be very eager to provide intimate details about their store operations for fear that a competitor will utilize this information against them. Lastly, many of the store owners were most comfortable speaking in languages other than English. Even with all of these barriers, the researchers were able to still obtain 17 interviews by building trust and rapport with the store owners and ensuring that the purpose of the questions were purely for research purposes. This assisted in the analysis of the feasibility of the veggie box model. These questions, which are listed in Appendix 2, were also standardized and the questions were listed in the Appendix 2. Upon completion of the interview, the manager was offered a $100 gift certificate as a thank you for their time.
Each of these interviews gave the researchers a plethora of information. Those who were interviewed provided first-hand knowledge from their experiences. Their insight indicated what supply chain models would be feasible for their business and which models would not work. All of this information helped the researchers answer the first research question: What is the feasibility of each food supply chain (grocery delivery, rideshare, veggie-box) to increase healthy foods in low-income areas?
3.4 Data Cleaning and Processing
The data cleaning step was particularly important. The survey included 41 questions, many of which offered the respondent the ability to select multiple answers. Moreover, the researchers received 388 responses. This created a lot of data to analyze. Inevitably, some of the responses were incomplete and needed to be cleaned. This cleaning included removing blank responses, combining questions that provided similar information, questions, and deleting questions that were unnecessary for this portion of the research project.
31 The researchers took a systematic approach to identifying which questions were pertinent and which could be vetted. First, they removed blank questions. Then, they removed questions that were duplicates, or that provided similar pertinent information. To decide which information was pertinent, the researchers considered what information was directly related to the research question this survey sought to answer (i.e., Which food supply chain model would residents of low-income areas prefer?). All demographic information was retained since this would be important for the descriptive analysis. All free response questions were removed since these would be too difficult to analyze in a quantitative manner. Sometimes questions were elongated, with more answers than what were necessary for the research, simply to ensure that the respondent could answer the question with confidence.
For example, question 10 of the survey asked “Most of the time, what transportation do you use to get to the store when you buy your groceries?” The responses to this question included Walk, Bus, The T, Bike, Household car, taxi, Lyft or Uber, Borrow a car from a friend/family member, Drive with a friend/family member, The RIDE, motorized chair, and other. The only information the researchers needed from this question was to 1) gain an understanding of which means of transportation residents typically use or have access to in order to get their groceries and 2) how would each transportation type fit within the three proposed grocery supply chain model.
Since this information is all the researchers really needed, they narrowed their answers into simpler categories. 1) Public transportation such as the T, the RIDE, and bus 2) Self-transportation without a vehicle, including Walk, Bike, and Motorized Chair 3) Ridesharing Services like Taxi, Lyft or Uber and 4) Personal automobile including utilizing a household car or driving with/borrowing a car from a friend or family member.
32 If these categories were grouped together initially in the survey, it might confuse the respondents. However, if the responses remained disaggregated there would be many more factors to analyze, unnecessarily complicating the data analysis without providing any additional useful information.
3.5 Descriptive Analysis
It was also important for the researchers to get some descriptive statistics for the survey conducted. There were two pieces of data used for the descriptive analysis. The first was simply the entire dataset. This gave the researchers insights into the breadth of the data and the baseline information about Somerville. The second was a subset of the dataset. This research was focused on the neighborhood markets. Therefore, the second descriptive analysis specifically targeted survey respondents who indicated that they visited neighborhood markets to do their shopping 2 – 3 times per month or more. The researchers are particularly interested in the behaviors of people who shop in neighborhood markets often enough to use the veggie box model, so it was important to take a special look at the demographics of this group.
3.6 Principal Component Analysis and Logistic Regression
Due to the nature of the survey, there were a lot of variables to be analyzed. Since many of the questions were multiple choice “select all that apply” questions, one question could result in dozens of variables. There were 225 total variables in the raw data from the survey. This is too much information to do sophisticated analyses. Furthermore, the researchers needed to find a way to pull out the important information from the variables collected in the survey. The researchers did this by conducting a principal component analysis (PCA) in order to reduce dimensionality and to model unsupervised data that came without corresponding responses. Its goal is to find patterns and structure in the data. After identifying the principal components, the researchers could
33 perform a logistic regression on the data. The PCA brought out the relationships between the survey questions/responses and the relevant pieces of this entire dataset. This helped the researchers answer the second research question: Which food supply chain model will residents of low-income areas prefer?
4. RESULTS AND ANALYSIS
4.1 Descriptive Statistics
Table 1 shows the shopping habits of the survey respondents. Of the respondents, 51.5% indicated that they shop at Neighborhood Markets at least once per month. Moreover, 34.2% of respondents shop at neighborhood markets frequently (2 – 3 times per month or more).
Table 1. Number of Shoppers by Frequency and Location
Never < 1x a month 1x a month 2-3x a month Once a week +2 times a week Daily Neighborhood Markets 33.8% 14.7% 17.3% 14.3% 9.8% 7.1% 3.0% Grocery Stores 13.2% 0.4% 1.9% 3.4% 12.0% 40.6% 27.4% Others 35.7% 11.3% 19.2% 16.9% 12.4% 4.1% 0.4%
Table 2 shows the travel time to the grocery store below. It shows that 44.7% of the survey respondents have more than an 11-minutes commute to their closest grocery store.
Table 2. Travel Time to a Grocery Store
Time Percentage 0-10 minutes 55.3% 11-20 minutes 36.8% 21-30 minutes 5.6% 31-40 minutes 1.5% 40 minutes or more 0.8%
34 Moreover, 22.2% of the respondents also do not have access to a household car.
Table 3. Possess Household Car
Car Ownership Percentage
Yes 77.4%
No 22.2%
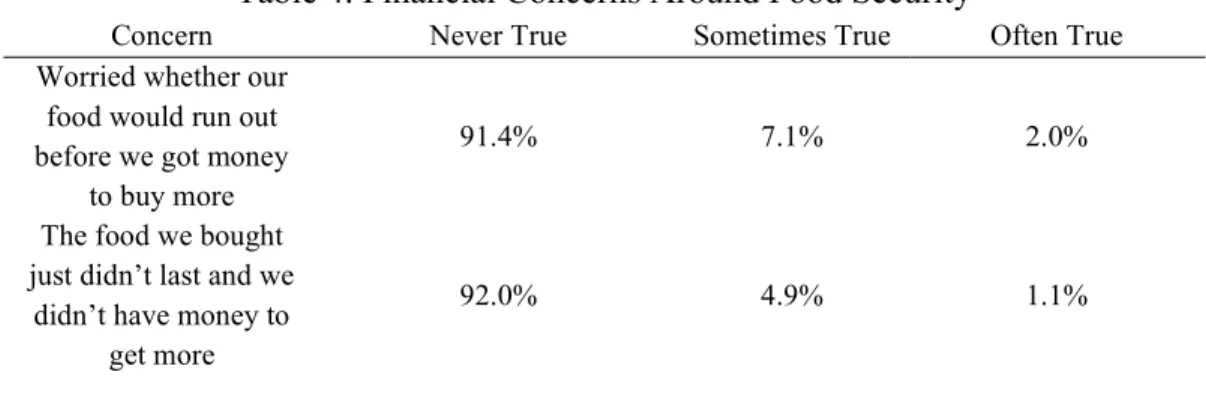
The survey asked if people have had concerns about not having enough money to buy food. This was broken into two questions: first, how often residents had been worried whether their food would run out before they received money to buy more; and second how often the food they bought did not last and they did not have money to get more. The results of these questions are below in Table 4, which shows that 8.6% of respondents have worried about running out of food, and 6.0% of respondents have actually run out of food before having money to buy more.
Table 4. Financial Concerns Around Food Security
Concern Never True Sometimes True Often True
Worried whether our food would run out before we got money
to buy more
91.4% 7.1% 2.0%
The food we bought just didn’t last and we
didn’t have money to get more
92.0% 4.9% 1.1%
The survey also captured a lot of demographic data. This ensured the researchers would know the groups of people that they were surveying and identify the most affected population groups. The data show that those surveyed were overwhelmingly women (Table 6, 72.2%). They also tended to be young and middle-aged adults (Table 5, 78.6% of those surveyed were between 23 and 4 years old). Also, from Table 7, 61.7% of those surveyed had a master’s degree or higher and 30.5% had a college degree. Lastly, Table 8 shows that 79 % of those surveyed were White (not Hispanic).
35 Table 5. Demographic Data: Age
Age Percentage Under 23 1.5% 23-38 46.8% 39-54 32% 55-73 16.2% 74-91 3.8%
Table 6. Demographic Data: Gender
Gender Percentage
Male 22.2%
Female 72.2%
Non-Binary 2.3%
Prefer not to answer 3.4%
Table 7. Demographic Data: Educational Level
Education level Percentage Less than High School 0.4% High School Diploma or
GED 2.6%
Some College 4.9%
College Degree 30.5% Master’s Degree or Higher 61.7%
Table 8. Demographic Data: Race/Ethnicity
Education level Percentage
Asian 5.6%
White 79%
Hispanic 2.7%
Black or African American 1.9%
Other 11.0%
The sample of this research is predominant female, white, 23-54 years old, high level education, and owns car. Besides this, the respondents shop groceries in grocery stores more frequently than any other option. To have a better understanding about the characteristics of the respondents and their preferences, a cross-analysis was performed in the next section of the aforementioned variables that are directly related to the research questions.
36 4.2 Cross-Analysis
As mentioned in the literature review (section 2), there are three main factors that are the core problem of malnutrition: accessibility, affordability, and availability. Additionally, studies mentioned in the same section also highlighted constraints regarding the access to healthy foods and how it modifies the consumer patterns. Considering the objective of this research project, a cross-analysis of commute time and shopping frequency with a layer of adopting a specific food supply chain model was performed (Appendix 4, 5, and 6). This cross-analysis provided an initial understanding of the relationship between the variables related to this sample and the studies mentioned in the section 2.
This preliminary analysis showed that consumers who have a shorter commute and shop frequently in grocery stores are less likely to accept low-cost ride sharing and grocery delivery solutions while the result is the opposite for the veggie box model based on the proportion of cases within three variables and as showed on Appendix 4, 5, and 6.
Another interesting insight from the cross-analysis was the relationship of using ridesharing services even though the respondents own a car. As mentioned in the previous section, over 92% of the sample have a college degree or a higher degree and over 70% of the respondents with this education level own a car, but they prefer to use ridesharing services. The results of this exploratory analysis led the researchers to investigate in the next sections if the preference for a low-cost ridesharing model would prevail over other models.
Since there are differing results for each of the food supply chain models, and due to the quantity of variables available to research consumer preferences and each model’s feasibility, the application of principal component analysis is necessary to filter out variables that do not explain the variability of the results in a large proportion or are irrelevant.
37 4.3 Principal Component Analysis
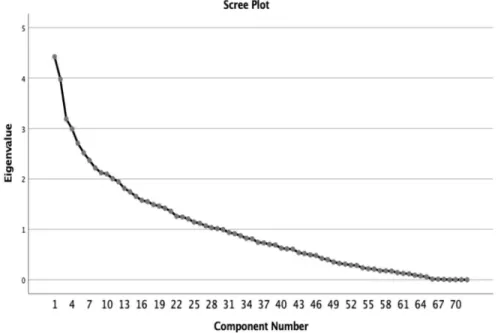
A principal component analysis (PCA) was performed on the 72 independent variables generated from the survey applied in Somerville, MA. Due to the quantity of variables, the visual inspection of the scree plot below (Figure 3) was not helpful for indicating the quantity of variables to be retained.
Figure 3. Principal Component Analysis Scree Plot showing the number of principal component variables (x-axis) that should be used for analysis.
Based on this situation, the components with eigenvalues greater than one were selected through PCA, as these were the components that described the majority of the data. As a result, 29 components explained over 77.35% of the total variance (Appendix 10). The first five components consist of a set of variables that helps most to explain the variability of the models. As it can be seen below, transport methods (component 1, 2, and 5), age (component 3), grocery shopping for members of family with a specific age (component 3 and 4); and commute time, concerns about not having food and money, and educational level (component 4) are the main elements.
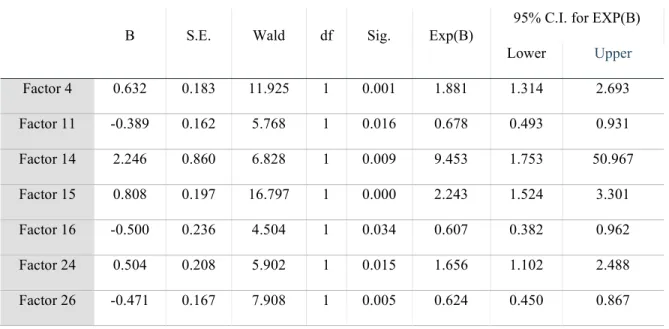
38 The survey had a higher representation of respondents between the ages of 23 and 54 years old (Table 6), females (Table 7), and a high-level of education (Table 8). The principal component analysis corroborates the findings of the descriptive analysis section, as these variables are also included in the top 5 PCA components. Additionally, the transport methods variable listed as part of components 1, 2, and 5 is indirectly related to the commute time of the respondent, a variable that considerably affected the likelihood of using a food supply chain model as shown in the cross-analysis section. The logistic regression model was able to dictate the level and direction of the influence of each component on the dependent variable. For instance, analyzing the variables individually of the component 1 shows that walking from and to a store may favor the adoption of a food supply chain model if the component has an Exp (B)1 over 1.0 in the logistic regression analysis (Section 4.4.4).
1 Exp(B) communicate the changes in the odds for each increase or decrease per unit of the independent variable. Values lower than 1 result in a decrease while values above 1 mean an increase.
39 Table 9. Top Five Components
Component Survey Question Name Variable
Code Strength
1 Q10 Walk IV13 0.922
1 Q10 Walk and Vehicle IV18 -0.396
1 Q10 Vehicle IV23 -0.333
1 Q12 Walk IV27 0.895
1 Q12 Walk and Vehicle IV34 -0.386
1 Q12 Vehicle IV40 -0.358
1 Q18 Household Car IV51 -0.478
2 Q10 Walk and Vehicle IV18 0.807
2 Q10 Vehicle IV23 -0.845
2 Q12 Walk and Vehicle IV34 0.806
2 Q12 Vehicle IV40 -0.838
3 Q28 Selection of Vegetables by Someone IV56 0.387
3 Q36 Grocery for 19-60 years old IV67 0.682
3 Q36 Grocery for over 60 years old IV68 -0.879
3 Q39 Age IV69 -0.769
4 Q13 Commute IV43 0.330
4 Q33 Food Run Out IV63 0.867
4 Q33 No Money and No Food IV64 0.858
4 Q36 Grocery for 6 to 18 years old IV66 0.430
4 Q40 Educational Level IV71 -0.381
5 Q8 Other Location for Grocery IV12 0.625
5 Q10 Walk, Bike and Vehicle IV25 0.952
5 Q12 Walk, Bike and Vehicle IV42 0.952
The correlation matrix, communalities, component matrix, rotated component matrix, component transformation, and component score coefficient may be found in the Appendices 8, 9, 11, 12, 14, and 15. The usefulness of correlation matrix when performing a PCA is related to the approach of taking standardized form of the inputs, eliminating any risk of using variables with different scales. The communalities table represents the proportion of common variance originated from a particular variable and goes from 0 to 1 (FIELD, 2013).
40 The component matrix represents the strength of the correlation of specific variables with a component. The rotated component matrix is the result of the rotation of the frame of reference with the purpose of maximalization of the dimensions while the component transformation matrix shows the correlations before and after the rotation, highlighting the improvement. Lastly, the component score is calculated from the multiplication between the standardized values and the component score coefficients. The results of this multiplication were added to the dataset in order to be served as an input for the logistic regression.
4.4 Logistic Regression Model
With the number of dimensions reduced through the previous analysis, a binomial logistic regression was applied for each food supply chain model as a dependent variable and the 29 components extracted from the PCA. To better understand the results, this analysis is segmented in four subsections: adequacy of the models, explained variation, category prediction, and contribution and significance of each independent variable to the model. Additionally, each principal component was categorized based on the variables with a correlation stronger than 0.3 (Appendix 13).
4.4.1 Adequacy of the Models
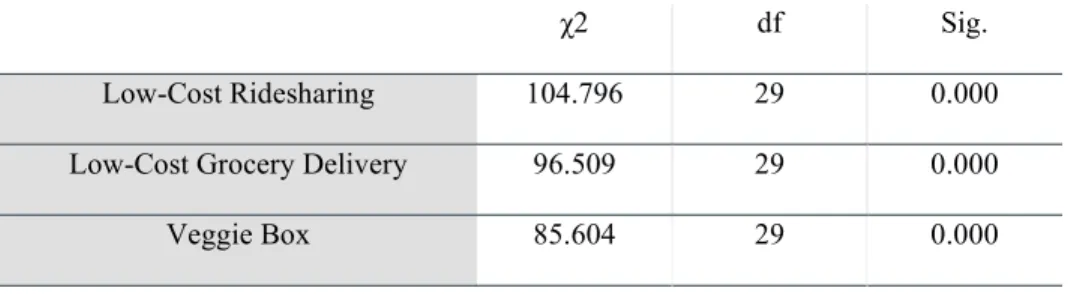
To assess the fitness of the models, Omnibus Tests of Model Coefficients and Hosmer and Lemeshow Goodness of Fit Test were applied. The first provides the overall statistical significance of the model while the second assesses the adequacy of the model by evaluating how poor the model is at predicting categorical outcomes. In different terms, these tests can prove if the overall model is a good representation of the reality.
The three food supply chain models (low-cost ridesharing, low-cost grocery delivery, and veggie box) are statistically significant (p < .0005) in accordance with Omnibus Tests of Model
41 Coefficients, and are not a poor fit (p > .0005) based on the results of Hosmer and Lemeshow Goodness of Fit Test. These results can be seen in Table 10 and Table 11.
Table 10. Omnibus Tests of Model Coefficients
χ2 df Sig.
Low-Cost Ridesharing 104.796 29 0.000
Low-Cost Grocery Delivery 96.509 29 0.000
Veggie Box 85.604 29 0.000
Table 11. Hosmer and Lemeshow Goodness of Fit Test
χ2 df Sig.
Low-Cost Ridesharing 9.664 8 0.289
Low-Cost Grocery Delivery 9.048 8 0.338
Veggie Box 5.951 8 0.653
4.4.2 Explained Variation
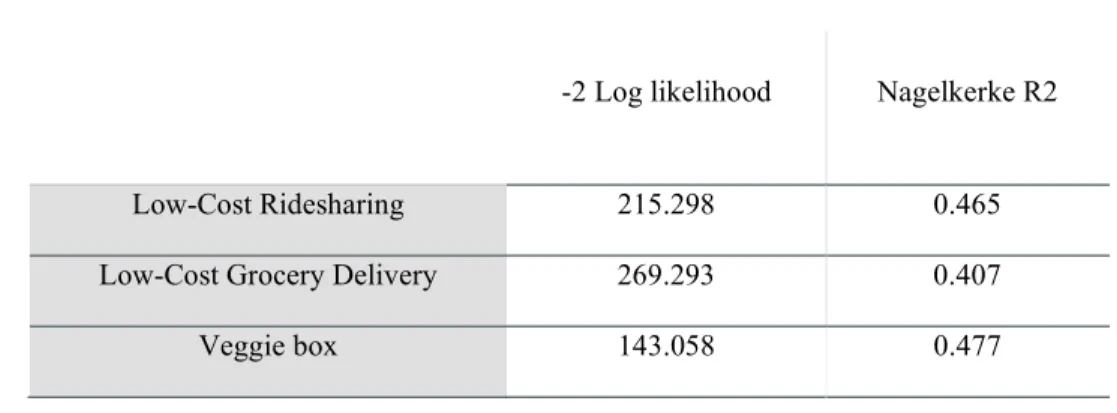
The variation of the categorical dependent variable can be explained by Nagelkerke R -Square, which is equivalent to the R2 in a multiple regression. The use of this pseudo r-square instead of the traditional one from a linear regression model is due to the unfeasibility of conserving all characteristics of it. Hence, Nagelkerke R2 approximates this method for categorical dependent variables. It uses the result of Cox and Snell’s R2 and adjusts to a scale from 0 to 1 (LONG, 1997). The 29 components can explain the variables of the low-cost ridesharing, low-cost grocery delivery, and veggie box models as 46%, 40%, and 48% respectively. Considering the range of the prediction power (0 to 1) and the results mentioned previously, the models seem
42 reasonable accurate. However, further investigation is needed to discern the analysis per categories of consumer profiles.
Table 12. Nagelkerke R2
-2 Log likelihood Nagelkerke R2
Low-Cost Ridesharing 215.298 0.465
Low-Cost Grocery Delivery 269.293 0.407
Veggie box 143.058 0.477
4.4.3 Category Prediction
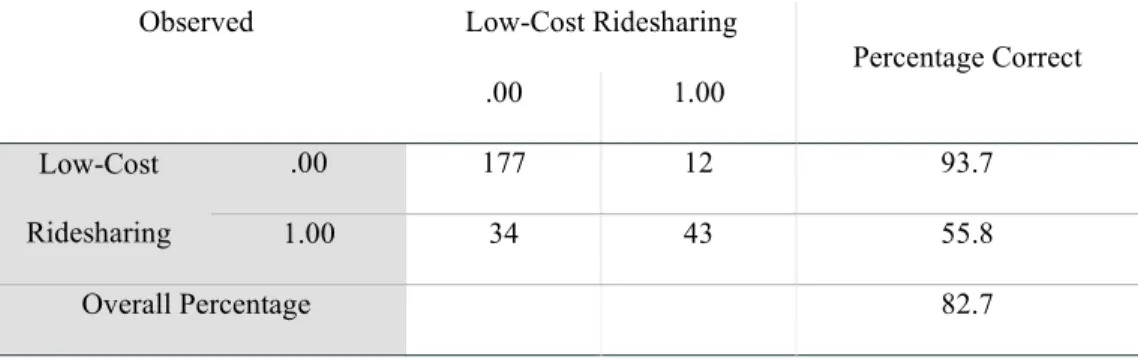
To verify the effectiveness of the model and its prediction accuracy, the predicted classification against the actual classification was assessed. The value of 0.5 was used as cutoff point to predict whether a consumer would accept a specific food supply chain model. This value was chosen as a conventional value considering a binary outcome. When the independent variables were added to the models, they correctly classify 82.7%, 75.2%, and 89.5% of circumstances overall with a sensitivity (i.e., ability of correctly identifying all consumers who would be likely to use the supply chain model, true positive rate) of 55.8%, 67.2%, and 95.6% and a specificity (i.e., ability of correctly identifying the consumers who would not be likely to use the supply chain model, true negative rate) of 93.7%, 81.6%, and 56.1%, as shown in Table 13, Table 14, and Table 15 below (Trevethan, 2017).