HAL Id: hal-03097185
https://hal.archives-ouvertes.fr/hal-03097185
Submitted on 6 Jan 2021
HAL is a multi-disciplinary open access
archive for the deposit and dissemination of sci-entific research documents, whether they are pub-lished or not. The documents may come from teaching and research institutions in France or abroad, or from public or private research centers.
L’archive ouverte pluridisciplinaire HAL, est destinée au dépôt et à la diffusion de documents scientifiques de niveau recherche, publiés ou non, émanant des établissements d’enseignement et de recherche français ou étrangers, des laboratoires publics ou privés.
Longitudinal Study of Foraging Networks in the
Grass-Cutting Ant Atta capiguara Gonçalves, 1944
N. Caldato, R. Camargo, K. Sousa, L. Forti, J. Lopes, Vincent Fourcassié
To cite this version:
N. Caldato, R. Camargo, K. Sousa, L. Forti, J. Lopes, et al.. Longitudinal Study of Foraging Net-works in the Grass-Cutting Ant Atta capiguara Gonçalves, 1944. Neotropical entomology, Sociedade Entomológica do Brasil, 2020, 49 (5), pp.643-651. �10.1007/s13744-020-00776-9�. �hal-03097185�
1 Title: Longitudinal study of foraging networks in the grass-cutting ant Atta capiguara Gonçalves,
1
1944
2 3
N Caldato1, R Camargo1, KK Sousa1, LC Forti1, JF Lopes2, V Fourcassié3*
4
5
1 Universidade Estadual Paulista, Brazil
6
2 Universidade Federal Juiz de Fora, Brazil
7
3 Université de Toulouse, CNRS, France
8
9
*Corresponding author : Vincent Fourcassié
10 Email: vincent.fourcassie@univ-tlse3.fr 11 Tel: +33 (0)5 61 55 88 71 12 ORCID number: 0000-0002-3605-6351 13 14
Running title: Foraging networks of the ant Atta capiguara
15 16
2
Abstract
17
Colonies of leaf-cutting ants of the genus Atta need to collect large quantities of vegetal substrate
18
in their environment to ensure their growth. They do so by building and extending over time a
19
foraging network that consists of several underground tunnels extending above ground by
20
physical trails. This paper presents a longitudinal study of the foraging network of two mature
21
colonies of the grass-cutting ant Atta capiguara (Gonçalves) located in a pasture in central
22
Brazil. Specifically, we investigated whether the extension of the foraging area of the colonies
23
required to reach new resources occurs by building new and longer underground tunnels or by
24
building new and longer physical trails. Each nest was surveyed at intervals of approximately 15
25
days during one year. At each survey we mapped the position of the tunnel entrances and
26
foraging trails at which activity was observed. In addition, we assessed the excavation effort of
27
the colonies since the last survey by the number and distance to the nest of new tunnel entrances,
28
and the physical trail construction effort by the number and length of newly built physical trails.
29
Our study reveals that in A. capiguara the collection of new resources around the nest required to
30
ensure the continuous growth of the colonies is achieved mainly through the excavation of new
31
underground tunnels, opening at greater distance from the nest, not through the building of
32
longer aboveground physical trails.
33
34
Keywords: formicidae, pasture, tropical, Brazil
35
Introduction
36
Ant foraging trails are a notable example of transportation networks (Perna & Latty 2014). In
37
some species (Formica polyctena (Förster): Rosengren 1971, Iridomyrmex purpureus (Smith):
3 Cabanes et al 2015, Messor barbarus (L.): Lopez et al 1994, Plowes et al 2013, Atta spp.:
39
Vasconcelos 1990, Wirth et al 2003, Kost et al 2005, Lopes et al 2016, Silva et al 2013)
40
foraging workers build long-lasting conspicuous trails, called physical trails, that lead them from
41
their nest directly to the location of the resources they exploit (Anderson & McShea 2001, Silva
42
et al 2013). Ants act as true ecosystem engineers (Cuddington et al 2007) by modifying the
43
environment through the cutting of the vegetation along these trails and the removal of the small
44
obstacles that impede their locomotion (Howard 2001, Cevallos Dupuis & Harrison 2016,
45
Bochynek et al 2016, 2019, Middleton et al 2019). These trails can be followed on the ground
46
even in absence of ants on them and they can be maintained for periods of time that can extend
47
to several years in some ant species (Rosengren 1971, Bochynek et al 2016).
48
Physical trails can have several functions for ant colonies. First, they offer a smooth
49
substrate and thus allow ants to move faster from the food locations to their nest, to have a higher
50
transport efficiency and to increase their food delivery rate (Sales et al 2015, Bouchebti et al
51
2018). Second, they allow colonies to share and gather information rapidly on the resources
52
available in the environment (Shepherd 1982, Farji-Brener & Sierra 1998, Dussutour et al 2007,
53
Farji-Brener et al 2010, Bouchebti et al 2015a). Third, physical trails can be considered as a
54
“physical memory” of resource locations (Fowler & Stiles 1980, Rockwood & Hubell 1987,
55
Wirth et al 2003, Kost et al 2005) that facilitates resource monitoring. And fourth, physical trails
56
partition space between neighbouring colonies and thus reduce the effect of competition
57
(Hölldobler & Lumsden 1980, Vilela & Howse 1986, Wirth et al 2003).
58
Physical trail networks typically are formed by the successive branching of foraging trails
59
in most species of ants (Hölldobler & Möglich 1980, Buhl et al 2009, Silva et al 2013).
60
However, the geometry of these networks and the persistence of the trails vary within and
4 between species according to the characteristics of the environment and the type of food
62
collected (Carroll & Janzen 1973). For example, the seed-harvesting ant Messor barbarus adopts
63
a “phalanx” strategy in areas of high resource density in which it builds networks with a high
64
rate of trail bifurcations whereas in areas of low resource density it adopts a “guerilla” strategy
65
with longer and less branching trails (Lopez et al 1993, 1994). The geometry of the trail
66
networks also depends on the density of the vegetation, with branching angles at bifurcations
67
being more acute in open areas with low vegetation density than in close areas with high
68
vegetation density (Acosta et al 1993, Farji-Brener et al 2015). As for the persistence of the
69
physical trails, it can vary according to the type of resource collected. For example, in the
grass-70
cutting ant Atta bisphaerica (Forel) which exploits small and ephemeral patches of grass, most
71
physical trails last only a few days (Lopes et al 2016). On the other hand, when the resources are
72
stable or regularly renewed, e.g. colonies of Homoptera producing honeydew exploited by red
73
wood ants or plants that are regularly defoliated by leaf-cutting ants, physical trails are generally
74
highly persistent and the geometry of the trail networks show little change for long periods of
75
time (Chauvin 1962, Rockwood & Hubell 1987, Kost et al 2005).
76
Longitudinal studies of foraging trail networks are relatively scarce in the ant literature
77
(Formica rufa (L.): Skinner 1980, Iridomyrmex purpureus: Cabanes et al 2015; Atta spp.:
78
Vasconcelos 1990, Kost et al 2005, Silva et al 2013, Lopes et al 2016). Yet, these studies allow
79
for a better understanding of the interactions between resource availability, the growth of the
80
colonies, the changes in meteorological conditions or in the environment surrounding the nest
81
and the geometry of the foraging networks. Here, we present a longitudinal study of the
82
geometry of the physical trail networks of the grass-cutting ant Atta capiguara which is
83
frequently found in the pastures of the southern part of Brazil (Forti 1985, Fowler et al 1986,
5 Delabie et al 2011). As other species of ants of the genus Atta (A. sexdens (L.): Vasconcelos,
85
1990; A. bisphaerica: Moreira et al., 2004, Lopes et al., 2016; A. laevigata (Smith): Moreira et
86
al., 2004), A. capiguara builds underground tunnels that depart from their nest chambers, open to
87
the outdoor environment at some distance from their nest and extend above ground to reach
88
distant foraging grounds.
89
During a 12-month period we mapped the foraging network of two mature nests at
90
intervals of approximately two weeks and monitored ant activity on the trails and around the
91
tunnel entrances. First, we investigated the spatiotemporal dynamics of the trail networks and the
92
way ants distribute their foraging effort around their nests and tunnel entrances during the
93
monitoring period. Second, we investigated whether the extension of the foraging area of the
94
colonies we observed occured through the excavation of more underground tunnels, opening at
95
greater distance from the nest, or through the building of more and longer physical trails, starting
96
from existing tunnel entrances.
97
98
Material and Methods
99
Data collection was carried out during one year from November 2011 to October 2012 in a
100
pasture area at Santana Farm, located in the city of Botucatu– SP (225309 S; 482642W). The
101
pasture consisted mainly of Brachiaria decumbens with spots of Paspalum notatum.
102
Two nests of A. capiguara were selected for our observation. Both nests had already
103
produced alates. They were thus at least 3 years old (Autuori 1941) and were considered as
104
mature. The size of the nests were estimated by measuring the area covered by loose soil on top
105
of the nests. At the beginning of the monitoring period this measured area (estimated by the
6 product of its largest length by its largest width, according to the method used by Forti et al
107
2017) was 34.31 and 8.4 m2 while at the end it was 228.00 and 113.70m2, for Nest 1 and Nest 2
108
respectively, representing an increase by a factor of 6.6 and 13.5. Nest 1 was located in the
109
middle of the pasture while Nest 2 was at approximately 20m from one of its edges and at a
110
distance of about 20m from Nest 1.
111
For the mapping of foraging activities two 40x40m grids centered on each nest with
112
stakes placed at 10 meter intervals over the grid were used. Each nest was surveyed at intervals
113
of 15 days, always in the late afternoon, corresponding to the peak of foraging activity in A.
114
capiguara, whatever the season (Caldato et al 2016). At the beginning of each survey, the area
115
around each nest was inspected to find out whether new tunnel entrances had been excavated and
116
new foraging trails constructed since the last survey.
117
To check whether the new trails really belonged to the studied nests, we used a variation
118
of the method developed by Fowler et al (1993). Small acrylic particles of various colors,
119
measuring approximately 0.7cm in length, were immersed into a water and sugarcane molasses
120
(3:1) solution and then impregnated with sugarcane leaf powder. These particles were then
121
distributed near the edges of the trails, with different colors used for each trail. After a period of
122
24 hours, we checked for the presence of the particles on the top of loose soil over the studied
123
nests, confirming the trails as belonging to the nest.
124
The tunnel entrances were categorized as open with dispersed foraging activity around by
125
isolated workers but with no visible foraging trails departing from them, open with one or
126
several foraging trails departing from them with ant traffic, open but inactive (without ant
127
foraging activity) or closed (when the entrance hole’s opening was no longer visible). Finally,
128
the positions of new entrance holes and of new trail ends were measured from the distance of the
7 two nearest stakes in the grid and then mapped at scale on a graph using the software CorelDraw
130
X3.
131
Since we did not have any expectation as to what could be the trend followed by the
132
change over time in the distance of the tunnel entrances to the nest and in the length of the
133
foraging trails, we used a General Additive Model (GAM) (Zuur et al, 2009) with a gaussian
134
error distribution and a cubic regression spline. The nest identity was entered as a fixed variable
135
and the time series corresponding to each nest were allowed to have a different residual spread
136
so that we could investigate whether there are differences between the two nests in the temporal
137
trend of the distance of the tunnel entrances to the nest and in the length of the foraging trails.
138
For each variable studied, to take into account the correlation between successive values in the
139
time series, we added to the GAMs a correction term implementing a correlation structure in the
140
residuals corresponding to an auto-regression of order 1, i.e. the simplest form of temporal
141
correlation in which a value at time t in a time series depends only on the value at time t-1 (Zuur
142
et al 2009). The nest identity was nested in the time variable so that the auto-correlation was
143
applied at the level of each nest. The models were fitted with the mgcv R package (Wood 2017).
144
Model validation was carried out by plotting the model residuals vs fitted values and vs time and
145
by checking the normality of the residual distribution with a qqplot. All analyses and figures
146
were done with R 3.4.3 software run under RStudio version 1.0.153.
147
148
Results
149
We divide the result section into two parts. The first part deals with the distribution of
150
the foraging effort around the nests and around the tunnel entrances over the monitoring
8 period while the second part deals with the evolution of both the excavation effort of the
152
colonies and their effort in building new physical trails over the monitoring period.
153
Distribution of foraging efforts
154
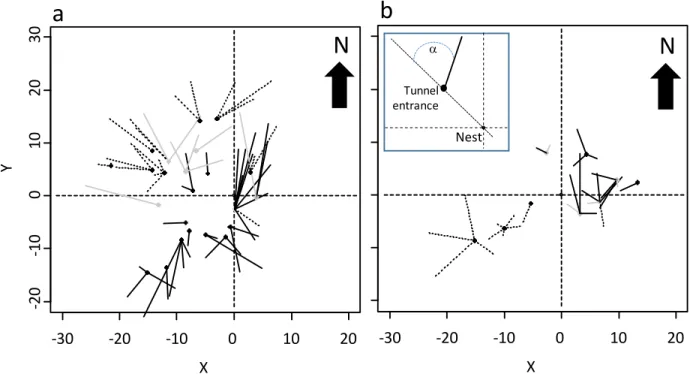
The foraging activity of nest 1 was homogeneously distributed around the nest during the first
155
half of the monitoring period (Fig 1a) while that of nest 2 was concentrated in the eastern sector
156
(Fig 1b). During the second half of the monitoring period the foraging activity of nest 1 was
157
concentrated in the northwestern sector (Fig 1a) while that of nest 2 shifted to the southwest
158
sector (Fig 1b).
159
The majority of foraging trails were built from already opened tunnel entrances so that
160
several foraging trails were used successively over time at most tunnel entrances (Fig 1). In both
161
nests most foraging trails extended away from the nest, more or less in the continuation of a
162
straight line linking the nest location to the tunnel entrance.
163
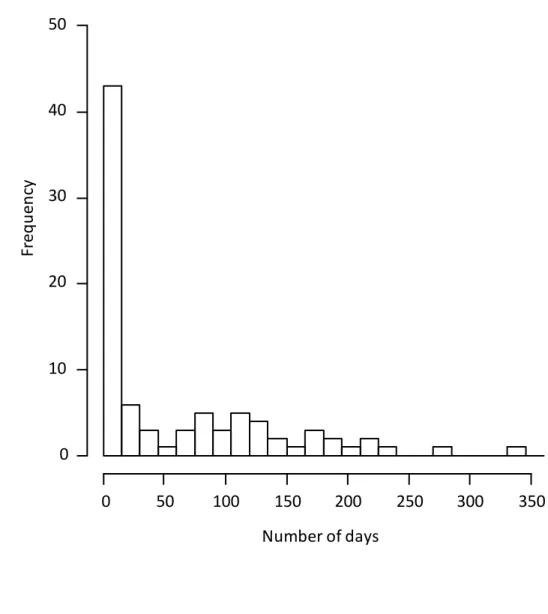
More than half of the trails were active during one survey only and thus had a lifetime of
164
less than 15 days (Fig 2) and among these trails 86% were created during the first half of the
165
monitoring period, i.e. during the months with the highest rainfall. Two trails had a lifetime of
166
more than 10 months. There was no correlation between the lifetime of the trails and their length
167
(Spearman’s rank correlation: ρ= -0.06, P= 0.58).
168
To investigate whether the foraging effort of ants was distributed randomly around the
169
tunnel entrances or whether it was oriented in specific directions we analysed the geometry of
170
the trail network of the two colonies.
171
First, we computed the distribution of the angles between the direction of the line joining
172
the location of the nest and each tunnel entrance and the direction of the line joining the location
9 of the tunnel entrance and the end of each trail departing from this entrance (angle α in the inset
174
of Fig 1b). We found that this distribution was approximately centered on 0° (mean ± SD: 17 ±
175
91°, comparison of the mean of the angle distribution with 0°: t test= 1.712, P= 0.09, N= 87) and
176
therefore that most trails extended in the continuation of the tunnel from which they originated.
177
Second, we investigated whether ants build their trails in a random direction from the tunnel
178
entrance or whether they build them so as to avoid reaching locations that are at a closer distance
179
from a tunnel entrance already open. We found that for only 24% of the new foraging trails built
180
by the two colonies studied, the end point of the trails were closer to a tunnel entrance already
181
open than to the tunnel entrance from which they originated.
182
To investigate whether the same proportion would be found if ants were building their
183
trails in a random direction, we ran a simulation in which the direction of the trails (with the
184
same length as observed trails) from each tunnel entrance was picked randomly from a normal
185
distribution centered on the direction of the line joining the tunnel entrance to the nest location
186
and with a standard deviation corresponding to that calculated for the observed networks, i.e. 91°
187
(see above). We ran the simulation 200 times and calculated for all runs of the simulations the
188
average percentage of trails whose end point was closer to a tunnel entrance already open. The
189
value we found was 46%, thus almost the double than the value calculated for the observed
190
networks. This means therefore that ants were not building their trails in random directions and
191
that in most cases the patches of grass they exploited could not be reached by a shorter trail built
192
from a tunnel entrance already open. This resulted in a reduced overlap of the space exploited
193
around each tunnel entrance and in a better partition of the foraging space at the level of the
194
colonies, with the flow of ants from each tunnel entrance directed towards different locations.
195
Excavation and physical trail construction effort
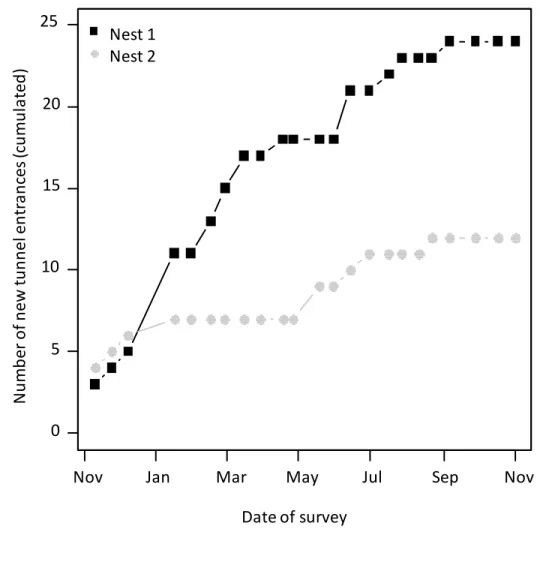
10 Over the12 month monitoring period a total of 36 tunnel entrances (24 for Nest 1 and 12 for Nest
197
2) were opened by the two studied colonies. The number of newly opened tunnel entrances
198
increased continuously for both nests during the monitoring period, with phase of growth
199
alternating with phase of stasis (Fig 3). The increase in the number of new tunnel entrances in
200
nest 1 was steeper from November to April, when resources are plentiful, than from May to
201
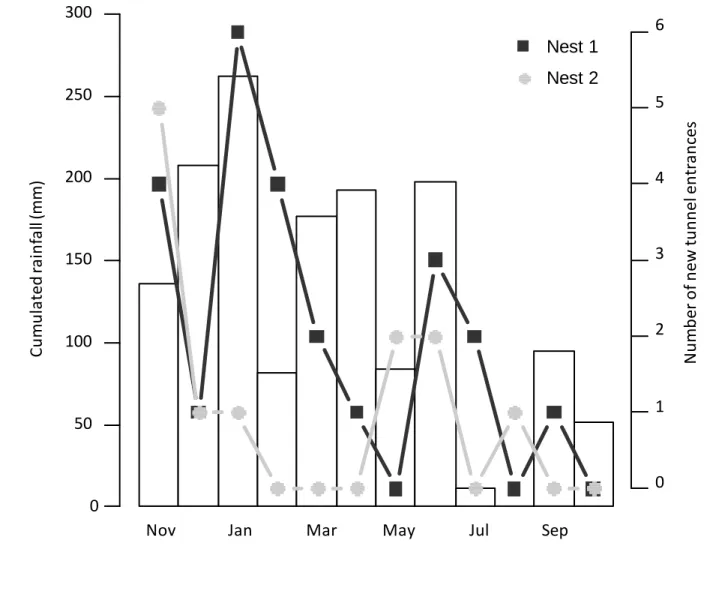
October, corresponding to dry season. However, there was no significant correlation in the
202
monthly number of new tunnel entrances created and the cumulated monthly rainfall (Fig 4)
203
(Spearman’s rank correlation: ρ= 0.47, P= 0.13 and ρ= 0.29, P= 0.36 for nest 1 and nest 2,
204
respectively). The overall increase in the number of new tunnel entrances was much greater for
205
nest 1 than for nest 2, suggesting that the growth of the underground tunnel network occurs
206
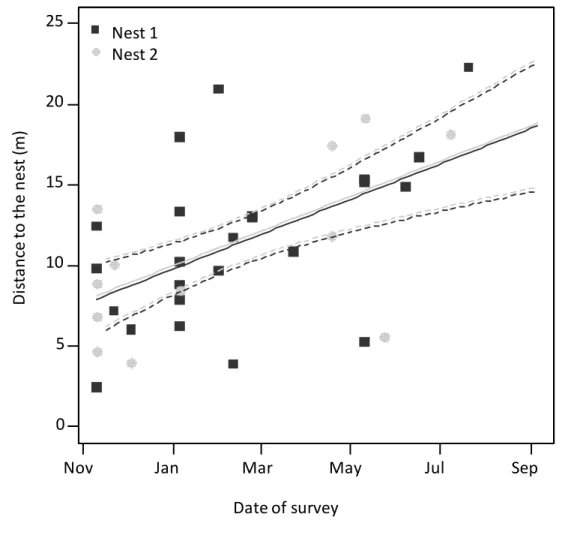
differently in the two nests, probably because of their difference in size. The mean distance of
207
new tunnel entrances to the location of the nest increased over time in the same manner in both
208
nests over the monitoring period (Fig 5; GAM, df= 1, F= 15.22, P<0.001, R2= 0.29), suggesting
209
an extension of the network of underground tunnels.
210
In both nests most tunnel entrances closed or became inactive after one to two months of
211
activity (Fig 6). At some of the entrances that remained open, workers were observed removing
212
soil particles, suggesting the excavation of new chambers within the nest. Note that some tunnel
213
entrances closed and then reopened and became active again a few weeks later (e.g. entrance 4,
214
9, 12 of nest 1 in Fig 6).
215
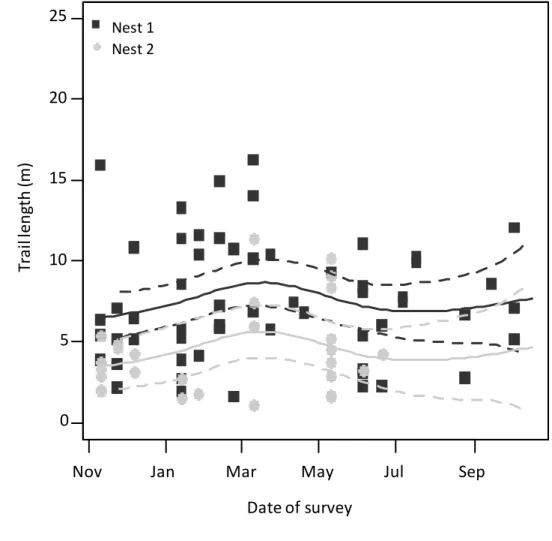
A total of 87 physical foraging trails were built from the tunnel entrances in both nests
216
during the monitoring period, 58 for nest 1, and 29 for nest 2. The mean length of newly built
217
physical trails was longer for nest 1 compared to nest 2 (Fig. 7; GAM: df= 1, F= 14.16, P<0.001,
11 R2= 0.17) but in both nests it did not vary much over the monitoring period (GAM: df= 3.42,
219
F= 1.27, P=0.315).
220
Discussion
221
Our study shows that the extension of the foraging area in A. capiguara and the shift to
222
new locations at which vegetation is collected occurs mainly through the construction of new
223
underground tunnels, opening at greater distance from the nest, not through the continuation of
224
existing physical trails or the building of new and longer physical trails from existing tunnel
225
entrances. In fact, while the distance from the nest of newly excavated tunnel entrances increased
226
over time in both nests at each survey (Fig 5), the length of newly built physical trails remain
227
approximately the same (Fig 7). Although more costly to build for the colonies, underground
228
tunnels offer a better protection to the ants against adverse abiotic conditions (Bouchebti et al,
229
2015) than aboveground physical foraging trails. In addition they can also be used for longer
230
periods of time.
231
Leaf-cutting ant colonies generally have an accelerated growth rate during the first three years
232
after their foundation (Hernandez et al 1999, Grandeza et al 1999). After producing alates in
233
their third year they then grow at a lower and steady rate. There are two ways ants can extend the
234
foraging area of their colony. They can either stop excavating underground tunnels and build
235
more and longer foraging trails from already existing tunnel entrances, or they can build more
236
and longer tunnels and increase (or not) the number and the length of the foraging trails
237
departing from these tunnels. Our observations show that in A. capiguara, contrary to what has
238
been described in the species A. sexdens and A. cephalotes (L.) (Vasconcelos 1990), the
239
extension of the foraging area is mainly achieved through the excavation of new underground
240
tunnels, opening at greater distance from the nest, not through the building of longer foraging
12 trails. Although the cost of excavating longer tunnels is likely to be much higher than that of
242
building physical foraging trails, the tunnels considerably reduce exposure to high temperatures
243
and solar radiation which occurs both during the construction process of the physical trails
244
(which can take minimally 5 to 6 days for physical foraging trails: Bouchebti et al 2018) and
245
when travelling on these trails to exploit resources. They can also act as a thermal refuge in
246
which the workers can find temporary protection against high outdoor temperatures (Bouchebti
247
et al 2015b). Moreover, as noted by Vasconcelos (1990), their cost of maintenance is lower than
248
that of foraging trails which is not negligible (Howard 2001, Bochynek et al 2016). While most
249
foraging trails are used for short periods of time and then abandoned altogether, underground
250
tunnels can be left unused for long periods of time and then rapidly reactivated to shift the
251
location of the foraging activity of the colonies in order to exploit new patches of vegetation.
252
Although the two A. capiguara nests we studied were about the same age and were located in the
253
same pasture and thus submitted to the same meteorological conditions, the growth of their
254
foraging network was different. This could be due to a variety of reasons, e.g. a heterogeneity in
255
the availability of the resources offered by the pasture and/or differences in the productivity of
256
the queens.
257
Similar to what has been observed in mature colonies of A. bisphaerica (Moreira et al
258
2004, Lopes et al 2016), A. sexdens (Vasconcelos 1990) and A. laevigata (Reed & Cherrett
259
1990) and contrary to what has been observed in mature colonies of A. colombica
(Guérin-260
Méneville) (Wirth et al 2003) and A. cephalotes (Vasconcelos 1990, Silva et al 2013), none of
261
the foraging trails of the two nests of A. capiguara studied departed directly from the heap of
262
loose soil over the nests. All trails departed from underground tunnels whose entrance was at a
263
distance of several meters from the nest. Therefore, in A. capiguara, as in most leaf-cutting ant
13 species (Shepherd 1982, Vasconcelos 1990, Reed & Cherrett 1990, Farji-Brener & Sierra 1998,
265
Bouchebti et al 2018), foraging is centered on the trail system: the scouts depart directly from the
266
tunnel entrances or from the foraging trails and the search for new resources is thus concentrated
267
in the area close to these structures. Consequently, a large part of the foraging area in-between
268
foraging trails remains unexploited (Vasconcelos 1990, Wirth et al 2003, Kost et al 2005, Lopes
269
et al 2016).
270
The foraging trails of the two nests of A. capiguara studied were relatively short and
271
almost never bifurcated (see also Forti 1985). This is at variance with what has been found in
272
most leaf-cutting ants of the genus Atta (A. cephalotes, A. colombica, A. sexdens: Shepherd
273
1982, Vasconcelos 1990, Kost et al 2005) but similar to what has been observed in the
grass-274
cutting ant A. bisphaerica (Lopes et al 2016). These differences in the organization and
275
geometry of the foraging networks may be linked to differences in the type of environment in
276
which ants of the genu Atta are found (e.g. close vs. open environment), in the spatio-temporal
277
distribution of the resources collected (grasses or leaves), and/or in the resistance of the workers
278
to high outdoor temperatures (Bouchebti et al 2015b). In A. capiguara a trail is built to exploit
279
only one single patch of grass while in other species of Atta, a single trail can be used to exploit
280
various plant units (Fowler et al 1986). Moreover, our analysis of the trail network shows that
281
the trails were built so as to reduce the overlap in the space exploited around each tunnel
282
entrance. The mechanism by which this process emerges remains to be investigated.
283
Throughout the 12-month monitoring period we observed a continuous increase of the
284
number of newly opened tunnel entrances in both nests studied, suggesting an extension of the
285
networks of underground tunnels. Excavation effort then slowed down from April on. Since
286
there was no correlation between the monthly number of new tunnel entrances and the cumulated
14 monthly rainfall, this was probably not due to a hardening of the soil. Rather, this could be
288
linked to a decrease in the amount of biomass collected (Caldato et al 2016) due to a reduction of
289
the resource available to the colonies in the dry months of the year. Nevertheless, the number of
290
physical trails with foraging activity did not vary much throughout the year. This is explained by
291
the fact that ants kept using or reactivating the entrance holes of the tunnels that were already
292
built. Ants also took advantage of the existing tunnels by building several physical trails in
293
different directions from the same entrances. Finally, since the growth of the vegetation is linked
294
to rainfall and thus slows down in the dry season, physical foraging trails should require less
295
maintenance in the dry season and thus can be used for longer periods of time. Similar
296
conclusions have been reached by Lopes et al (2016) in the leaf-cutting ant A. bisphaerica.
297
During the dry months of the year, characterized in Botucatu by higher air temperature
298
and lower relative humidity (Caldato et al 2016), ants concentrated their foraging activity in a
299
particular angular sector around their nests, whereas during the wet months their foraging
300
activity was more homogeneously distributed, particularly for nest 1. This is concordant with the
301
observations of Kost et al (2005) who found that the fractal dimension of the foraging trail
302
networks, i.e. the area covered by the network, was higher in the wet season than in the dry
303
season in mature colonies of the leaf-cutting ant. A. colombica. Ants may take more time to
304
exploit the same patch of grass during the dry months than during the wet months of the year
305
because of the scarcity of palatable grass blades. This is indeed suggested by the lower
306
proportion of ants carrying vegetation in nestbound traffic at high temperatures (Caldato et al
307
2016).
308
Overall, our study highlights the fact that, in the same way as in in the grass-cutting ant
309
A. bisphaerica (Lopes et al 2016), the extension of the foraging network required to ensure the
15 continuous provisioning of the colonies in the grass-cutting ant A. capiguara is achieved mainly
311
through the excavation of new and longer underground tunnels. Once they exit these tunnels,
312
ants only have to travel a mean distance of about 5 meters in order to reach the patches of grass.
313
This could contribute to minimizing their exposure to predators, parasites or adverse abiotic
314
conditions.
315
Authors’ contributions: all authors contributed fully or partly to the conception and design of
316
the work presented, to the acquisition and analysis of the data and to the writing of the
317
manuscript.
318
Acknowledgments: Financial support and stipends were given to NC by the Fundação de
319
Amparo a Pesquisa do Estado de São Paulo (FAPESP) (2011/003699). During her stay in
320
Botucatu VF was financed by a CAPES-COFECUB grant (633/08).
321
322
References
323
Acosta FJ, López F, Serrano JM (1993) Branching angles of ant trunk trails as an optimization
324
cue. J theor Biol 160: 297–310.
325
Anderson C, McShea DW (2001) Intermediate-level parts in insect societies: adaptive structures
326
that ants build away from the nest. Insectes Soc 48: 291–301.
327
Autuori M (1941) Contribuição para o conhecimento da saúva (Atta spp.–Hymenoptera:
328
Formicidae). I–Evolução do sauveiro (Atta sexdens rubropilosa Forel, 1908). Arq. Inst. Biol.
329
(Sao. Paulo).12.
330
Bochynek T, Meyer B, Burd M (2016) Energetics of trail clearing in the leaf-cutter ant Atta.
331
Behav Ecol Sociobiol 71: 14.
332
Bochynek T, Burd M, Kleineidam C, Meyer B (2019) Infrastructure construction without
16 information exchange: the trail clearing mechanism in Atta leafcutter ants. Proc Roy Soc B,
334
286: 20182539.
335
Bouchebti S, Ferrere S, Vittori K, Latil G, Dussutour A, Fourcassié V (2015a) Contact rate
336
modulates foraging efficiency in leaf cutting ants. Scient Rep 5: 18650.
337
Bouchebti S, Jost C, Caldato N, Forti LC, Fourcassié V (2105b) Comparative study of resistance
338
to heat in two species of leaf-cutting ants. Insectes Soc 62: 97–99.
339
Bouchebti S, Travaglini RV, Forti LC, Fourcassié V (2018) Dynamics of physical trail
340
construction and of trail usage in the leaf-cutting ant Atta laevigata. Ethol Ecol Evol 1: 1–16.
341
Buhl J, Hicks K, Milller ER, Persey S, Alivini O, Sumpter DJT (2009) Shape and efficiency of
342
wood ant foraging networks. Behav Ecol Sociobiol 63: 451–460.
343
Cabanes G, van Wilgenburg E, Beekman M, Latty T (2015) Ants build transportation networks
344
that optimize cost and efficiency at the expense of robustness. Behav Ecol 26: 223–231.
345
Caldato N, Forti LC, Bouchebti S, Lopes JFS, Fourcassié V (2016) Foraging activity pattern and
346
herbivory rates of the grass-cutting ant Atta capiguara. Insectes Soc 63: 421–428.
347
Carroll CR, Janzen DH (1973) Ecology of foraging by ants. Annu Rev Ecol Syst 4: 231–257.
348
Cevallos Dupuis E, Harrison JF (2016) Trunk trail maintenance in leafcutter ants: caste
349
involvement and effects of obstacle type and size on path clearing in Atta cephalotes. Insectes
350
Soc 64 : 189–196.
351
Chauvin R (1962) Observations sur les pistes de Formica polyctena. Insectes Soc 9 : 311–321.
352
Cuddington K, Byers J, Wilson W, Hastings A (2007) Ecosystem engineers: plants to protists.
353
Academic Press, Burlington San Diego London, p 406
354
Delabie J, Alves HSR, Reuss-Strenzel GM, Carmo AFR, Nascimento IC (2011) In: della Lucia
355
TMC (ed) Formigas cortadeiras - da bioecologia ao manejo. Universidade Federal de Viçosa,
356
Viçosa, pp 80–10
17 Dussutour A, Beshers S, Deneubourg J-L, Fourcassié V (2007) Crowding increases foraging,
358
efficiency in the leaf-cutting ant Atta colombica. Insectes Soc 54: 158–165.
359
Farji-Brener A, Sierra C (1998) The role of trunk trails in the scouting activity of the leaf-cutting
360
ant Atta cephalotes. Ecoscience 5: 271–274.
361
Farji-Brener AG, Amador-Vargas S, Chinchilla F, Escobar S, Cabrera S, Herrera MI, Sandoval C
362
(2010) Information transfer in head-on encounters between leaf-cutting ant workers: food, trail
363
condition or orientation cues? Anim Behav 79: 343–349.
364
Farji-Brener AG, Chinchilla F, Umaña MN, Ocasio-Torres M, Chauta-Mellizo A, Acosta-Rojas
365
D, Marinaro S, de Torres Curth M, Amador-Vargas S (2015) Branching angles reflect a
trade-366
off between reducing trail maintenance costs or travel distances in leaf-cutting ants. Ecology
367
96: 510–517.
368
Forti LC (1985) Ecologia da saúva Atta capiguara Gonçalves, 1944 (Hymenoptera, Formicidae)
369
em pastagem. (Escola Superior de Agricultura “Luiz de Queiroz”, Universidade de São Paulo,
370
Piracicaba, 1985).
371
Fowler HG, Forti LC, Pereira-da-Silva V, Saes NB (1986) Economics of grass-cutting ants. In
372
Lofgren CS & Vander Meer KR (eds) Fire ants and leaf-cutting ants: biology and
373
management. Westview Press, New York Oxon, pp 18–35
374
Fowler HG, Schlindwein MN, Schlittler FM, Forti LC (1993) A simple method for determining
375
location of foraging ant nests using leaf cutting ants as a model. J Appl Entomol 116: 420–
376
422.
377
Fowler HG, Stiles EW (1980) Conservative resource management by leaf-cutting ants? The role
378
of foraging territories and trails, and environmental patchiness. Sociobiol 5: 25–41.
379
Grandeza LAO, Moraes JC, Zanetti R (1999) Estimativa de crescimento externo de ninhos de
380
Atta sexdens rubropilosa Forel, 1908 e de Atta laevigata (F. Smith, 1858) (Hymenoptera:
18 Formicidade) em áreas de reflorestamento com eucalipto. Ann Soc Entomol Bras 28: 59–64
382
(1999).
383
Hernández JV, Ramos C, Borjas M, Jaffé K (1999) Growth of Atta laevigata (Hymenoptera:
384
Formicidae) nests in pine plantations. Florida Entomol 82: 97–103.
385
Holldobler B, Lumsden CJ (1980) Territorial strategies in ants. Science 210: 732–739.
386
Hölldobler B, Möglich M (1980) The foraging system of Pheidole militicida (Hymenoptera:
387
Formicidae). Insectes Soc 27: 237–264.
388
Howard JJ (2001) Costs of trail construction and maintenance in the leaf-cutting ant Atta
389
columbica. Behav Ecol Sociobiol 49: 348–356.
390
Kost C, de Oliveira EG, Knoch TA, Wirth R (2005) Spatio-temporal permanence and plasticity
391
of foraging trails in young and mature leaf-cutting ant colonies (Atta spp.). J Trop Ecol 21:
392
677–688.
393
Lopes JFS, Brugger MS, Menezes RB, Camargo RS, Forti LC, Fourcassié V (2016)
Spatio-394
temporal dynamics of foraging networks in the grass-cutting ant Atta bisphaerica Forel, 1908
395
(Formicidae, Attini). PLoS One 11, e0146613.
396
López F, Acosta FJ, Serrano JM (1993) Responses of the trunk routes of a harvester ant to plant
397
density. Oecologia 93: 109–113.
398
López F, Acosta FJ, Serrano JM (1994) Guerilla vs. phalanx strategies of resource capture:
399
growth and structural plasticity in the trunk trail system of the harvester ant Messor barbarus.
400
J Anim Ecol 63: 127–138.
401
Lugo AE, Farnworth EG, Pool D, Jerez P, Kaufman G (1973) The impact of the leaf cutter ant
402
Atta Colombica on the energy flow of a tropical west forest. Ecology 54: 1292–1301.
403
Middleton TEJ, Garnier S, Latty T, Reid CR (2019) Temporal and spatial pattern of trail clearing
404
in the Australian meat ant, Iridomyrmex purpureus. Anim Behav 150: 97-111.
19 Moreira A, Forti LC, Andrade AP, Boaretto MA, Lopes J (2004) Nest architecture of Atta
406
laevigata (F. Smith, 1858) (Hymenoptera: Formicidae). Stud Neotrop Fauna Environ 39: 109–
407
116 (2004).
408
Moreira AA, Forti LC, Boaretto MA, Andrade AP, Lopes JFS, Ramos VM (2004) External and
409
internal structure of Atta bisphaerica Forel (Hymenoptera: Formicidae) nests. J Appl Entomol
410
128: 204–211.
411
Perna A, Latty T (2014) Animal transportation networks. J R Soc Interface 11: 20140334.
412
Plowes NJR, Johnson RA, Hölldobler B (2013) Foraging behavior in the ant genus Messor
413
(Hymenoptera: Formicidae: Myrmicinae). Myrmecol News 18: 33–49.
414
Reed J, Cherrett JM (1990) Foraging strategies and vegetation exploitation in the leaf-cutting ant
415
Atta cephalotes(L.) – a preliminary simulation modeL. In: Vander Meer R, Jaffé K, Cedeno
416
A (eds) Applied myrmecology - A world perspective, Westview Press, New York Oxon, pp.
417
355–366.
418
Rockwood LL, Hubbell SP (1987) Host-plant selection, diet diversity, and optimal foraging in a
419
tropical leafcutting ant. Oecologia 74: 55–61.
420
Rosengren R (1971) Route fidelity, visual memory and recruitment behavior in foraging wood
421
ants of the genus Formica (Hymenoptera, Formicidae). Acta Zool Fenn 133: 1–106.
422
Sales TA, Hastenreiter IN, de Almeida NG, Lopes JFS (2015) Fast food delivery: is there a way
423
for foraging success in leaf-cutting ants? Sociobiol 62: 513–518.
424
Shepherd JD (1982) Trunk trails and the searching strategy of a leaf-cutter ant, Atta colombica.
425
Behav Ecol Sociobiol 11: 77–84.
426
Silva PSD, Bieber AGD, Knoch TA, Tabarelli M, Leal IR, Wirth R (2013) Foraging in highly
427
dynamic environments: leaf-cutting ants adjust foraging trail networks to pioneer plant
428
availability. Entomol Exp Appl 147: 110–119.
20 Skinner GJ (1980) Territory, trail structure and activity patterns in the wood-ant, Formica rufa
430
(Hymenoptera: Formicidae) in limestone woodland in North-West England. J Anim Ecol 49:
431
381.
432
Vasconcelos HL (1990) Foraging activity of two species of leaf-cutting ants (Atta) in a primary
433
forest of the Central Amazon. Insectes Soc 37: 131–145 (1990).
434
Vilela EF, Howse PE (1986) Territoriality in leaf-cutting ants, Atta spp. In: Lofgren CS &
435
Vander Meer KR (eds) Fire ants and leaf-cutting ants: biology and management. Westview
436
Press, New York Oxon, pp.159–171.
437
Wirth R, Herz H, Ryel RJ, Beyschlag W, Hölldobler B (2003) Herbivory of leaf-cutting ants: A
438
Case Study on Atta colombica in the Tropical Rainforest of Panama. Springer, Berlin
439
Heidelberg, p 231
440
Wood SN (2017) Generalized Additive Models: An Introduction with R (2nd edition).
441
Chapman and Hall/CRC, Boca Raton London New York, p 385
442
Zuur AF, Ieno EN, Walker NJ, Saveliev AA, Smith GM (2009) Mixed effects models and
443
extensions in ecology with R. Springer, New York, p 574
444
21
446
Fig 1: Map of the physical foraging trails built by (a) nest 1 and (b) nest 2. The black solid lines
447
are the trails active in the first half of the monitoring period, i.e. from November 2011 to April
448
2012, the black dashed lines are those active in the second half and the grey lines are those active
449
in both periods. The points represent the tunnel entrances. The nest lies at the intersection of the
450
dashed lines. The black thick arrow shows the north direction. The inset in (b) shows the angle α
451
which was calculated to investigate the distribution of foraging effort around the tunnel
452 entrances. 453 454 -30 -20 -10 0 10 20 X -30 -20 -10 0 10 20 -20 -10 0 10 20 30 X Y
a
b
N
N
Nest Tunnel entrance α22
455 456
Fig 2: Frequency histogram of the duration of usage of the physical trails for the two A.capiguara
457
nests studied. The duration of usage of each trail is calculated by the interval elapsed between the
458
first and last survey in which activity was observed on the trail. Since the surveys occurred on
459
average every fifteen days the actual duration of usage of a trail could be one to fourteen days
460 longer. N= 84 trails. 461 462 Number of days Fr eq ue nc y 0 50 100 150 200 250 300 350 0 10 20 30 40 50
23
463 464
Fig 3: Cumulative number of newly opened tunnel entrances at each survey over the monitoring
465
period for the two A.capiguara nests studied.
466 467
Nov Jan Mar May Jul Sep Nov
Date of survey Nu m be ro f n ew tu nn el en tra nc es (c um ul at ed ) 0 5 10 15 20 25 Nest 1 Nest 2
24
468 469
Fig 4: Cumulated monthly rainfall (in mm) recorded at Bauru (22.355°S –49.0°W - Altitude:
470
620m), at about 100Km distance from the study site, from November 2011 to November 2012.
471
Data provided by the Centro de Meteorologia de Bauru - FC/Unesp. Superimposed is the monthly
472
number of newly opened tunnel entrances for the two nests studied over the monitoring period.
473 474
Nov Jan Mar May Jul Sep
Cu m ul at ed rain fal l(mm) 0 50 100 150 200 250 300 0 1 2 3 4 5 6 Nu m be ro f n ew tu nn el en tra nc es Nest 1 Nest 2
25
475 476
Fig 5: Distance from the nest of newly opened tunnel entrances, at each survey over the
477
monitoring period for the two A.capiguara nests studied. Each point corresponds to a single
478
tunnel entrance. The solid line shows the prediction of a GAM model and the dashed lines the
479
95% confidence interval of the prediction.
480 481
Nov Jan Mar May Jul Sep
Date of survey Di sta nc e to th e ne st (m ) 0 5 10 15 20 25 Nest 1 Nest 2
26
482 483
Fig 6: Evolution of tunnel entrance status over the monitoring period for (a) nest 1 and (b) nest 2.
484
The tunnel entrances were categorized as closed (when the entrance hole’s opening was no longer
485
visible), open but inactive (without ant foraging activity), open with dispersed foraging activity
486
around when isolated workers could be spotted but no foraging trails departing from them were
487
visible, and open with one or several foraging trails departing from them with ant traffic.
488 489 Nov Jan Mar May Jul Sep Nov Tunnel entrance Da te o f su rv ey 1 2 3 4 5 6 7 8 9 10 11 12 13 14 15 16 17 18 19 20 21 22 23 24
a
Closed holesOpen holes without activity
Open holes with foraging activity around Open holes with active foraging trails
b
Tunnel entrance
27
490 491
Fig 7: Length of the newly created foraging trails at each survey over the monitoring period for
492
the two A.capiguara nests studied. Each point corresponds to a single trail. The solid lines show
493
the predictions of a GAM model and the dashed lines the 95% confidence interval of the
494
predictions.
495 496
Nov Jan Mar May Jul Sep
Date of survey Tr ail le ng th (m ) 0 5 10 15 20 25 Nest 1 Nest 2